
Article Figures & Data
Figures
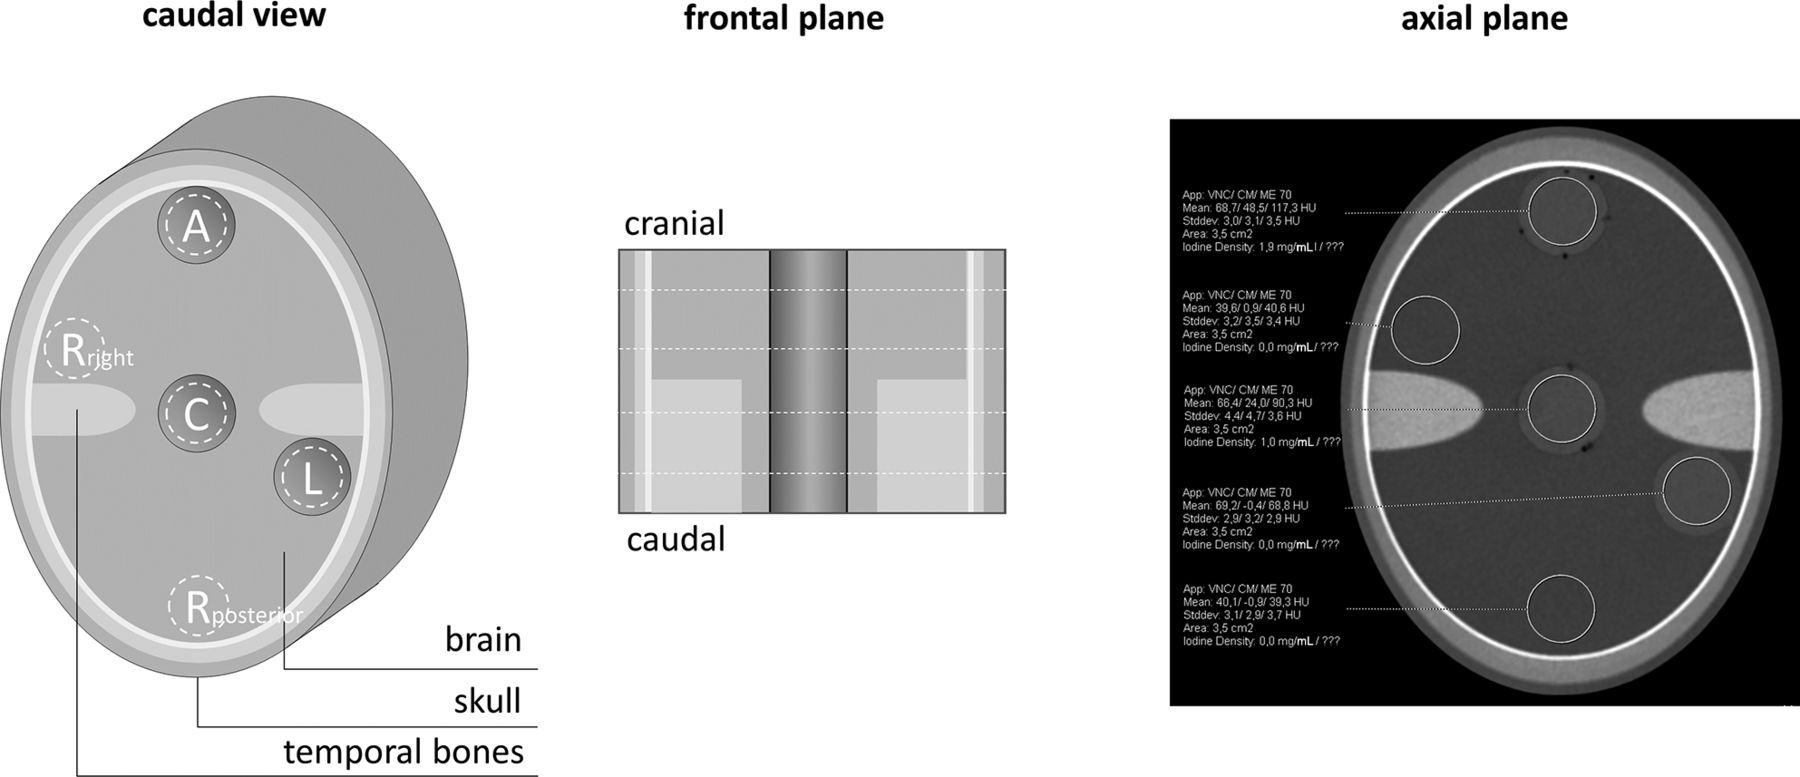
- FIG 1.
The schematic structure of the phantom and the respective positions of measurement. A indicates anterior; C, central; L, left; Rposterior, posterior reference; Rright, right reference).
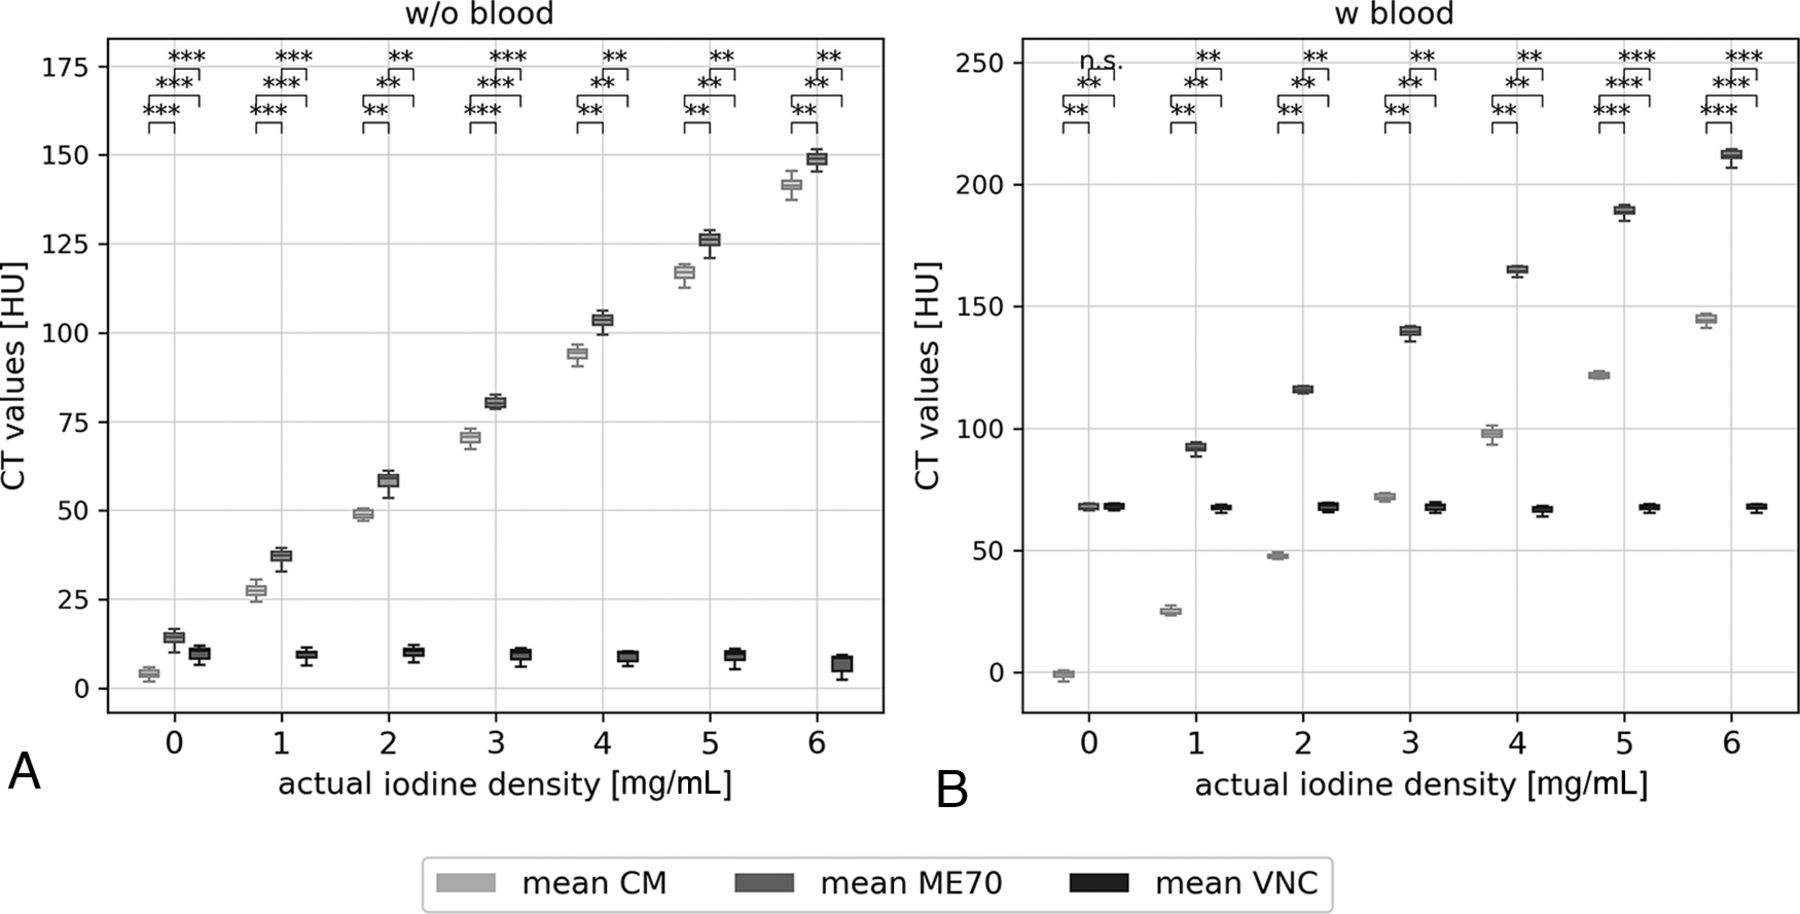
- FIG 2.
Measured CT values within the samples without (A) and with (B) blood, at all positions (anterior, center, left) and on all slices (next and above the temporal bone structures) presented in boxplots. CT values are compared among ME70, the CM map, and VNC. Statistically significant differences are marked. n.s. indicates P > . 05; *, P < . 05; **, P < . 01; ***, P < . 001).
- FIG 3.
Linear regression of initial and measured iodine concentration of the samples. Reference samples without (A) and with (B) blood including all positions (anterior, center, left) and the compared between-sections above and next to temporal bone (tb) structures.
- FIG 4.
Bland-Altman plots showing the means and differences between the measured and actual iodine concentrations in samples without (A) and with (B) blood. All positions (anterior, center, and left) and sections (above and next to temporal bone structures) are considered. W/o indicates without; w, with.


Jump to section
Related Articles
Cited By...
- No citing articles found.