
SUMMARY:
In this anthropomorphic head phantom study, samples containing blood and contrast agent with concentrations ranging from 0 to 6 mg iodine per milliliter and another set of samples without blood for reference were scanned with a photon-counting detector CT using a standard cranial protocol. It was demonstrated that photon-counting detector CT can reliably distinguish hemorrhage and contrast media, including density determination of the latter. The technology promises to add value in several neuroimaging applications.
ABBREVIATIONS:
- CM
- contrast media
- ME70
- virtual monoenergetic image at 70 keV
- PCD
- photon-counting detector
- VNC
- virtual noncontrast
In recent years, the field of intracranial endovascular intervention has gained expertise and application due to the therapeutic benefit that minimally invasive treatment provides.1 Intracranial interventions, such as recanalization or embolization procedures, usually require an unenhanced control CT scan to rule out possible bleeding. However, distinguishing hemorrhage from contrast enhancement that may have passed the BBB during the intervention is challenging due to their similar x-ray attenuation.2,3
Photon-counting detector CT (PCD-CT) is a promising technology that has the potential to facilitate the differentiation of contrast-enhancement media and hemorrhage following neurointerventional procedures in clinical routine. This scanner inherently acquires spectral information that allows postprocessing steps including material differentiation.4 Accordingly, a CT scan can be separated into the attenuation resulting from remaining iodine and soft tissue, generating contrast media (CM) maps and virtual noncontrast (VNC) series. The instant availability of this information promises to improve the diagnostic confidence and the associated therapeutic decision.
The purpose of this in vitro study was to evaluate the ability of PCD-CT to precisely distinguish between blood and iodine at various iodine concentrations, including the precise determination of the CM attenuation within an anthropomorphic head phantom.
MATERIALS AND METHODS
Phantom
The phantom used in this study replicates the human brain anatomy and comprises brain-equivalent tissue with constant CT values, surrounded by high x-ray-absorbing structures that simulate the skull and temporal bones (PFO-Kalotte; Quality assurance in Radiology and Medicine). Additionally, 3 cylindric holes at the center, anterior, and lateral aspects, directly beneath the skull, allow inserts.
Insert Composition
Iodine concentrations from 0 to 6 mg/mL with 1 mg/mL increments were included in this study. As a reference, 1 series of concentrations consisted solely of iodine (30 mg/mL) and sodium chloride (0.9%). The second series was designed to represent the actual clinical scenario of iodine mixed with blood. Red cells from an outdated blood donation were diluted with glucose (40%) and mixed with iodine and sodium chloride in a constant ratio (2 shares of blood, 1 share of glucose, 1 share of iodine diluted with sodium chloride) to simulate blood. All solutions were adjusted to a total volume of 120 mL to fill the whole of the phantom with a stand-off on both sides.
CT Protocol
All samples were scanned on a novel PCD-CT (NAEOTOM Alpha; Siemens) with a standard clinical cranial CT protocol at all 3 phantom insert positions, respectively. Scans were acquired single-source at a tube voltage of 120 kV(peak) in a spiral mode with a pitch of 0.55. The reference tube current time product was adjusted by setting the image quality level to 280, and the single/total collimation was 0.4/38.4 mm.
Image Reconstruction
Images were iteratively reconstructed (Q2, quantum iterative reconstruction, QIR; Siemens) on the scanner console (Version VA50A) using a quantitative regular kernel (Qr40). Spectral postprocessing series were generated to fully preserve spectral image information for further analyses. Section thickness and increment were set to 1.0/0.4 mm.
Image Analysis
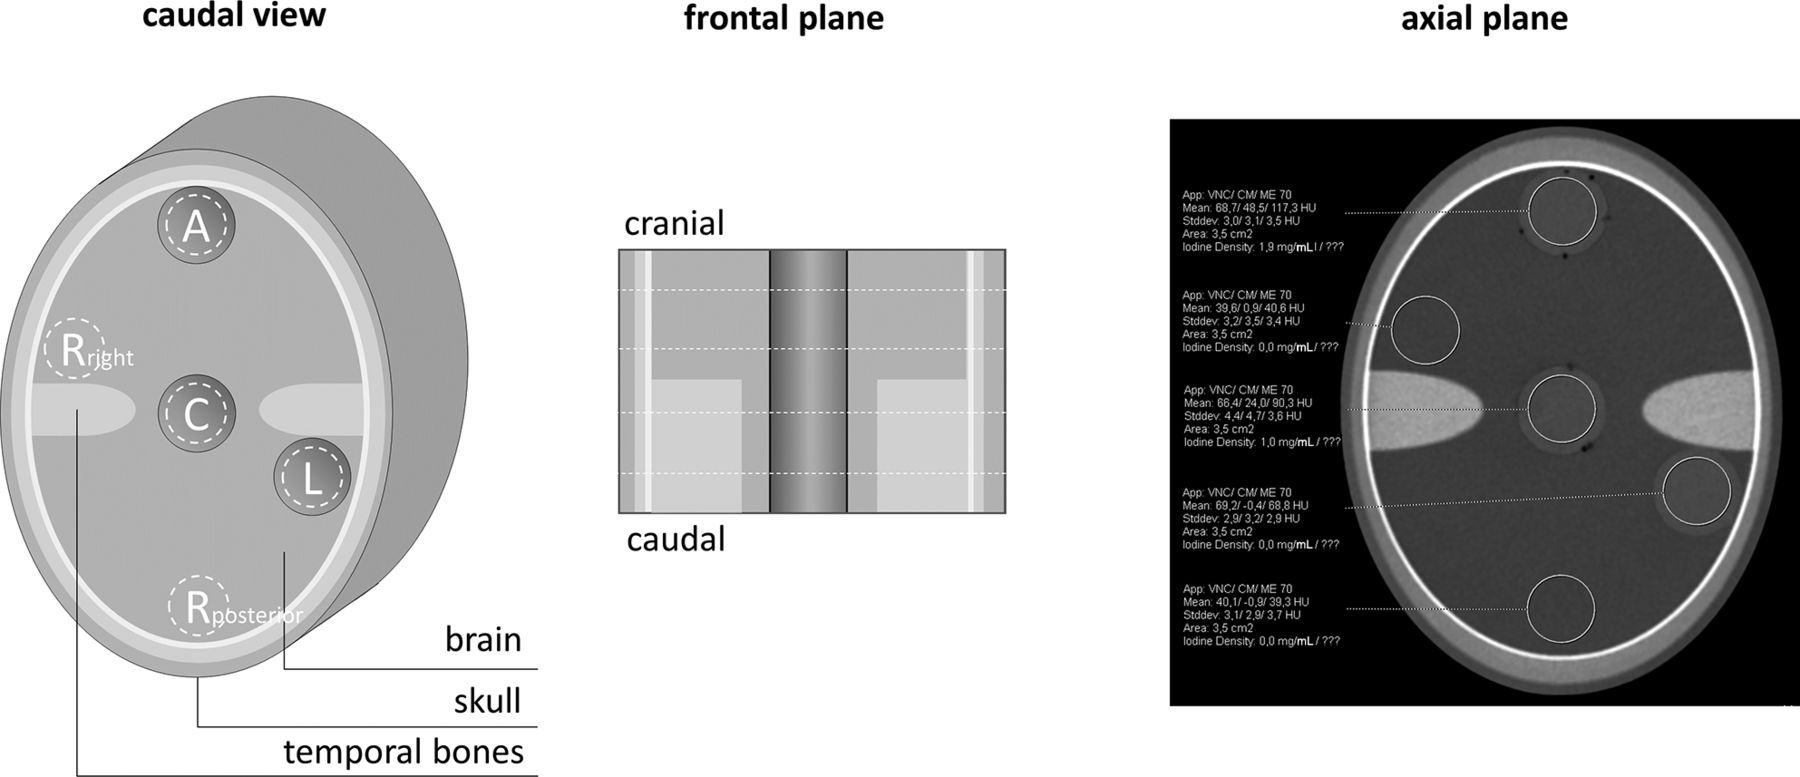
Image analysis was performed on a dedicated workstation (syngo.via, Version VB70A; Siemens) in a dual-energy workflow (virtual unenhanced application profile). Four different axial section positions were considered, 2 within and 2 out of the temporal bone section, approximately equally distributed from the cranial-to-caudal direction (Fig 1). Circular ROIs with a constant area of 3.5 cm2 were positioned centrally within the inserts, excluding possible air bubbles. In addition to the positions anterior (A), central (C), and left (L), 2 further reference measurements posterior (Rposterior) and right (Rright), which were arranged symmetrically to the axis of rotation. The calculated iodine concentration in milligrams per milliliter, as well as the mean and SD of CT values in Hounsfield units for the CM map, the virtual monoenergetic image at 70 keV (ME70), and the VNC image were recorded. The noise level was defined as the SD of CT values measured within the reference ROIs (Rposterior and Rright).

The schematic structure of the phantom and the respective positions of measurement. A indicates anterior; C, central; L, left; Rposterior, posterior reference; Rright, right reference).
Statistical Analyses
Statistical analyses were conducted using Python (Version 3.9). Data were tested for normal distribution using the Shapiro-Wilk test. To assess differences, we used the paired t test and the Wilcoxon signed-rank test for parametric and nonparametric data, respectively. In case of multiple comparisons, P values were adjusted using the Bonferroni method. Continuous data are given as mean (SD) or as median (interquartile range) for parametric or nonparametric data. The accuracy of linear regression analysis was assessed using the coefficient of determination (r2). Statistical significance was set at P values < .05.
RESULTS
The effective milliampere-seconds, volume CT dose index, and dose-length product were 170 mAs, 30.6 mGy, and 533 mGy × cm for each scan, respectively.
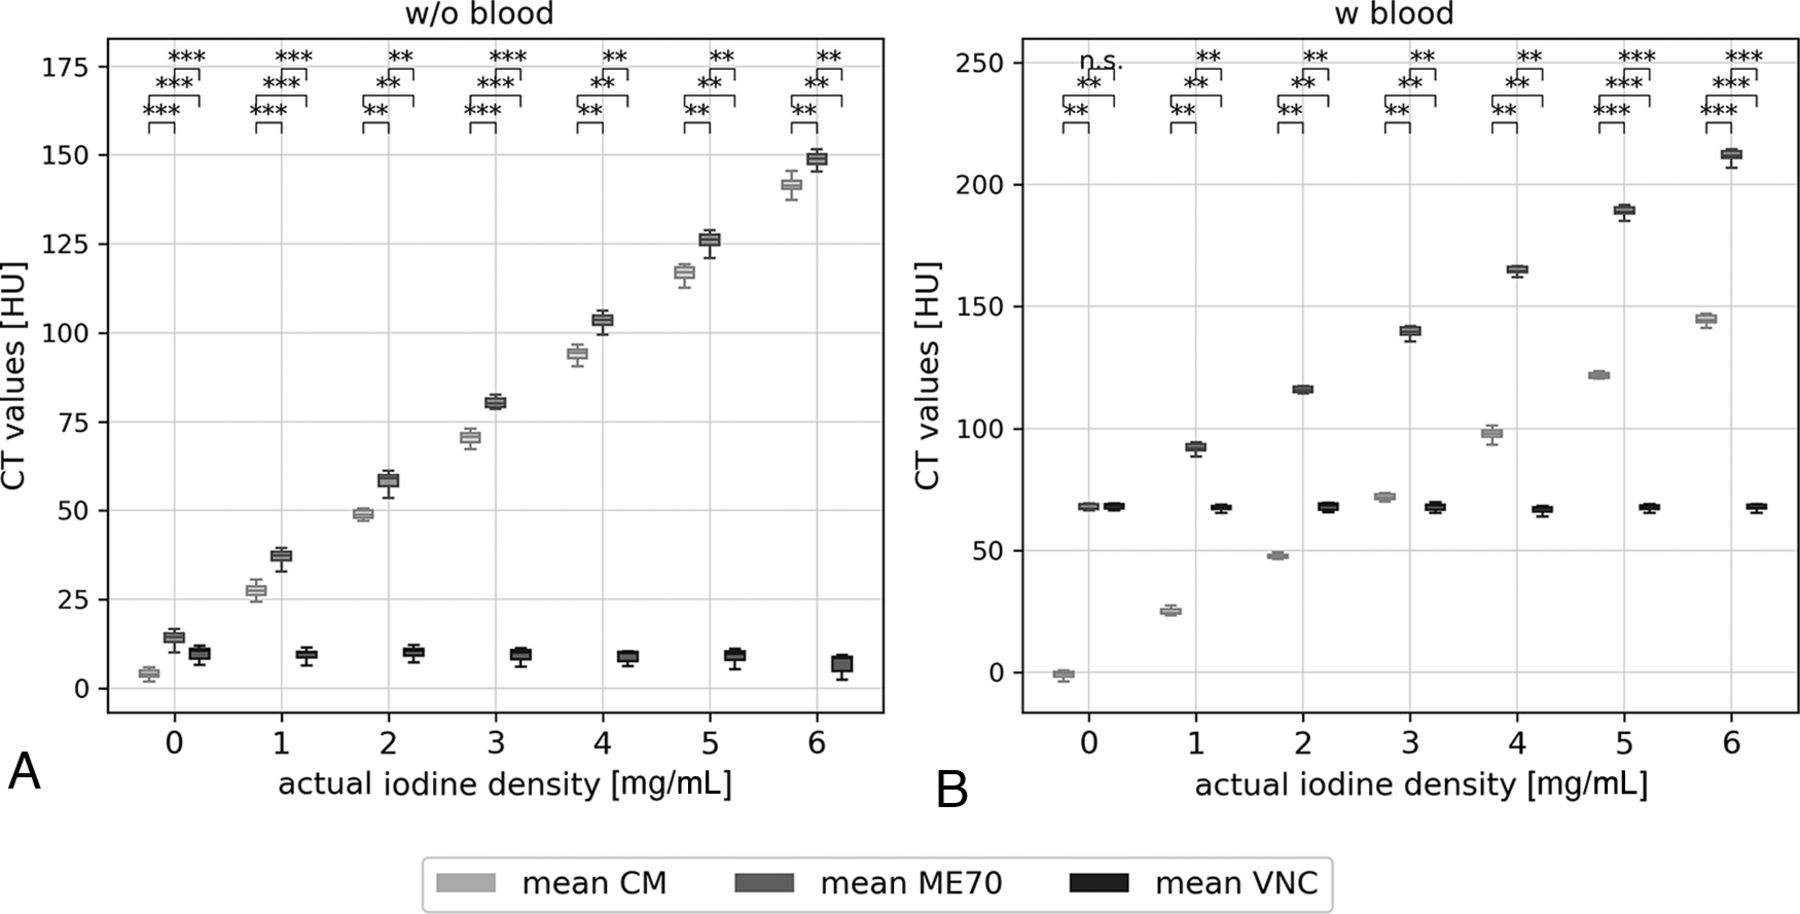
The general noise level was 3.5 (3.3–3.7) HU. All measurements of CT values within the reference and the blood samples are demonstrated in Fig 2. The reference probes without blood show low CT values for an actual iodine attenuation of 0 mg/mL with means of 3.8, 13.7, and 9.9 for CM, ME70, and VNC, respectively. With increasing iodine concentrations, Hounsfield units of CM and ME70 rise accordingly in ∼22-HU steps with a significant (all, P < .01), albeit a small, constant distance of <10 HU from each other, attributable to the attenuation of the sodium chloride. Meanwhile VNC CT values remained constant around 9 HU. Results from blood-containing probes were even more accurate. At zero iodine concentration, ME70 and VNC showed no significant difference (P = .12), and the mean CT values on CM were close to 0 HU (–0.9 [SD, 1.6] HU). A linear increase of CT values of ME70 and CM was observed with increasing iodine attenuation, but with a larger distance in measurement to each other (∼67 HU) due to the blood attenuation. On VNC, CT values were consistent with smaller SDs compared with the nonblood samples.

Measured CT values within the samples without (A) and with (B) blood, at all positions (anterior, center, left) and on all slices (next and above the temporal bone structures) presented in boxplots. CT values are compared among ME70, the CM map, and VNC. Statistically significant differences are marked. n.s. indicates P > . 05; *, P < . 05; **, P < . 01; ***, P < . 001).
Figure 3 shows the regression analysis between the actual and measured iodine concentrations of the reference samples without blood and the samples with blood and glucose. The regression lines demonstrate a perfect linear relationship with an r2 value of 1.0. However, the measured iodine concentrations are slightly underestimated with increasing actual concentration, indicated by the slope of 0.9. ROI positioning above or next to the temporal bone structures showed no influence on the measurement and largely overlapped. Figure 4 shows that the mean difference between the actual and measured iodine concentrations is –0.2 mg/mL, which is consistent for both reference and the blood samples.

Linear regression of initial and measured iodine concentration of the samples. Reference samples without (A) and with (B) blood including all positions (anterior, center, left) and the compared between-sections above and next to temporal bone (tb) structures.

Bland-Altman plots showing the means and differences between the measured and actual iodine concentrations in samples without (A) and with (B) blood. All positions (anterior, center, and left) and sections (above and next to temporal bone structures) are considered. W/o indicates without; w, with.
DISCUSSION
In this study, we analyzed several blood samples with iodine concentrations ranging from 0 to 6 mg/mL in an anthropomorphic head phantom and tested the ability of PCD-CT to discriminate CM and to determine its exact concentration. We found that the spectral data of PCD-CT provide reliable differentiation between iodine- and noniodine-caused attenuation, regardless of the presence of blood or the height of CM concentration. Moreover, we demonstrated the feasibility of iodine concentration determination using PCD-CT.
In patients with acute ischemic stroke, the BBB disruption can lead to contrast enhancement of the infarcted area in the first few hours following mechanical thrombectomy. Distinguishing between contrast pooling and subarachnoid or parenchymal hemorrhage is crucial for patient management and outcome.5,6 Additionally, this differentiation is important for other neurointerventions, such as embolization procedures for aneurysms, AVMs, dural AVFs, and, more recently, embolization of the middle meningeal artery for treatment of chronic subdural hematomas.7⇓-9 During these interventions, hemorrhages can easily occur and must be distinguished from extravasation of CM or contrast enhancement.
CT is the imaging technique of choice because it is widely available and allows a rapid and accurate diagnosis. With conventional single-energy CT, however, a differentiation of blood and CM is extremely difficult due to the similar attenuation behavior of x-rays.10 Spectral information, such as provided by dual-energy CT, allows performing material decomposition into attenuation shares caused by contrast and noncontrast media11 and, therefore, has a wide range of application in neuroradiologic interventions.7 The introduction of PCD-CT into clinical routine provides inherently spectral information and simultaneously overcomes limitations of conventional energy-integrating detectors with higher spatial resolution and the absence of electronic noise.4
This study used the standard cranial CT protocol for the anthropomorphic head phantom, to achieve dose results comparable with those of clinical in vivo scans. Analysis of Hounsfield units showed that iodine and blood are clearly distinguishable regardless of the underlying iodine attenuation. Furthermore, material decomposition of iodine and noniodine shares appears to be more accurate in samples with blood than in reference samples with only sodium chloride. Furthermore, differences of 1 mg/mL in iodine concentration can clearly be discriminated in CT values. The automated calculation of the underlying iodine attenuation shows a perfect linear correlation to the actual one, albeit with an increasing underestimation for higher concentrations. However, these inaccuracies may be partly due to several limitations. First, the accuracy of the instruments used and possible human error could affect the samples and their actual iodine concentrations. Second, a homogeneous distribution of CM within the volume of the sample could not be guaranteed, possibly having led to local variation and, therefore, measurement errors. Third, the experiment is of an in vitro nature, and further studies are necessary to translate the results into clinical benefits for patient care.
CONCLUSIONS
PCD-CT proved to be a reliable tool for differentiating blood and iodine and accurately determining several iodine concentrations in an anthropomorphic head phantom. These findings suggest the potential of PCD-CT for various applications in neuroimaging. Further studies should investigate the use of PCD-CT for imaging of brain hemorrhage with differentiation between calcification and hemorrhage, prediction of hematoma expansion on unenhanced CT and CTA,12 as well as the identification of hemorrhagic tumors in hemorrhages of unknown origin.13
Footnotes
F. Schwarz and C. J. Maurer contributed equally to this work.
Disclosure forms provided by the authors are available with the full text and PDF of this article at www.ajnr.org.
References
- Received September 22, 2023.
- Accepted after revision November 7, 2023.
- © 2024 by American Journal of Neuroradiology


Jump to section
Related Articles
Cited By...
- No citing articles found.