
Abstract
BACKGROUND AND PURPOSE: Pathological changes in the intracranial aneurysm wall may lead to increases in its permeability; however the clinical significance of such changes has not been explored. The purpose of this pilot study was to quantify intracranial aneurysm wall permeability (Ktrans, VL) to contrast agent as a measure of aneurysm rupture risk and compare these parameters against other established measures of rupture risk. We hypothesized Ktrans would be associated with intracranial aneurysm rupture risk as defined by various anatomic, imaging, and clinical risk factors.
MATERIALS AND METHODS: Twenty-seven unruptured intracranial aneurysms in 23 patients were imaged with dynamic contrast-enhanced MR imaging, and wall permeability parameters (Ktrans, VL) were measured in regions adjacent to the aneurysm wall and along the paired control MCA by 2 blinded observers. Ktrans and VL were evaluated as markers of rupture risk by comparing them against established clinical (symptomatic lesions) and anatomic (size, location, morphology, multiplicity) risk metrics.
RESULTS: Interobserver agreement was strong as shown in regression analysis (R2 > 0.84) and intraclass correlation (intraclass correlation coefficient >0.92), indicating that the Ktrans can be reliably assessed clinically. All intracranial aneurysms had a pronounced increase in wall permeability compared with the paired healthy MCA (P < .001). Regression analysis demonstrated a significant trend toward an increased Ktrans with increasing aneurysm size (P < .001). Logistic regression showed that Ktrans also predicted risk in anatomic (P = .02) and combined anatomic/clinical (P = .03) groups independent of size.
CONCLUSIONS: We report the first evidence of dynamic contrast-enhanced MR imaging–modeled contrast permeability in intracranial aneurysms. We found that contrast agent permeability across the aneurysm wall correlated significantly with both aneurysm size and size-independent anatomic risk factors. In addition, Ktrans was a significant and size-independent predictor of morphologically and clinically defined high-risk aneurysms.
ABBREVIATIONS:
- DCE
- dynamic contrast-enhanced
- IA
- intracranial aneurysm
- ISUIA
- International Study of Unruptured Intracranial Aneurysms
- Ktrans
- contrast-transfer coefficient
- VL
- fractional volume of extravascular extracellular space per unit tissue
Intracranial aneurysms (IAs) affect 2%–6% of the population, with nearly 30,000 Americans having an aneurysm rupture each year.1 Aneurysmal subarachnoid hemorrhage has an approximate 50% mortality, with survivors incurring a tremendous personal and financial burden due to permanent disabilities. Despite the potential devastating effects of IAs, the universal treatment of unruptured IAs still remains controversial. The largest prospective study to date on unruptured IAs, the International Study of Unruptured Intracranial Aneurysms (ISUIA), indicated lower rupture rates than previously suspected.2 However, multiple subsequent reports challenged these findings,3,4 thus further complicating management decisions. The exact pathogenesis and pathoevolution of IAs is largely unknown, with only a fraction of IAs progressing to rupture annually (<2%), suggesting potential differences in the pathobiology of ruptured-versus-unruptured IAs. Aneurysm risk stratification has been attempted by identifying specific characteristics of ruptured IAs, including size, location, and morphologic factors (eg, irregular contour5 and daughter sacs6), but also clinical factors, such as symptomatic lesions, hypertension, smoking, alcohol/drug abuse, and genetic predispositions to aneurysm formation/rupture. However, without absolute risk-stratification parameters for unruptured IAs, patients and physicians encounter difficult management decisions regarding the risk-benefit analysis for treatment. Aneurysm size measured by CTA, MRA, or DSA is the primary imaging marker of rupture risk and is used for clinical decisions to either treat with coil embolization/microsurgical clipping or offer conservative management with routine imaging follow-up evaluations and clinical risk-factor control.
The pathobiology of IAs and alterations in the aneurysm wall have been shown to involve a multitude of histopathologic changes, such as disruption of the internal elastic lamina, smooth-muscle cell migration, and myointimal hyperplasia leading to irregular surfaces with variable thickness. In fact, direct inspection of the IA wall during surgery has demonstrated heterogeneous features, such as thin translucent regions,7 but these are not resolved with noninvasive imaging. Noninvasive CT or MR imaging of the morphologic phenotype of the aneurysm wall may be useful in assessing IA stability. It is plausible, given the aforementioned changes in IA wall histology, specifically apoptosis of endothelial cells, loss of collagen, and remodeling of the extracellular matrix, that contrast agents could extravasate or permeate these compromised areas into the surrounding CSF. This may be interpreted as a macroscopic manifestation of microscopic tracer permeability, which occurs through the capillary bed into tissue. The contrast agent permeability rate (Ktrans) could then provide a surrogate measure of vessel wall integrity and focal degradation resulting from environmental factors such as hemodynamic stresses, typically assessed with advanced MR imaging acquisitions8 and postprocessing algorithms.9
The purpose of this work was to determine the feasibility of quantifying aneurysm wall permeability by using widely available dynamic contrast-enhanced (DCE)–MR imaging. Our goal was to develop an adjunctive imaging metric to complement existing anatomic and developing flow-based imaging markers of aneurysm risk (size, location, morphology, computational/4D flow dynamics). We report the results of a prospective pilot study comparing aneurysm wall permeability by using DCE–MR imaging with anatomic and clinical metrics that predispose IAs to rupture. We hypothesized that increased IA wall permeability may be associated with IA size, location, morphology, and multiplicity and clinically defined high-risk or symptomatic lesions.
Materials and Methods
Institutional review board approval was provided for patient recruitment and study. Informed consent was acquired, and the study was conducted according to Health Insurance Portability and Accountability Act guidelines. Consecutive patients with unruptured IAs reporting for neurosurgical consultation at our institution between July 2011 and July 2013 were prospectively recruited to undergo a contrast-enhanced MR imaging examination, including DCE–MR imaging for kinetic modeling of IA wall permeability to contrast agent. Patient demographics and clinical presentations were acquired by using the electronic medical data base of our institution. Major exclusion criteria were typical contraindications to MR imaging: pregnancy, contrast allergy, renal insufficiency, presence of MR imaging–incompatible implants, and prior IA treatment.
DCE–MR imaging–derived permeability metrics lack a recognized imaging standard of reference. To place reported permeability values in physiologic perspective, previous studies presented derived lesion values with a paired internal control, typically healthy tissue10⇓–12 (expected to have virtually no permeability) or the choroid plexus13 (lacks a blood-brain barrier, with high contrast-uptake rates).14 We followed a similar approach and present our reported aneurysm wall permeability values with those from paired healthy proximal segments of the middle cerebral artery and the choroid plexus.
Imaging Protocol
All patients were scanned on 3T (Magnetom Trio; Siemens, Erlangen, Germany) or 1.5T (Avanto; Siemens) MR imaging scanners. A 3D time-of-flight MRA sequence was used to localize the IA. IA wall permeability was measured by using a standard DCE–MR imaging protocol. DCE–MR images were acquired by using a standard multiphase 3D gradient-recalled-echo–based pulse sequence that provided volumetric T1-weighted images every 5–8 seconds after contrast agent injection for approximately 10 minutes. Images were acquired by using the following parameters: TR/TE = 2.84/0.8 ms, matrix = 128 × 128–384 × 384, FOV = 190–220 mm, and 24 partitions placed to cover the IA, resulting in voxel dimensions of 0.58 × 0.58 × 2.0 mm—1.48 × 1.48 × 5.0 mm. Section thickness was adjusted from 5 to 2 mm to prevent partial volume contamination for smaller aneurysms. A single dose (0.1-mmol/kg) of T1-shortening contrast agent (gadopentetate dimeglumine, Magnevist; Bayer HealthCare Pharmaceuticals, Wayne, New Jersey) was injected during the DCE acquisition. Precontrast T1 values (T10) of the tissue were found by using a commonly used multi-flip angle routine (α = 5°, 10°, 12°, 15°, 20°, 25°) to fit the spoiled gradient-echo equation.15,16
Permeability Modeling
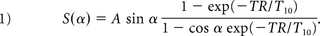
The permeability-limited Modified Tofts Model17 quantifies the kinetics of a tracer leaking through a semipermeable membrane with the following relationship:
 with Ktrans dictating the tracer transfer rate from the intravascular into the extracellular extravascular space with units of minute−1; kep = Ktrans/VL in units of minute−1, describing the ratio of the transfer rate (Ktrans) to the fractional volume of tracer in the extracellular extravascular space (VL); Cp(t), the intravascular tracer concentration; and Vp, the fractional plasma volume for each voxel. C(t) is measured adjacent to the aneurysm wall in the CSF. A Levenberg-Marquardt algorithm was used to find the Ktrans, VL, and Vp in Equation 2 that best fits the measured signal C(t) (Fig 1).

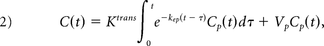
Aneurysm permeability modeling in a 14-mm right ICA aneurysm. In the IA, the signal time course from DCE imaging (A) is used to measure the plasma concentration, Cp(t) (red curve, B). The permeability signal, C(t), is subsequently modeled and fit for every voxel to Equation 2. The signal from a single voxel selected from the white circled region adjacent to the IA (white diamonds, B) and fit (yellow curve, B) are shown. The fitting of all voxels derives permeability parameters (Ktrans, VL, and Vp, C). Note the observed signal next to the aneurysm has nearly 3-fold the signal intensity as background (BG) enhancement (blue curve, B). ROIs were placed adjacent to a healthy artery (left panel, D) and the area of highest permeability, next to the IA (right panel, D).
Data Analysis and Imaging Evaluation
A neuroradiologist (S.A.A.) classified IA locations (anterior-versus-posterior circulation as per ISUIA) and smooth-versus-irregular morphology (asymmetries, daughter sacs, blebs, or protrusions) and measured size indices, such as dome height, width, and neck diameter, by using available cross-sectional CTA and 3D rotational DSA datasets on a multiplanar postprocessing Leonardo workstation (Siemens).
Mean values of Ktrans and VL were calculated in ROIs containing a minimum of 10 pixels, adjacent to the aneurysm wall. A neuroradiologist (S.A.) and MR imaging physicist (T.J.C.), blinded to the patient clinical data and MR imaging results and each with >10 years of experience in MR image analysis, independently placed ROIs on a single section containing the aneurysm that had the highest permeability values observed (Fig 1D). Scores from both reviewers were averaged to determine the mean permeability for each aneurysm. In the event that there was not significant agreement between observers, IA data would be evaluated independently for each observer. To exclude intraluminal tissue in Ktrans modeling, we considered only voxels with a corresponding Vp smaller than 0.5 (Vp < 0.5) (ie, the DCE signal of the voxel could not have >50% vascular contamination). Mean Ktrans and VL values were also measured adjacent to the wall of a healthy MCA (Fig 1D) and the choroid plexus in each patient as a paired internal control. Permeability modeling and analysis were performed by using in-house software developed in Matlab (MathWorks, Natick, Massachusetts).
Statistical Analysis
Interobserver agreement in measured permeability values was compared by using the Mann-Whitney U Test for continuous variables, linear regression, intraclass correlation statistics, and Bland-Altman analysis. We compared average aneurysm Ktrans and VL measurements with those from the paired control MCA and choroid plexus by using paired Student t tests to determine whether our DCE aneurysm measurements were significantly different.
We evaluated wall permeability as a marker of IA rupture risk by comparing it against established clinical and anatomic/imaging metrics. First, IAs were grouped into ISUIA-determined size-based risk categories (<7, 7–12, 13–24, and ≥25 mm) and were compared with DCE parameters (Ktrans, VL) by using a regression model. Second, IAs were classified into high-risk and low-risk categories by using 2 size-independent risk assessment paradigms. In clinical risk paradigm A, high-risk aneurysms were those that presented with neurologic symptoms relevant to the location of the aneurysm (headaches, mass effect, cranial neuropathy); asymptomatic aneurysms were low-risk. In risk paradigm B, high-risk aneurysms had 1 of the following 4 imaging/anatomic properties: 1) multilobulated dome or blebs as defined by DSA or CTA, 2) patient presenting with multiple IAs, or 3) located in the posterior circulation; all others were defined as low-risk. Size indices were not used to define the risk profile for any aneurysm in group A or B.
Separate univariate logistic regression analyses were performed for groups A and B. High- and low-risk groups were compared with aneurysm size indices (aspect ratio, maximum IA dome size, neck diameter) and DCE parameters. Patient demographics (age/sex), history of hypertension, hyperlipidemia, tobacco/alcohol abuse, and statin use have been identified by ISUIA as clinical risk contributors to IA rupture. These known risk factors were also subjected to univariate logistic regression analysis. Candidate variables for multiple logistic regression analysis were selected on the basis of statistically significant univariable relationships. Multivariable logistic regression analysis was then performed to evaluate independent predictors of risk in the aforementioned risk paradigms/groups. Significance was defined as <.05 in all statistical tests.
Results
Patient Demographics
Twenty-five consecutive patients consented to participate in the study and were scanned. Two patients were excluded for the following reasons: significant susceptibility artifacts from a pre-existing intracranial stent (n = 1) and severe patient motion during the study (n = 1) rendering images nondiagnostic. In total, 27 aneurysms in 23 patients (mean age, 60.7 ± 12.2 years; age range, 30–82 years), 13 women (mean age, 58.8 ± 12.9 years; range, 30–76 years) and 10 men (mean age, 63.1 ± 11.5 years; range, 39–8 years) were included in the study. There was no significant difference between men and women in age (P = .42), Ktrans (P = .84), VL (P = .91), or IA size (P = .65). All IAs were unruptured when imaged. The On-line Table provides relevant patient demographics, risk factors, and risk-group assignment. Note that the column labeled “Sx (Group A)” denotes IAs that are symptomatic and therefore in risk category A. Three aneurysms in our cohort were fusiform, and 24 were saccular. To control for potentially different pathology, we performed statistical analyses on saccular and fusiform aneurysms separately. As a result, fusiform IA imaging markers were not used for risk analysis.
Imaging Findings
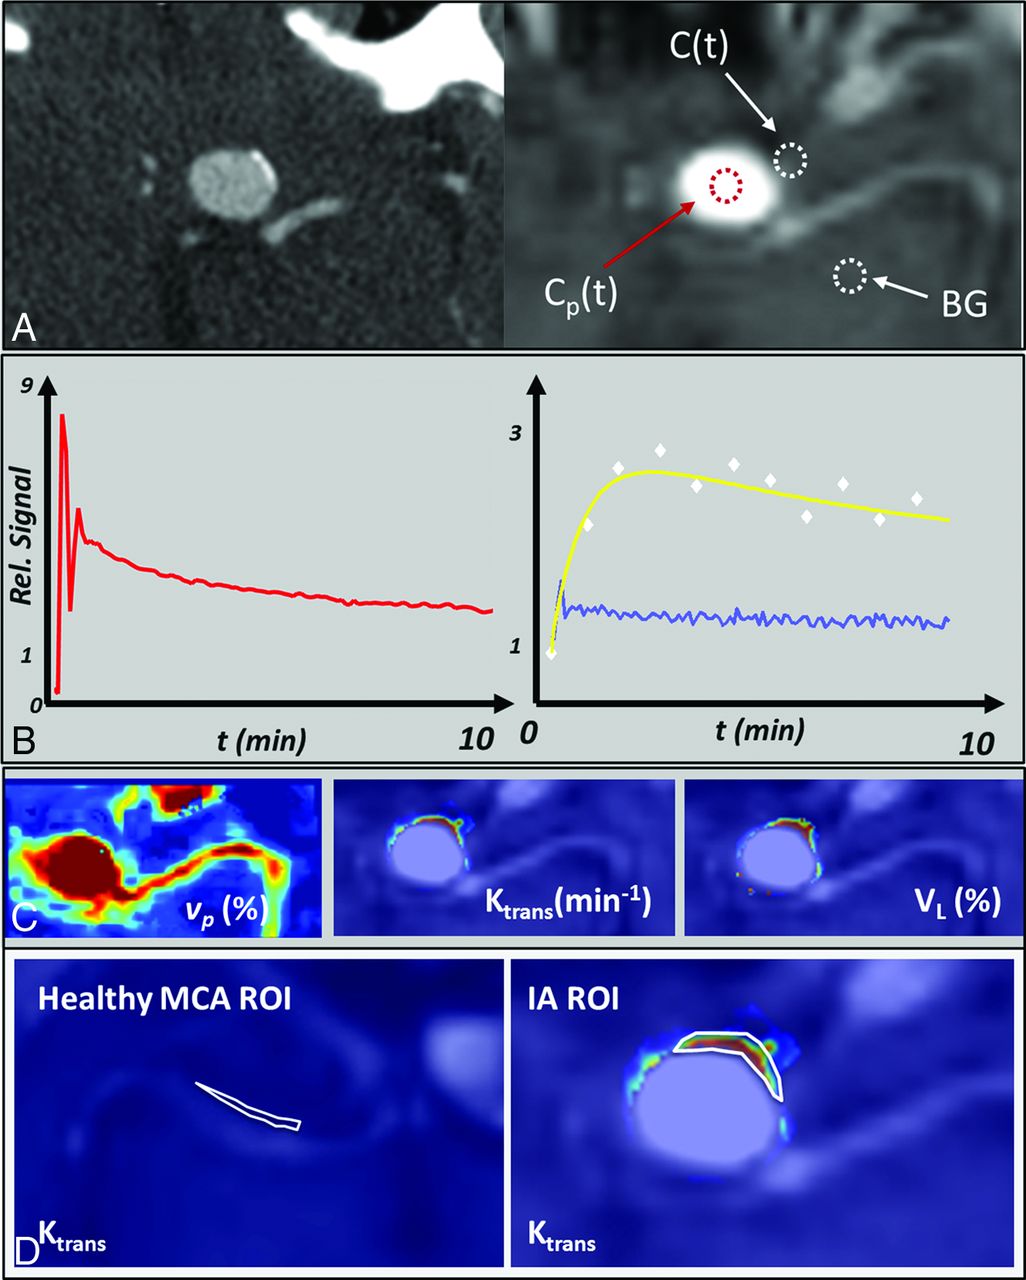
Interobserver agreement in measurements of Ktrans and VL was strong. Independent measurements made by 2 observers were not statistically different from one another (Ktrans, P = .89; VL, P = .86, Mann-Whitney U Test). Furthermore, intraclass correlation coefficients between the 2 observers showed strong and highly significant agreement (Ktrans: intraclass correlation coefficient = 0.93, P < .001; VL: intraclass correlation coefficient = 0.92, P < .001). In Fig 2, measured Ktrans and VL values from both observers were highly correlated (Ktrans: R2 = 0.84, slope = 0.92, intercept = 0.007; VL: R2 = 0.92, slope = 1.08, intercept = −0.013, data not shown), and Bland-Altman analysis revealed a small mean bias and little variability over a broad range of values (bias ± SD: Ktrans = 0.003 ± 0.03 minute−1; VL= 0.3% ± 4%, data not shown).

Correlation and Bland-Altman analysis between measured Ktrans values of both observers reveal strong agreement in derived values. VL is not shown.
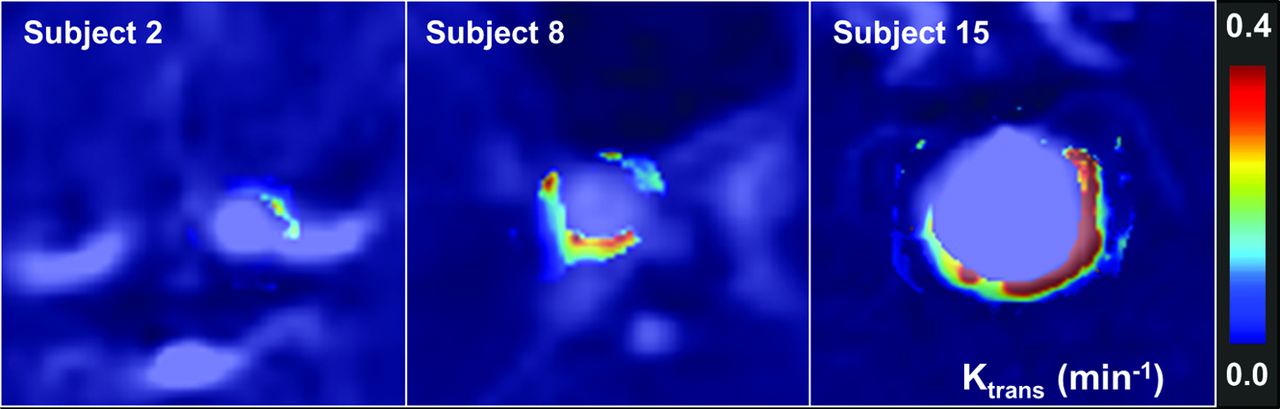
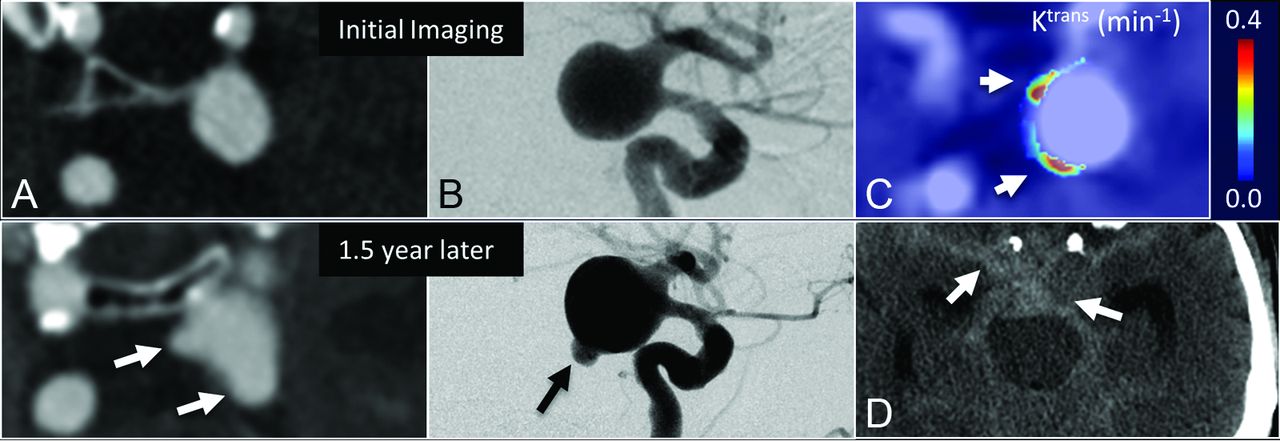
Aneurysms were found to have a broad range of associated wall permeability values as shown in a series of 3 subjects in Fig 3. Figure 4 shows a representative case of a 14-mm aneurysm in a 61-year-old man. Initial imaging with DSA and CTA confirmed the presence of a smooth, regular saccular aneurysm of the posterior communicating artery. At the same time, Ktrans imaging showed an inhomogeneous presentation of contrast agent leakage with Ktrans = 0.22 minutes−1 and 0.19 minutes−1 in the anterior (Fig 4C, top arrow) and posterior (Fig 4C, bottom arrow) walls, respectively. The patient elected to forgo treatment. Eighteen months after initial imaging, follow-up CTA was acquired due to symptom onset consistent with SAH. CTA and DSA demonstrated extensive intracranial bleeding deemed to be resulting from 2 newly observed daughter sacs coincidental with areas of prior elevated Ktrans.

DSA and Ktrans permeability images demonstrate a broad distribution of wall permeability values. Notice the heterogeneity in Ktrans both among subjects and within a single IA.

The evolution of an untreated posterior communicating artery IA in a 61-year-old man demonstrates that elevated Ktrans at baseline correlated with bleb formation. Morphologic changes during 1.5 years are observed on CTA (A) and DSA (B); however, DCE–MR imaging demonstrates 2 regions with high Ktrans (arrows, C) at the time of imaging—apparently correlating with eventual SAH seen on CT (arrows, D).
DCE Sensitivity to Pathology
We found that the Ktrans associated with saccular aneurysm walls was larger than values observed in the normal-appearing MCA (mean, 0.1219 ± 0.0130 minutes−1 versus 0.0053 ± 0.0007 minutes−1, respectively; P < .001) and smaller than values found in the choroid plexus (mean, 0.4058 ± 0.0567 minutes−1; P < .001). There was a significant difference between saccular IA VL and that of the parent artery (mean, 13.2% ± 2.3% versus 1.3% ± 0.2%; P = .0014), but not between IA VL and the choroid plexus (mean, 13.5% ± 3.7%; P = .85). Fusiform IAs Ktrans (mean, 0.0444 ± 0.0065 minutes−1) was significantly larger than that in healthy vessels (P < .001) and smaller than that in the choroid plexus (P = .035). Similarly, fusiform IA VL (mean, 8.1 ± 2.3 minutes−1) was larger than that of healthy vessels (P < .001) and less, though not significantly, than the VL measured in the choroid plexus. Fusiform IA Ktrans and VL were smaller than saccular IA Ktrans and VL, but not significantly (P = .06 and .48, respectively).
Statistical Analysis of Risk
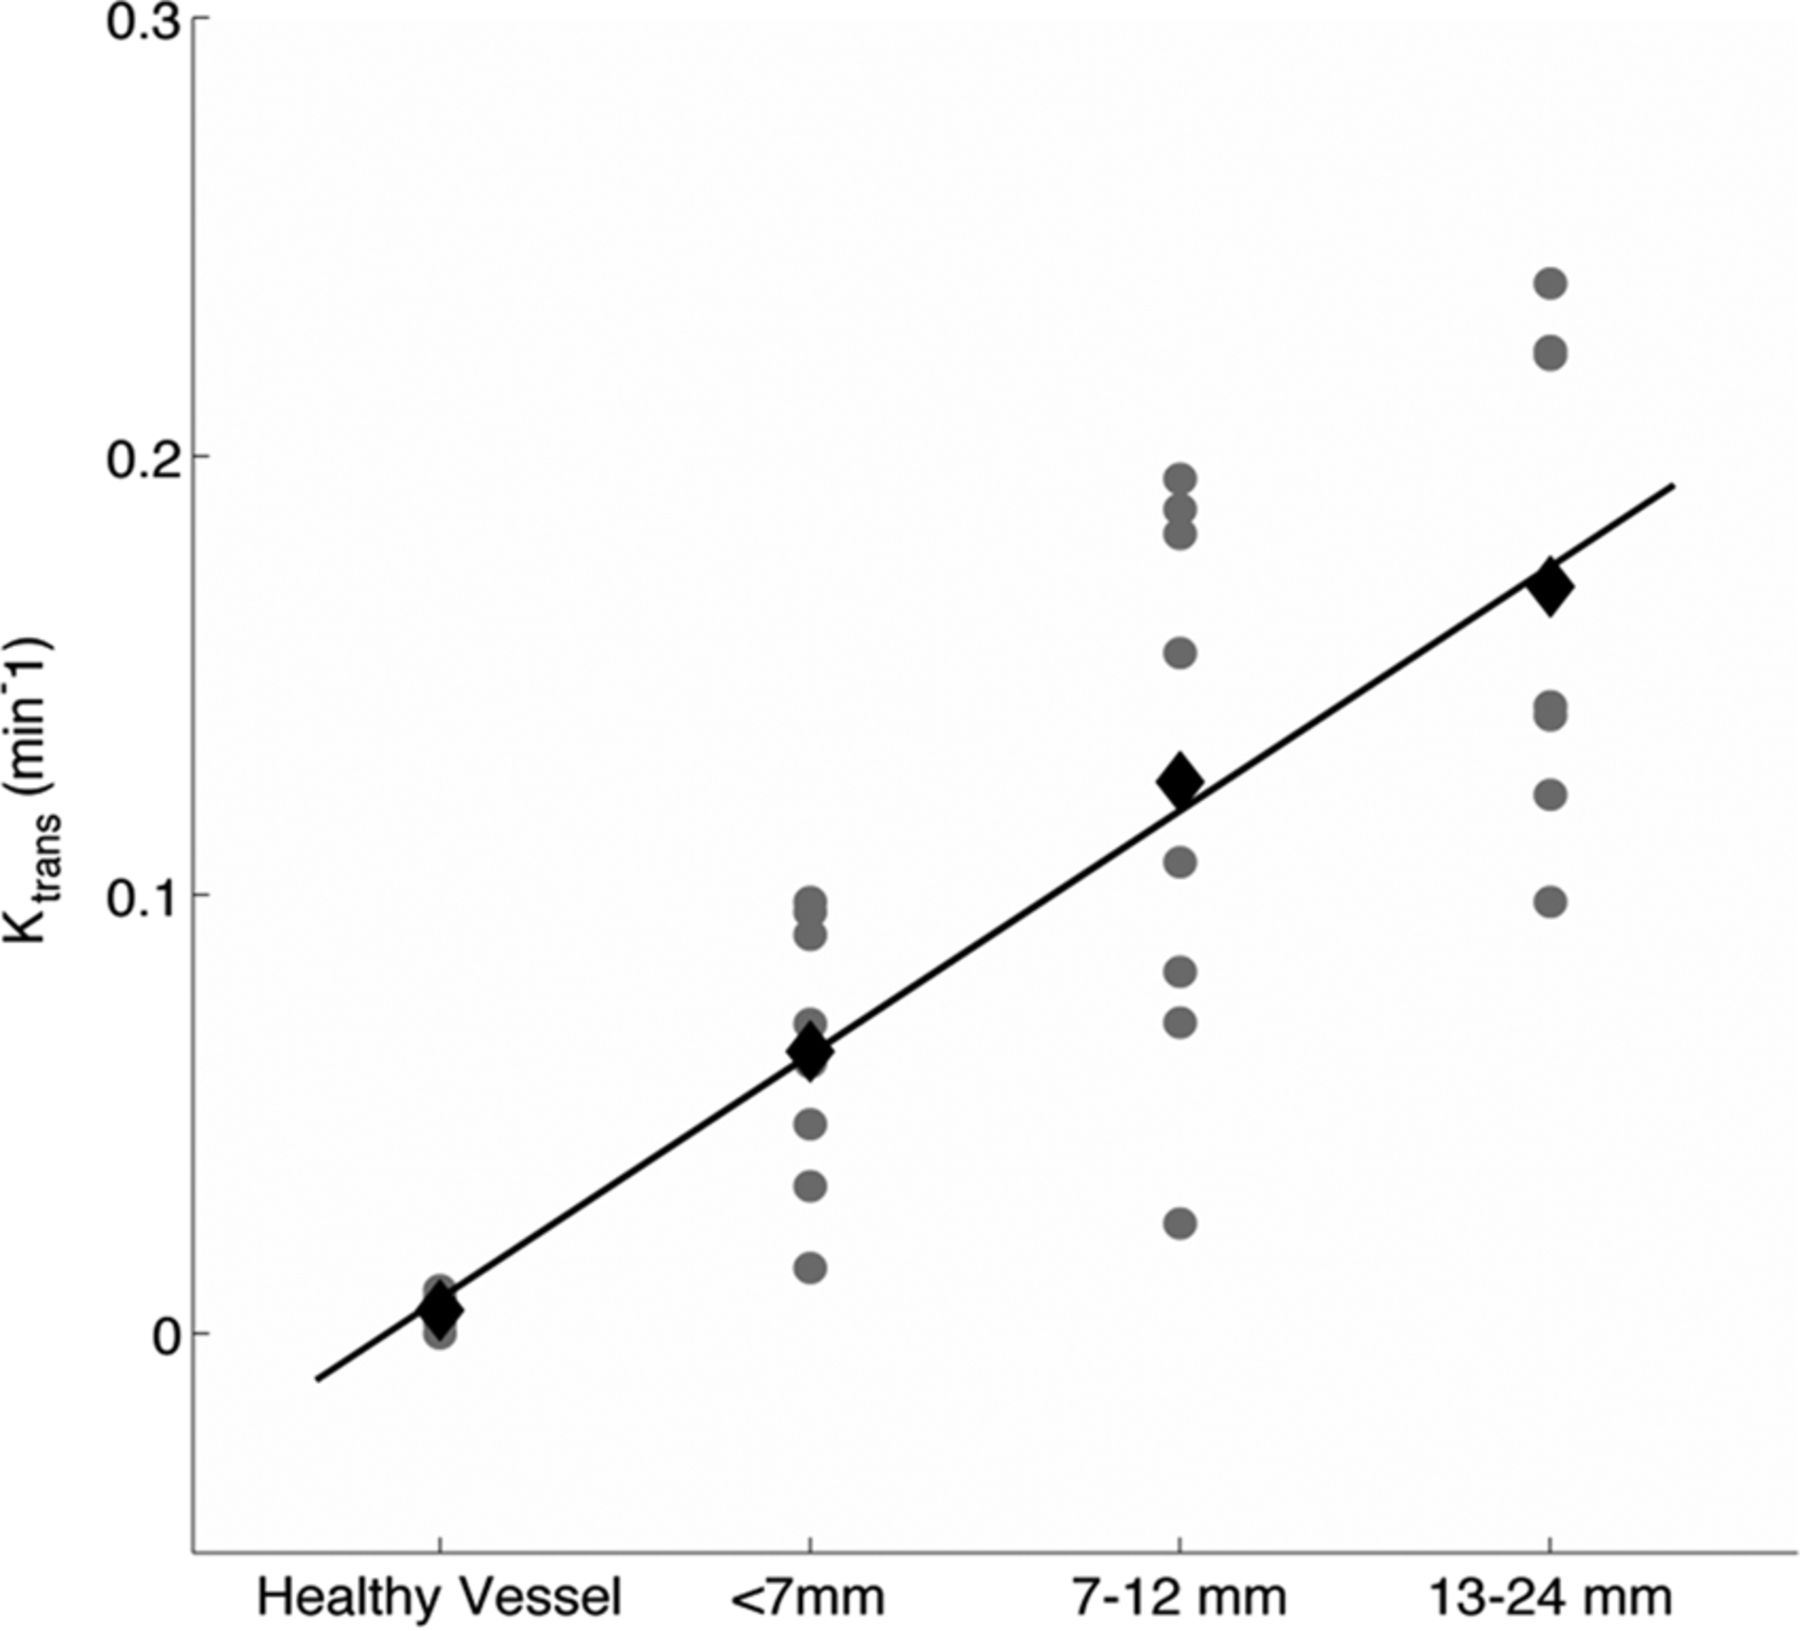
Linear regression analysis demonstrated that mean aneurysm Ktrans values increased linearly with successively larger aneurysm-size risk bins (<7, 7–12, 13–24 mm), defined by the ISUIA and shown in Fig 5. In this regression model, the coefficients increased linearly for successive size bins (0.075, 0.1205, and 0.1650; P < .0001; R2 = 0.74). A similar regression model with VL showed no significant increase between healthy vessels and the <7-mm group (coefficient = 0.059, P = .11), while the increase for the 7- to 12-mm and 13- to 24-mm groups was 0.1175 (P = .004) and 0.1958 (P < .001), respectively (R2 = 0.44). A simple linear regression model by using permeability parameters as a response and size of the IA as a predictor showed that for every millimeter increase in IA size, the average Ktrans increased by 0.005 minutes−1 with a standard error of 0.002 (P = .02). IA size and VL did not have a significant linear correlation (P = .16). IA neck diameter and aspect ratio did not have a significant correlation with Ktrans (P = .06 and P = .15, respectively) or VL (P = .37 and .30, respectively).

Mean Ktrans and VL values (black diamonds) increase linearly with larger ISUIA-determined size/risk bins (<7, 7–12, and 13–24 mm) as shown in the scatterplot. Note that our cohort did not contain aneurysms in the >25-mm size/risk bin. The gray circles represent individual IA permeability values. The black diamonds are the mean for each size bin.
The Table shows the results of univariate and multivariate logistic regression comparing ISUIA-identified clinical risk factors, aneurysm size, neck, aspect ratio, Ktrans, and VL in their ability to predict high-risk saccular IAs in groups A, B, and AB (A or B). Within group A, only size and Ktrans showed significant univariate relationships (P < .05). In all risk-assessment paradigms, Ktrans had the greatest effect in predicting risk. When risk was based on anatomic and imaging markers in group B, Ktrans was both statistically significant and more effective in predicting a high-risk saccular IA. Most important, when both groups A and B were combined, then a 0.1-minute−1 increase in Ktrans conferred a 74.3996 increase in the likelihood that the IA was either symptomatic or had high-risk imaging/anatomic features outlined above (P = .03), while size had a smaller and statistically insignificant effect (P = .40).
Results of univariate and multivariate logistic regression of demographic and imaging markers against size-independent risk paradigmsa
Discussion
We have demonstrated the feasibility of a new imaging marker for the evaluation of intracranial aneurysms. We found that Ktrans and VL are elevated from baseline across all aneurysms relative to normal-appearing arteries. Furthermore, Ktrans correlates positively with size, morphologic properties, and symptomology. Logistical regression analysis indicates that Ktrans may be an independent indicator of rupture risk.
Aneurysm size is one of the most fundamental indications of rupture risk, as found by the ISUIA2 and Unruptured Cerebral Aneurysm Study (UCAS).18 prospective studies, and is frequently used clinically to determine surgical-versus-medical management. Nevertheless, many studies have indicated that various factors independent of IA size are associated with progressing IA pathology and rupture, including other anatomic metrics (morphology, location, multiplicity, aspect ratios, and orientation of the parent artery), clinical risk factors (hypertension, smoking, alcohol/drug abuse, inherited connective tissue diseases), symptomatology, inflammation (matrix metalloproteinases, macrophage infiltration), and hemodynamic flow and stress properties.
In our study, we found that Ktrans was a strong, significant, and independent determinant of rupture risk based on anatomic and combined clinical/anatomic high-risk subgroups. Aneurysm size was only a statistically significant and independent predictor of rupture risk in the clinically symptomatic subgroup (group A), intuitively due to the effect of aneurysm size on mass effect, but not in the high-risk anatomic subgroup (group B). This difference may indicate that Ktrans provides clinically relevant information about IA vascular pathology related to high-risk morphologic features, location, and multiplicity (vascular wall predisposition to IA development/progression) that are independent of size. Whether these results independently confer an increased rupture risk or define progressive thinning of an aneurysm wall requires larger prospective patient studies and/or direct intraoperative observation with histologic samples from surgically harvested tissue.
DCE–MR imaging permeability parameters lack a recognized standard of reference; however, we were able to provide internal reference values. In fact, previous studies have paired lesion permeability parameters with a paired internal control such as healthy tissue or the choroid plexus. We followed a similar methodology in our study, and our results closely corroborate the values reported by other groups for permeability in healthy tissue (negligible or zero12⇓–14) and Ktrans values ranging from 0.2 to 0.5 minutes−1 in the choroid plexus.15
Relevance to Flow Modeling
Hemodynamic flow patterns play an important role in the formation, growth, and eventual rupture of aneurysms. As such, advanced imaging techniques such as 4D-flow12,19 and postprocessing algorithms in computational fluid dynamics20 are active areas of research. These studies have shown that local variations of hemodynamic stresses can induce vascular injury,21 causing inflammatory responses,22 which, in turn, can lead to internal elastic lamina and tunica thinning, macrophage infiltration,23,24 and extracellular matrix remodeling. The net effect is a modification in wall uniformity and thickness, which is readily visible intraoperatively,7 though not easily visualized noninvasively. We see DCE–MR imaging playing a role complementary to hemodynamic imaging in this regard. Several studies have already demonstrated that pathologic changes in cervical vessel walls and inflammatory factors correlate with changes in Ktrans. For example, Kerwin et al25 demonstrated that Ktrans, by using DCE–MR imaging, had a strong linear correlation with macrophage infiltration in carotid atherosclerotic plaques on histopathologic analysis. As such, DCE–MR imaging may provide important information about a significant component of aneurysm disease—structural and biologic changes in the wall.25 A future correlation of Ktrans IA wall permeability with computational fluid dynamics or 4D-flow MR imaging may assist in identifying focal aneurysm regions of high risk or stress.
Limitations
Several limitations were identified in this study. Data were collected from a single center, exposing us to biases in the patient population available at our institution. Furthermore, we were limited to a sample size of 27 aneurysms in this proof-of-principle pilot study. In future studies, we expect to follow untreated IAs for several years and compare DCE metrics of those that progress against those that remain stable. In the future, larger sample sizes must be followed for several years to determine whether contrast agent leakage can be used as an independent or adjunctive predictor of rupture risk.
Conclusions
In this pilot study, we report the first evidence of DCE–MR imaging–modeled contrast permeability in IAs. We modeled the rate of contrast agent permeability across the IA wall and found that it correlated significantly with size-based and size-independent anatomic/imaging features and clinical assessments of rupture risk. In addition, high-risk aneurysms had higher contrast permeability rates than lower risk aneurysms. More studies comparing Ktrans in aneurysms with other clinical and hemodynamic risk factors and histopathologic correlation will provide greater insight into the clinical interpretation of Ktrans and its reflection on aneurysm wall pathology.
Footnotes
Disclosures: Parmede Vakil—RELATED: Grant: National Institutes of Health.* Bernard Bendok—UNRELATED: Grants/Grants Pending: MicroVention,* Comments: support for clinical trial: New Generation Hydrogel Endovascular Aneurysm Treatment Trial. *Money paid to the institution.
This work was supported by the National Institutes of Health/National Heart, Lung, and Blood Institute R01 HL088437; National Institutes of Health/National Institute of Biomedical Imaging and Bioengineering T32 EB005170, and Radiological Society of North America RSD1207.
Indicates open access to non-subscribers at www.ajnr.org
REFERENCES
- Received July 23, 2014.
- Accepted after revision October 22, 2014.
- © 2015 by American Journal of Neuroradiology


Jump to section
Related Articles
Cited By...
- Temporal Changes on Postgadolinium MR Vessel Wall Imaging Captures Enhancement Kinetics of Intracranial Atherosclerotic Plaques and Aneurysms
- Quantitative analysis of unruptured intracranial aneurysm wall thickness and enhancement using 7T high resolution, black blood magnetic resonance imaging
- Vessel Wall Imaging of Unruptured Intracranial Aneurysms: Ready for Prime Time? Not so Fast!
- Complementary Roles of Dynamic Contrast-Enhanced MR Imaging and Postcontrast Vessel Wall Imaging in Detecting High-Risk Intracranial Aneurysms
- Wall enhancement ratio and partial wall enhancement on MRI associated with the rupture of intracranial aneurysms
- Quantifying Intracranial Plaque Permeability with Dynamic Contrast-Enhanced MRI: A Pilot Study