
Abstract
BACKGROUND AND PURPOSE: Cerebral blood volume, acquired with flat panel detector CT by injecting contrast medium into the ascending aorta, enabled real-time acquisition of brain functional information with remarkable reduction of contrast medium usage comparing to an intravenous injection approach. However, individual vasculature and flow variations cause inhomogeneous contrast medium distribution and unexpected asymmetric perfusion for certain patients even without cerebral circulatory disorders. This work aimed at testing the feasibility of using color-coded quantitative DSA to predict the reliability of flat panel detector CT–based CBV maps by injecting contrast medium into the ascending aorta by exploring the correlation between measurements of color-coded quantitative DSA and the symmetry of CBV maps.
MATERIALS AND METHODS: For 12 patients without perfusion-related cerebral abnormities, color-coded quantitative DSA at the aortic arch and flat panel detector CT–based CBV maps by injecting contrast medium into the ascending aorta were acquired. In color-coded quantitative DSA, ROIs were defined on the bilateral common carotid arteries. Time-density curves were extracted, and area under the curve values were calculated. To evaluate brain perfusion symmetry, we defined ROIs on the anterior and middle cerebral artery territories in CBV maps, and quantitative CBV values were extracted.
RESULTS: Eight patients demonstrated good perfusion symmetry with relative CBV of 0.96 ± 0.06, and their relative area under the curve was found to be 0.99 ± 0.02. For the other 4 patients, CBV from the left hemisphere was significantly lower than that from the right with relative CBV of 0.81 ± 0.09. This asymmetric perfusion was confirmed by the color-coded quantitative DSA with relative area under the curve values of 0.79 ± 0.03.
CONCLUSIONS: This preliminary study showed good correlation between relative area under the curve from color-coded quantitative DSA and relative CBV from CBV maps. Color-coded quantitative DSA potentially helped sort out patients whose vascular anatomy could support reliable CBV acquisitions of flat detector CT by injecting contrast medium into the ascending aorta.
ABBREVIATIONS:
- AUC
- area under the curve
- CCA
- common carotid artery
- CCQ-DSA
- color-coded quantitative DSA
- CM
- contrast medium
- FPCT
- flat panel detector CT
- IA-FPCT-CBV
- intra-ascending aorta CM injection to acquire FPCT CBV maps
- rAUC
- relative AUC
- rCBV
- relative CBV
- TDC
- time-density curve
Angiographic suites equipped with flat panel detector CT (FPCT) for clinical imaging practice have been increasingly accepted during neurointerventions. This technique offers significant advantages in patient management because the patient does not have to be transferred between different clinical units for diagnosis and treatment, improving clinical workflow and increasing patient safety.1⇓–3 Continuous development in imaging technology has led to significant improvement of image acquisition and postprocessing tools in FPCT. Recently, an important brain perfusion parameter, CBV (milliliter/1000 milliliter), can be acquired by using FPCT. It has been suggested that a color-coded CBV map, which displays hemodynamic information in the capillary level of the entire brain parenchyma, provides a measurement of regional CBV variations and information on suspected ischemia, which is of great value for patients with acute ischemic stroke.4,5 The CBV value measured with this technique has been validated in a number of clinical studies, proving that the CBV maps generated from FPCT correlated well with CT perfusion maps from multisection CT, which were regarded as ground truth.6⇓⇓–9 This technique offered the possibility of obtaining functional information and assessing the viability of the brain tissue during interventional procedures.10
Advancements in protocols of contrast medium (CM) injection and image acquisition have been further investigated to achieve an optimized whole-brain CBV map acquisition pipeline by using FPCT.11⇓⇓–14 A number of studies have demonstrated the feasibility of obtaining CBV maps via intravenous CM injection by using FPCT. However, with this injection protocol, the CM will be diluted during the transit, thus only a small portion of the injected CM contributed to the formation of CBV maps. In contrast, intra-arterial administration has become an attractive method to increase the CM delivery and efficiency and may provide a viable approach for reducing the amount of CM used during FPCT CBV imaging. The feasibility and clinical value of intra-ascending aorta CM injection to acquire FPCT CBV maps (IA-FPCT-CBV) have been tested and confirmed; this approach enabled remarkably reduced CM usage relative to the intravenous CM injection protocol (350 mg I/mL; total amount, 96 mL; 20% diluted versus 60–80 mL, nondiluted) by using FPCT. Moreover, the reliability of this intra-arterial injection approach has also been validated against conventional CT perfusion imaging with intravenous CM injection.15
However, nonuniform CM distribution could be observed for a number of patients even without cerebral circulatory disorders, causing unexpected asymmetric perfusion in 2 hemispheres, mainly in the territories of the anterior and middle cerebral arteries.15,16 A possible explanation for nonuniform distribution could be patients' individual vasculature variations at the aortic arch, high blood flow speed, and the limited length of the ascending aorta.
Currently, color-coded quantitative digital subtraction angiography (CCQ-DSA) could be generated from a conventional DSA sequence at no additional radiation exposure or CM use, which enhanced the recognition of hemodynamic and morphologic findings. This technique provides a means to display temporal information of contrasted blood flow and attenuation for the duration of the DSA acquisition in a single color-coded image. Moreover, this image allowed the creation of a time-density curve (TDC) of a CM bolus in user-defined regions, from which quantitative blood flow information could be also extracted.17⇓–19
This work aimed at exploring the correlation between measurement of CCQ-DSA on the main feeding arteries and symmetry of CBV maps and testing the feasibility of using CCQ-DSA to predict the reliability of IA-FPCT-CBV on a patient-specific basis before the acquisition.
Materials and Methods
Patient Selection
From January 2013 to November 2013, CCQ-DSA at the aortic arch and IA-FPCT-CBV were acquired for 12 patients (8 men, 4 women; mean age, 49.3 ± 9.4 years) without perfusion-related cerebral abnormities. Detailed diagnostic and treatment information of each patient is listed in Table 1. This study was approved by the hospital ethics committee.
Patient diagnostic and treatment information
CCQ-DSA and CBV Map Generation
All patients received intravenous sedation and local anesthesia. The Seldinger technique was used to place a 5F sheath into the right femoral artery, and a 5F pigtail catheter was inserted and located at the ascending aorta. A routine conventional DSA sequence (7.5 frames/s) at the aortic arch was then acquired by using a rotational FPCT system (Artis zeego; Siemens, Erlangen, Germany). Thirty milliliters of nondiluted CM (350 mg I/mL) was injected by a power injector (600 psi, Avidia; Imaxeon, Silverwater, New South Wales, Australia) through the pigtail catheter at an injection rate of 15 mL/s. With a commercially available postprocessing software (syngo iFlow; Siemens), this DSA sequence was converted to a CCQ-DSA image, which quantitatively showed the blood flow dynamics.
In addition, a CBV map was acquired by using the same FPCT system. Twenty milliliters of CM diluted by 76 mL of saline to a total volume of 96 mL was injected with a rate of 6 mL/s during 16 seconds. The generation of the CBV map consisted of two 3D image-acquisition steps, including a mask run followed by a fill run. To ensure maximum brain tissue and intravascular contrast enhancement, we started the fill run with an 8-second x-ray delay. During the 3D image acquisition, the C-arm rotated for 200° in 8 seconds, with an angle increment of 0.5°. A total of 397 projection images were generated with an x-ray dose of 0.36 μGy/frame. The reconstruction was performed by using commercially available software (syngo DynaPBV Neuro; Siemens). The fully automatic reconstruction algorithm has been extensively described in detail in another work.20
Quantitative Evaluation
The CCQ-DSA and CBV imaging results were quantitatively reviewed by 2 experienced neuroradiologists, respectively.
On the basis of the DSA sequence (Fig 1A), rectangular ROIs were defined on symmetric bilateral common carotid arteries (CCAs) on the generated CCQ-DSA image. The ROIs were placed approximately 8–10 cm away from the aortic arch, with their sizes approximately 0.02 cm2. This selected ROI area could completely cover the artery cross-sections in the radial direction for a short distance, thus having minimal influence from superimposing vessels (Fig 1B). The corresponding TDCs, determined by the number and intensity of colored pixels inside the ROI, were extracted (Fig 1C). The area under curve (AUC) could be calculated from the TDC, indicating the amount of contrasted blood flowing through the selected ROI during the image acquisition. The AUC of the TDC on the right CCA was regarded as the baseline and was set as reference value 1, and the AUC of the TDC on the left CCA was calculated relative to it. Next, the ratio between the AUC extracted from 2 CCAs, called relative AUC (rAUC), was then obtained by
 where AUC_left CCA and AUC_right CCA were the areas calculated under the TDC profile from the ROI on the left and the right CCA, respectively.

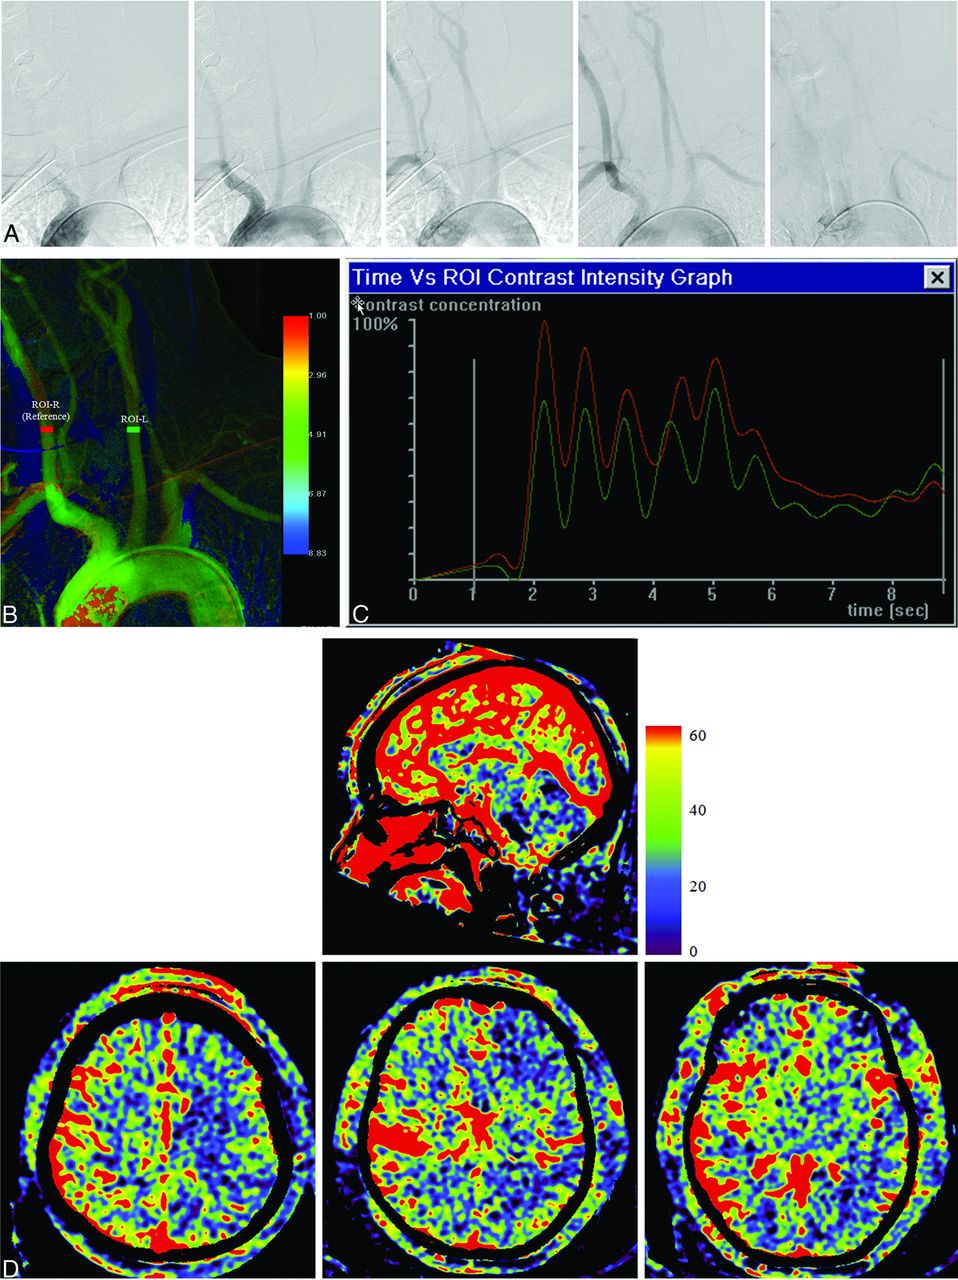
As an example, in patient 5, a conventional DSA sequence at 5 time instances shows the course of CM passing through the aortic arch and its major branching arteries (A). In the generated CCQ-DSA image, ROIs are defined on bilateral CCAs as red (ROI-R) and green (ROI-L) rectangles (B). Corresponding TDCs were extracted from the defined ROI, showing good correlation between the 2 curves (C). On the CBV maps (D), 3 planes were selected (upper panel). The lower panel corresponded to the above planes (left, plane 1; middle, plane 2; right, plane 3), with ROIs defined in pairs (ROI-R on the right hemisphere and ROI-L on the left hemisphere) on each plane covering characteristic anatomic structures to examine rCBV on 2 hemispheres: the frontal and parietal lobes in plane 1; frontal lobe and basal ganglia region in plane 2; and temporal lobe in plane 3.
To evaluate the symmetry of brain perfusion, we selected 3 anatomically characteristic planes crossing the frontal, parietal, and temporal lobes and basal ganglia regions. Circular ROIs with an area of approximately 3.0 cm2 were manually defined on axial planes to cover the anterior and middle cerebral artery territories of both hemispheres, with major vessels excluded (Fig 1D). A spatially averaged CBV value in the ROI was extracted, and relative CBV (rCBV) values were then calculated by
 where CBV_left hemisphere and CBV_right hemisphere were the mean CBV values extracted from the ROIs on the left and the right hemispheres, respectively. Thus, perfusion symmetry (1.0 for perfect symmetry) in different anatomic regions could be quantitatively examined.
Results
IA-FPCT-CBV was technically successful, and all the resulting image quality was adequate for evaluation. No adverse physiologic changes caused by CBV map acquisitions were detected for any patient. From the CCQ-DSA images, AUC values for bilateral CCA were extracted from the TDC and are summarized in Table 2. Quantitative CBV evaluation results are listed in Table 3.
From the CCQ-DSA images, AUC values calculated for TDCs extracted from ROIs on bilateral CCAs and the AUC ratio between left and right sides
Quantitative CBV measurement and perfusion symmetry of patients
For patients 1–7 and 12, CCQ-DSA evaluation showed rAUC values of 0.99 ± 0.02. From CBV maps, rCBV was found to be 0.96 ± 0.06. An exemplary case (patient 5) was shown in Fig 1. There was good correlation between the profiles of the TDC extracted from the 2 ROIs, including the wash-in, wash-out phase; pulsatile flow pattern; peak intensity; and duration of contrast enhancement. On the generated CBV maps, correspondence on the perfusion level on 2 hemispheres was visually evident. Quantitative CBV evaluation was performed in 3 planes in the ROIs defined at the frontal, parietal, and temporal lobes and basal ganglia; this evaluation also showed excellent perfusion symmetry for each pair of ROIs.
In 4 patients (patients 8–11), inhomogeneous CM distribution on bilateral CCAs, with an rAUC value of 0.79 ± 0.03 could be observed. Table 3 shows that CBV from the left hemisphere was significantly lower than that from the right hemisphere in certain regions for these patients with an rCBV of 0.81 ± 0.09. Imaging results of patient 11 are shown as an exemplary case (Fig 2). Differences could be easily detected for TDC comparison. Although the shape of 2 TDCs remained similar, the magnitude was much lower for the curve from the left CCA, resulting in an AUC deviation of 24%. Large CBV variations in multiple regions on 2 hemispheres could be also detected by visual inspection on the CBV map. The CBV value in the left hemisphere was significantly lower than that from the right hemisphere with the maximum CBV deviation close to 30%. Specifically, a low perfusion level was mainly detected in plane 1 in the parietal lobe (ROI2), in plane 2 in both the frontal lobe (ROI1) and basal ganglia region (ROI2), and in plane 3 in the temporal lobe (ROI1).

As an example, in patient 11, conventional DSA sequence at 5 time instances shows the course of CM passing through the aortic arch and its major branching arteries (A). In the generated CCQ-DSA image, ROIs were defined on bilateral CCAs (B). Corresponding TDCs were extracted from the defined ROIs, showing large deviations in magnitude between the 2 curves (C). CBV maps evidently show low perfusion levels in plane 1 (lower panel, left) in the parietal lobe, in plane 2 (lower panel, middle) in both the frontal lobe and basal ganglia region, and in plane 3 (lower panel, right) in the temporal lobe (D).
Asymmetric perfusion between 2 hemispheres may only appear in some regions. For each patient, the rCBV with the largest deviation from the perfect symmetry through all the examined regions was used and scatterplots were created against the rAUC. In Fig 3, the relationships between rAUC and rCBV were quantified by linear logistic regression. There was no point lying far from the cluster of data points or far from the regression line, and the high correlation (R2 = 0.9188) indicated an approximate linear relationship between rAUC and rCBV.

Linear regression analysis shows that rAUC and rCBV with the most asymmetry have approximately a linear relationship.
Discussion
It has been previously confirmed that CBV maps acquired with FPCT could obtain functional information of the entire brain immediately in the angiographic suite for patients undergoing diagnostic angiography or endovascular treatment. Compared with CT- and FPCT-based perfusion imaging by using an intravenous injection protocol, the IA-FPCT-CBV technique not only enabled real-time monitoring of the brain function, assessments of perfusion parameters during an intervention, and direct evaluation of the treatment outcome but also achieved significant reduction of CM dose, thus potentially minimizing the CM-induced side effects.
The major challenge of this intra-arterial injection protocol was the unexpected asymmetry of perfusion for certain patients between the left/right hemispheres shown on the generated CBV map, which may be caused by nonuniform CM distribution. In fact, for those patients who showed perfusion asymmetry, it could sometimes be observed that a slightly larger portion of CM from the catheter tip flowed through the ostium of the brachiocephalic trunk and then fed into the right CCA and thus the right hemisphere.
Due to the high complexity of the blood flow and CM distributions during transit, it is challenging for the clinicians to visually detect and analyze parameters such as AUC on a conventional monochromatic DSA sequence; this challenge may be an important indicator for physiologic variations. The use of CCQ-DSA with parametric color-coding not only allowed easier visual evaluation but also enabled quantification and estimation of the blood supply to the brain.
In our study, the feasibility of determining CBV symmetry before the acquisition on the basis of CCQ-DSA assessment was investigated. With CCQ-DSA, measurement of the AUC of the TDC in ROIs placed on symmetric CCAs was immediate and quantitative. The CCQ-DSA was generated from the routinely acquired DSA sequence on the aortic arch; thus, no additional CM and x-ray dose was needed. The presented results showed that on the CBV maps, there were no significant differences in CBV values from characteristic regions on the left and right hemispheres for 8 patients. For the other 4 patients, the CBV value was higher on the right hemisphere in ≥1 examined region. The same tendency was observed in the AUC measurements of the TDC extracted from bilateral CCAs. We have shown that there is an almost linear relationship between rAUC and rCBV with the most asymmetry, proving that for a specific patient, the use of CCQ-DSA was feasible for predicting whether a reliable IA-FPCT-CBV map could be generated that correctly reflected the perfusion level without inherent bias induced by an intra-arterial injection protocol.
Therefore, the combination of CCQ-DSA could help to sort out patients who are/are not suitable for undergoing IA-FPCT-CBV acquisitions. For those patients who have shown a large discrepancy of AUC values on the bilateral CCAs, an intravenous injection protocol is suggested, or other advanced intra-arterial injection protocols enabling uniform CM distribution need to be further investigated and developed.
The restrictions and limitations of this study should be also mentioned. First, a complete bolus transport consisting of wash-in and wash-out through defined ROIs on CCAs should be included during image acquisition to ensure a correct AUC calculation and comparison. Therefore, the DSA acquisition time has to be long enough, typically 8–10 seconds. Besides, due to the high flow rate in the CCA, the DSA acquisition frame rate of >7.5 frames/s is suggested to make sure that major flow characteristics are well-captured. Second, the CCQ-DSA image is based on the subtraction of a sequence of angiographic images; thus, any patient motion will cause degradation of image quality and subsequent inaccuracies in the quantification results. Therefore, the patient must be well-stabilized to minimize motion-induced artifacts during image acquisition. Third, the catheter position should be carefully controlled with the tip close to the aortic valve. Otherwise, different CM transport distances may bring deviations across patients. Fourth, current available technology of angiographic systems allows only CBV measurement. However, it has been previously demonstrated that cerebral blood flow and cerebral perfusion reserve have also been valuable parameters for achieving comprehensive evaluation on the brain functional changes. Fifth, the number of patients recruited into this study is small; hence, the feasibility of this method was only demonstrated preliminarily.
Conclusions
IA-FPCT-CBV map acquisition could allow whole-brain perfusion imaging directly in the angiographic suite, but with significantly less CM compared with an intravenous-injection protocol. This preliminary study showed good correlation between the AUC of the TDC at the CCA from CCQ-DSA images and measurements on CBV maps. CCQ-DSA evaluation may be applied before the CBV acquisition in clinics, to help decide whether patients are suitable for undergoing IA-FPCT-CBV acquisitions.
Footnotes
Disclosures: Qi Sun—OTHER RELATIONSHIPS: employee of Siemens, China. Yu Deuerling-Zheng—OTHER RELATIONSHIPS: employee of Siemens. Markus Kowarschik—OTHER RELATIONSHIPS: employee of Siemens. Janina Beilner—OTHER RELATIONSHIPS: employee of Siemens, China.
REFERENCES
- Received July 21, 2014.
- Accepted after revision October 21, 2014.
- © 2015 by American Journal of Neuroradiology


