
Article Figures & Data
Figures
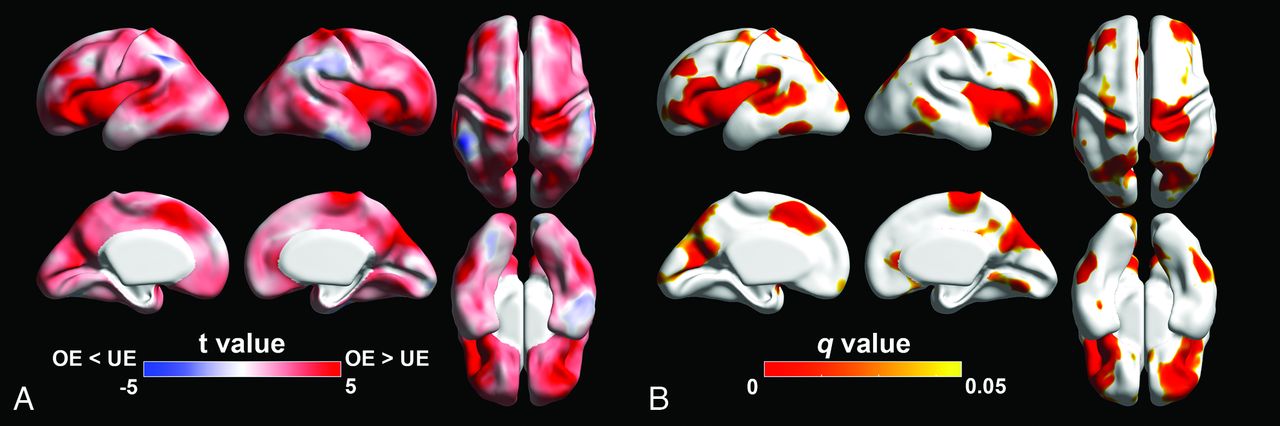
- FIG 1.
Statistical results of the regional analysis of surface area between OE and UE fetuses. A, Statistical t-map. Red indicates that surface area in OE is smaller than UE fetuses. Blue indicates that surface area in OE is larger than UE fetuses. B, FDR q-map. Red-yellow indicates regions showing statistically different surface area (q < 0.05).
- FIG 2.
Statistical results of the regional analysis of sulcal depth between OE and UE. A, Statistical t-map. Red indicates that sulcal depth in OE is shallower than UE fetuses. Blue surface area in OE is deeper than UE fetuses. B, FDR q-map. Red-yellow indicates regions showing statistically different sulcal depth (q < 0.05).


Tables
OE Fetuses (n = 14) UE Control Fetuses (n= 15) P Value Maternal age (yr) 28.5 ± 5.3 28.6 ± 6.5 .93 Gestational age (wk) 31.43 ± 2.34 31.39 ± 2.35 .96 Sex (% male) 62% (9/14) 67% (10/15) .9 Nicotine exposure 50% (7/14) 6.7% (1/15) <.01 Other illicit drug exposurea 50% (7/14) 6.7% (1/15) <.01 Site (A/C/N)b 4/7/3 5/8/2 NA a Illicit drug exposure inquiries included: marijuana, cocaine, amphetamine or methamphetamine, barbiturates, and benzodiazepines.
b A: University of Arkansas for Medical Sciences; C: Cincinnati Children’s Hospital Medical Center; N: University of North Carolina at Chapel Hill.
- Table 2:
Statistical comparisons of whole brain volume and surface measures between OE and UE control fetuses
Measures UE (mean ± SD) OE (mean ± SD) t P Value Cohen d Effect Size Brain volume (mm3) 196,083 ± 46,338 180,496 ± 41,002 5.22 <.001 0.3555 CP volume (mm3) 62,081 ± 20,426 56,797 ± 16,756 4.24 <.001 0.2818 Surface area (mm2) 306,930 ± 8147 27,313 ± 7255 5.25 <.001 0.4373 Sulcal depth (mm) 2.152 ± 0.571 1.893 ± 0.517 4.96 <.001 0.4739 Mean curvature 0.145 ± 0.031 0.135 ± 0.031 4.83 <.001 0.3120 GI 1.404 ± 0.160 1.331 ± 0.145 4.41 <.001 0.4801 Note:— Positive t: UE > OE.


Jump to section
Related Articles
Cited By...
- No citing articles found.