
Article Figures & Data
Figures
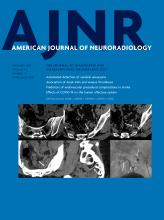
- FIG 1.
Left S2 CVF in patient 1. A–C, Axial images from a flat left-side-down CTM after DSM show a CVF (arrows) that arises from a left S2 nerve sheath diverticulum that empties into the left internal iliac vein. These images were reconstructed into 0.625-mm-thick slices from the 50-keV monoenergetic reconstructions from DECT. D and E, Multiplanar reformatted images from the CTM highlight the CVF (arrows). F, Postprocedural frontal projection image from transvenous catheter Onyx (Covidien) embolization of the CVF. The left S2 vein (double-line arrow), left S3 vein (broken arrow), and the pelvic epidural venous plexus (solid arrow) are opacified.
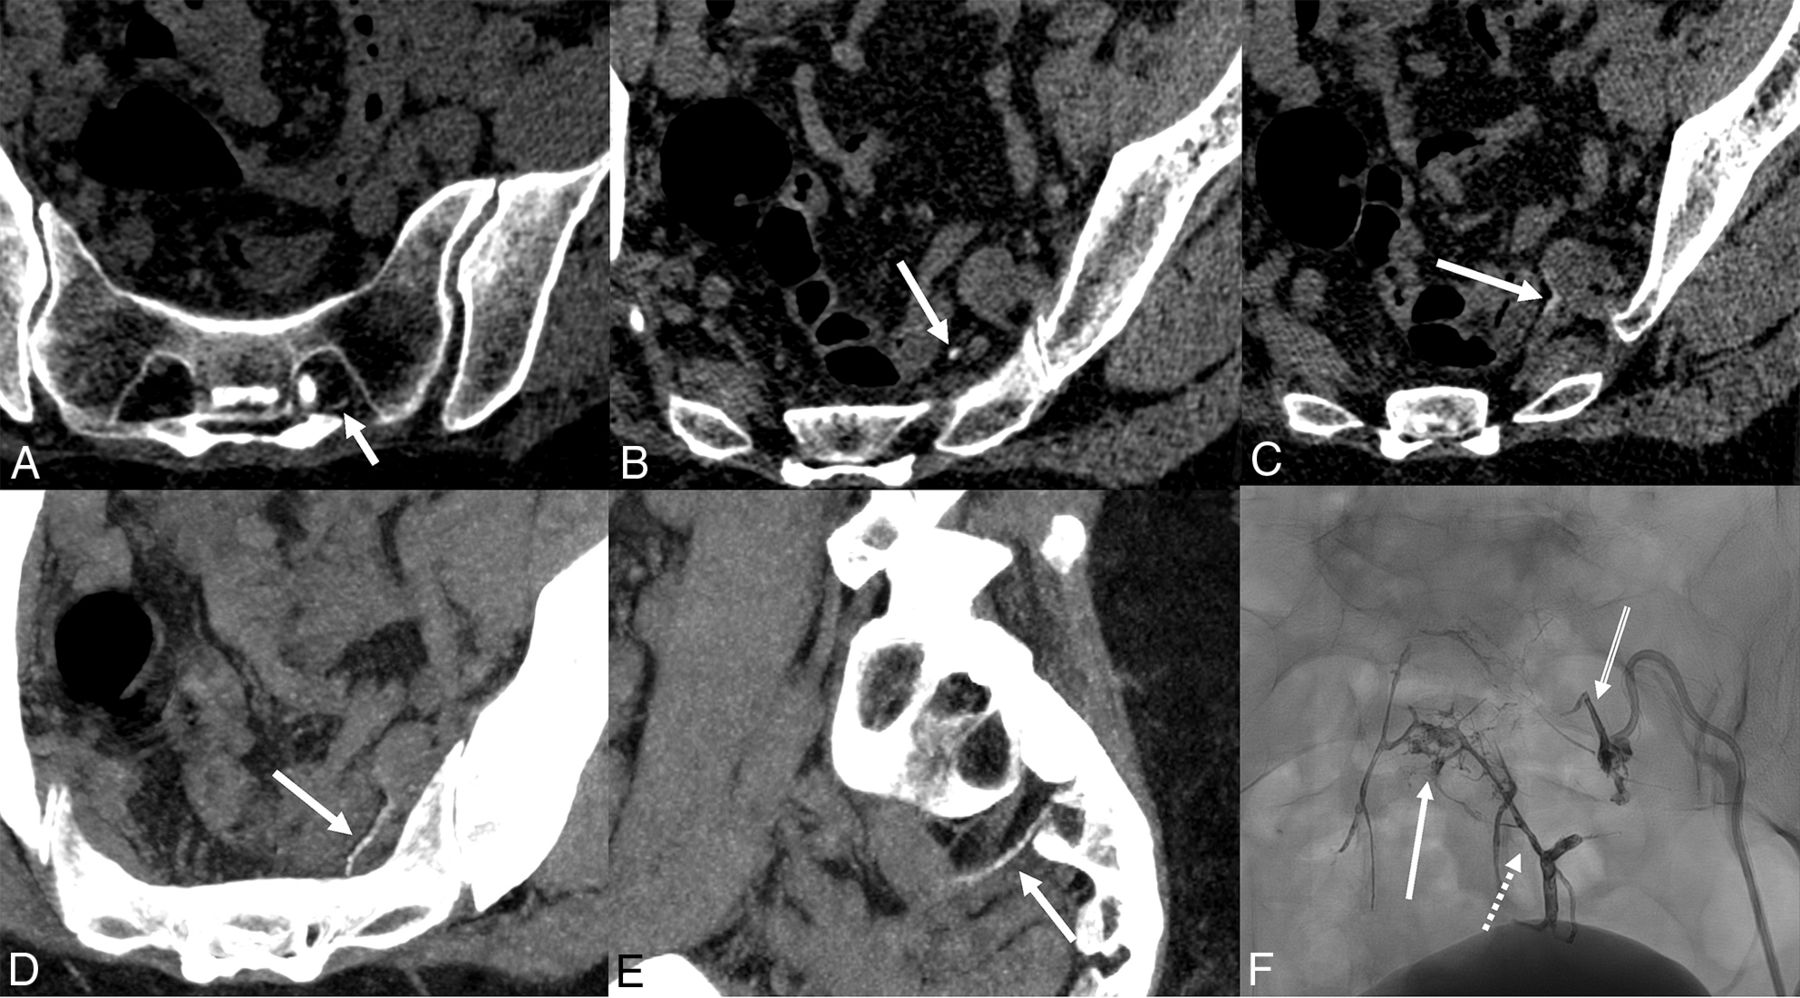
- FIG 2.
Right S3 CVF in patient 2. A and B, Axial images from a flat right-side-down CTM after DSM follow a CVF (arrows) that arises from a right S3 nerve sheath diverticulum and empties into the right internal iliac vein. These images were reconstructed into 0.625-mm-thick slices from the monoenergetic reconstructions from DECT. C, Reformatted image from the same examination better demonstrates the entire CVF (arrow). D, Right-side-down DSM frontal image with the patient in reverse Trendelenburg position shows the CVF (arrow).


