
Abstract
BACKGROUND AND PURPOSE: Quantitative metrics of the dural sac such as the cross-sectional area are commonly used to evaluate central canal stenosis. The aim of this study was to analyze 2 new metrics to measure spinal stenosis on the basis of the ratio between the dural sac and disc cross-sectional areas (DDRCA) and the dural sac and disc anterior-posterior diameters (DDRDIA) and compare them with established quantitative metrics of the dural sac.
MATERIALS AND METHODS: T2-weighted axial MR images (n = 260 patients) were retrospectively evaluated, graded for central canal stenosis as normal (no stenosis), mild, moderate, or severe from L1/L2 through L5/S1 with 1 grade per spinal level and annotated to measure the DDRCA and DDRDIA. Thresholds were obtained using a decision tree classifier on a subset of patients (n = 130) and evaluated on the remaining patients (n = 130) for accuracy and consistency across demographics, anatomic variation, and clinical outcomes.
RESULTS: DDRCA and DDRDIA had areas under the receiver operating characteristic curve of 98.6 (97.4–99.3) and 98.0 (96.7–98.9) compared with dural sac cross-sectional area at 96.5 (95.0–97.7) for binary classification. DDRDIA and DDRCA had κ scores of 0.75 (0.71–0.79) and 0.80 (0.75–0.83) compared with dural sac cross-sectional area at 0.62 (0.57–0.66) for multigrade classification. No significant differences (P > .1) in the area under the receiver operating characteristic curve were observed for the DDRDIA across variations in the body mass index. The DDRDIA also had the highest area under the receiver operating characteristic curve among symptomatic patients (visual analog scale ≥ 7) or patients who underwent surgery.
CONCLUSIONS: Ratio-based metrics (DDRDIA and DDRCA) are accurate and robust to anatomic and demographic variability compared with quantitative metrics of the dural sac and better correlated with symptomatology and surgical outcomes.
ABBREVIATIONS:
- AUROC
- area under the receiver operating characteristic curve
- BMI
- body mass index
- DDRCA
- ratio between dural sac and disc cross-sectional areas
- DDRDIA
- ratio between dural sac and disc anterior-posterior diameters
- DSCA
- dural sac cross-sectional area
- DSDIA
- dural sac anterior-posterior diameter
- LSS
- lumbar spinal stenosis
- VAS
- visual analog scale
Lumbar spinal stenosis (LSS) is one of the most common causes for lumbar spinal surgery in patients older than 65 years of age.1 The etiology is multifactorial but predominantly attributed to degenerative changes. Degenerative canal narrowing can be secondary to changes that include disc protrusion, extrusion; ligamentum flavum hypertrophy; or facet joint arthropathy.2 Historically, radiographic LSS has been described using morphologic categories ranging from any narrowing of the spinal canal3 to more detailed descriptors evaluating CSF space obliteration and neural element separation;4 nevertheless, classification of LSS is highly variable, with a number of grading systems, none of which are widely accepted.5
Accurate classification of LSS, however, is essential for subsequent patient management.6 Clinical symptoms and examination and radiologic findings are all integral and contribute to the diagnosis of symptomatic LSS. There are no physical examination findings or clinical history that is both highly sensitive and specific for diagnosing LSS;7 imaging can, therefore, confirm the structural diagnosis and clarify the anatomy if therapeutic management such as injections or surgery is contemplated. When imaging is indicated, MR imaging is widely accepted as the preferred technique owing to its superior soft-tissue contrast8,9 and various qualitative, morphologic features; quantitative metrics have been proposed for LSS on MR imaging.4,10,11
To optimize the effects of variability, poor agreement, and suboptimal outcomes associated with qualitative features,12 articles in the literature have proposed quantitative measures for diagnosing and grading LSS.13,14 The anterior-posterior diameter of the dural sac (DSDIA) and the dural sac cross-sectional area (DSCA) have been evaluated extensively in prior studies with limited success in establishing clinical utility;15-19 moreover, various thresholds have been proposed for each measure.14,20 A DSCA of <100 mm2 at more than 2 of 3 intervertebral levels (L2/L3, L3/L4, L4/L5) was shown to be highly associated with the presence of intermittent claudication;17 and pronounced stenosis of the canal (DSDIA of <6 mm on myelography) predicted less postoperative pain in a 5-year follow-up study.21 The increasing number of quantitative measures and potential correlations with outcomes can lead to confusion in the clinical routine because even specialized radiologists apply each measure differently22-24 according to the results of a recent Delphi survey.25
Furthermore, a weakness of commonly used nonratio metrics such as DSCA and DSDIA is that they are not anatomically normalized and incorporate only the absolute distance or area, possibly explaining the high variability and susceptibility to demographic changes.
Given the wide variability of the quantitative measurements and correlation with symptoms and outcomes, a reproducible quantitative grading system for LSS is essential for subsequent management. In this study, we propose to calculate ratios measured at the disc level, the most stenotic level, relative to the dural sac: the dural sac-to-disc ratio of the respective anterior-posterior diameters (DDRDIA) and the dural sac-to-disc ratio of the respective cross-sectional areas (DDRCA) as normalized quantitative metrics for classifying stenosis. We hypothesize that these ratios incorporating the disc level may be better correlated with symptomatology and surgical outcomes compared with quantitative metrics of the dural sac.
MATERIALS AND METHODS
Study Design
In this institutional review board–approved retrospective cross-sectional study, lumbar spine MRIs along with clinical data were evaluated to assess our proposed quantitative metrics, DDRDIA and DDRCA, for grading LSS and comparing it with other more commonly used nonratio metrics such as the DSCA (standard of reference) as well as DSDIA.
Patient Cohort
Patients who underwent lumbar spine MR imaging for clinical indications between 2008 and 2019 were included after applying the following exclusion criteria: Those with age younger than 19 years, transitional anatomy, fractures, postoperative changes, extensive hardware, infection, primary tumors, and widespread metastatic disease to the spine were excluded. Studies with the absence of a T2-weighted axial sequence or poor image quality were also excluded. A total of 30,619 patients were identified, of whom a subset of patients (n = 260) were selected at random, with uniform sampling to be included in the study.
Clinical Data
We collected the following clinical data: presenting symptoms, low back pain, and the radicular pain score on a visual analog scale (VAS),26 ranging from 0 to 10; demographics including age, sex, and body mass index (BMI) from the electronic health record; as well as clinical management spanning noninvasive treatment to surgical procedures.
Image Acquisition
All T2-weighted axial MRIs used in this study were FSE sequences acquired in our institution as part of routine clinical lumbar spine MR imaging studies using a 3T MR imaging scanner (Discovery MR750; GE Healthcare) with a section thickness of 4.0 mm, section spacing of 1.0 mm, FOV of 18.0 cm, TE of 85.0 ms, TR of 4202.0 ms, flip angle of 115°, and a matrix of 512 × 512 pixels. Axial sequences were acquired in the contiguous axial plane as per the imaging protocols at our institution, with no disc-specific adjustments such as disc space–targeted angled axial images.
Grading LSS
A board-certified neuroradiologist (R1) with 25 years of experience qualitatively graded MRIs from the study cohort (n = 260) for central canal stenosis as normal (absence of stenosis), mild, moderate, or severe with 1 grade per spinal level (L1/L2, L2/L3, L3/L4, L4/L5, L5/S1). Grading was based on a published qualitative grading system (Schizas system) as follows:11 Normal indicated absence of LSS based on qualitative criteria on MR imaging: homogeneous distribution of the CSF and individual rootlets visualized in the dorsal aspect of the dural sac; mild, some CSF present and the rootlets still individualized; moderate, the rootlets occupying the entire dural sac with minimal-to-no CSF, epidural fat visualized dorsally; and severe, thecal sac obliterated and no epidural fat, CSF, or individual rootlets visualized.
Quantitative Metrics
This study evaluates the proposed metrics: DDRDIA, which measures the ratio between the anterior-posterior diameters of the dural sac and intervertebral disc, and DDRCA, which measures the ratio between the cross-section areas of the dural sac and intervertebral disc as well as standard metrics such as DSCA and DSDIA. Using a research annotation platform (MD.ai; md.ai/), a trained researcher and a radiology trainee (R2) annotated the T2-weighted axial slices with free-form masks of the dural sac and intervertebral disc, as well as lines for measuring their respective anterior-posterior diameters from which the metrics were computed, as shown in Fig 1. Figure 2 provides examples of normal (no stenosis), mild, moderate, and severe stenosis with metric values.

Sample T2-weighted axial section at L2/L3 graded normal with the following: A, Free-form annotation around the DSCA of 166 mm2. B, Line annotation with a DSDIA of 14 mm. C, Line annotations with a DDRDIA of 0.4. D, Free-form annotations with DDRCA of 0.41. The square root is used as a normalization step to account for the quadraticity of area measures.

Sample T2-weighted axial MR imaging slices of the lumbar spine for each stenosis grade, determined qualitatively by a neuroradiologist, with the metrics annotated. A, Grade: normal; level, L1/L2; DSCA, 167 mm2; DSDIA, 15 mm; DDRDIA, 0.42; DDRCA, 0.40. B, Grade: mild; level, L3/L4; DSCA, 104 mm2; DSDIA, 10 mm; DDRDIA, 0.24; DDRCA, 0.27. C, Grade: moderate; level L4/L5; DSCA, 115 mm2; DSDIA, 10 mm; DDRDIA, 0.22; DDRCA, 0.24. D, Grade: severe; level, L2/L3; DSCA, 64 mm2; DSDIA, 7 mm; DDRDIA, 0.14; DDRCA, 0.16.
Cutoff Thresholds for Grading Stenosis
The study cohort (n = 260) was partitioned randomly into 2 distinct groups: 1) a development cohort (n = 130), used to determine thresholds for DDRDIA, DDRCA, DSDIA, and DSCA (standard of reference); and 2) an evaluation cohort (n = 130) on which all metrics were evaluated.
For each metric, a decision tree classifier was fit on the development cohort (n = 130) using R1’s grades as ground truth to determine cutoff thresholds for classifying a given T2-weighted axial section as having normal (no stenosis), mild, moderate, or severe stenosis. The decision tree is a statistical modelling technique that automatically creates branches of decisions based on each measurement and its corresponding ground truth grade so that the total classification error is minimized.27 Decision trees have been previously used to obtain thresholds for LSS and offer the advantage of clinically interpretable rules.28 The Scikit-learn Python library, Version 0.24.2 DecisionTreeClassifier module (https://scikit-learn.org/stable/index.html) was used with the max_depth parameter set to 3 and max_leaves set to 4 to avoid overfitting.29
Statistical Analysis
All analyses were performed on the evaluation cohort (n = 130). Statistical power analysis for pair-wise comparison of the quantitative metrics with an assumed effect size of 0.55, α of .05, β of 0.2, and power of 80% resulted in a minimum sample size of 120. The SciPy Version 1.6.0 Python library and its stats module were used for all statistical analyses reported in this article.30
Association with Stenosis.
The decision tree classifiers fit on the development cohort (n = 130) were used to classify 1 section from each disc level of the evaluation cohort (n = 130) as normal, mild, moderate, or severe. Association with stenosis for each metric was characterized for both binarized grading of stenosis (normal/mild versus moderate/severe) and multigrade classification.
Binary classification was evaluated using the area under the receiver operation characteristic curve (AUROC). Statistical significance of pair-wise differences in the AUROC corresponding to each quantitative metric was characterized using the DeLong test for comparing AUROCs, with P < .05 considered statistically significant.31 Evaluation was bootstrapped to generate 95% confidence intervals.
Association of each metric with stenosis in the multigrade setting was evaluated using model accuracy, multiclass AUROC with the one-vs-one criterion, and agreement with R1’s grades using a linearly-weighted Cohen κ coefficient.
Demographic Variability.
The AUROC for binarized grading of stenosis using each metric as a score was used to assess consistency across demographics. AUROC values were computed for sex splits (male versus female), age splits using 45 years as a cutoff (age younger than 45 years versus age 45 years or older),32 and BMI splits using a mean BMI of 25.0 kg/m2 as a cutoff (BMI < 25.0 kg/m2 versus BMI ≥ 25.0 kg/m2).33
Symptomatology.
The AUROC for binarized grading of stenosis was used to assess the accuracy of each metric across 2 groups: VAS < 7 and VAS ≥ 7.
Anatomic Normalization.
To evaluate anatomic normalization of each quantitative metric, we clustered spinal levels into 2 groups: 1) upper lumbar levels consisting of L1/L2, L2/L3, and L3/L4, and 2) lower lumbar levels consisting of L4/L5 and L5/S1.
Association with Prognosis.
The utility of each metric in association with outcomes was assessed on a subset of the evaluation cohort (n = 130), referred to as the “prognostic cohort” (n = 58) with patients managed conservatively (n = 30) and those who went on to require surgery (n = 28). Using each metric as a score, we evaluated the AUROC associated with predicting surgery from the preoperative MR imaging. Only the symptomatic level or the level at which surgery was performed was included in this analysis.
The decision tree classifier was used to grade each spinal level of the prognostic cohort (n = 58) as normal, mild, moderate, or severe. Linearly-weighted Cohen κ scores were computed for surgical-versus-conservatively managed cases.
Agreement and Reproducibility.
To characterize reliability for the proposed metrics, R2 and R1 annotated another subset of patients (n = 40) for lines from the evaluation cohort (n = 130). Reproducibility of estimating DDRDIA was computed using the concordance correlation coefficient.
To characterize interrater agreement for the qualitative grading of lumbar spinal stenosis, R1, R2, and a board-certified musculoskeletal radiologist (R3) with 23 years of experience assessed another subset of patients (n = 32) from the evaluation cohort (n = 130). Interrater agreement among R1, R2, and R3 was evaluated using a linearly-weighted Cohen κ coefficient.
RESULTS
Patient Cohort
The development cohort (n = 130) consisted of 65 female and 65 male patients, with a mean age of 57.6 (20.0–96.0) years and a mean BMI of 26.9 (15.3–58.8) kg/m2. Patients presented with either low back pain (n = 33), radicular pain (n = 14), or both low back pain and radicular pain (n = 68), as well as other symptoms (n = 15) including numbness, tingling, weakness, dysesthesia, and tightness. Patients in the development cohort had an average low back pain score of 5.8 (SD, 2.6) and a radicular pain score of 5.9 (SD, 2.7) on an 11-point qualitative numeric pain rating scale.
The evaluation cohort (n = 130) consisted of 58 female and 72 male patients with a mean age of 58.3 (19.0–84.0) years and a mean BMI of 26.7 (17.5–41.3) kg/m2. Patients in this cohort presented with low back pain (n = 27), radicular pain (n = 20), both (n = 72), and other symptoms (n = 11) including numbness, weakness, and tightness. Patients in the evaluation cohort had an average low back pain score of 5.8 (SD, 2.4) and a radicular pain score of 6.0 (SD, 2.5) on the numeric rating scale.
LSS Grades
A total of 555 slices were graded in the development cohort with the following distribution: normal (n = 273, 49.2%), mild (n = 200, 36.0%), moderate (n = 45, 8.1%), and severe (n = 37, 6.7%) stenosis across lumbar spinal levels L1/L2 (n = 113, 20.4%), L2/L3 (n = 121, 21.8%), L3/L4 (n = 122, 21.9%), L4/L5 (n = 113, 20.4%), and L5/S1 (n = 86, 15.5%).
A total of 491 slices were graded in the evaluation cohort with the following distribution: normal (n = 244, 49.7%), mild (n = 149, 30.3%), moderate (n = 37, 7.5%), and severe (n = 61, 12.5%) stenosis across lumbar spinal levels L1/L2 (n = 111, 22.6%), L2/L3 (n = 113, 23.0%), L3/L4 (n = 108, 22.0%), L4/L5 (n = 96, 19.6%), and L5/S1 (n = 63, 12.8%).
Cutoff Thresholds for Grading Stenosis
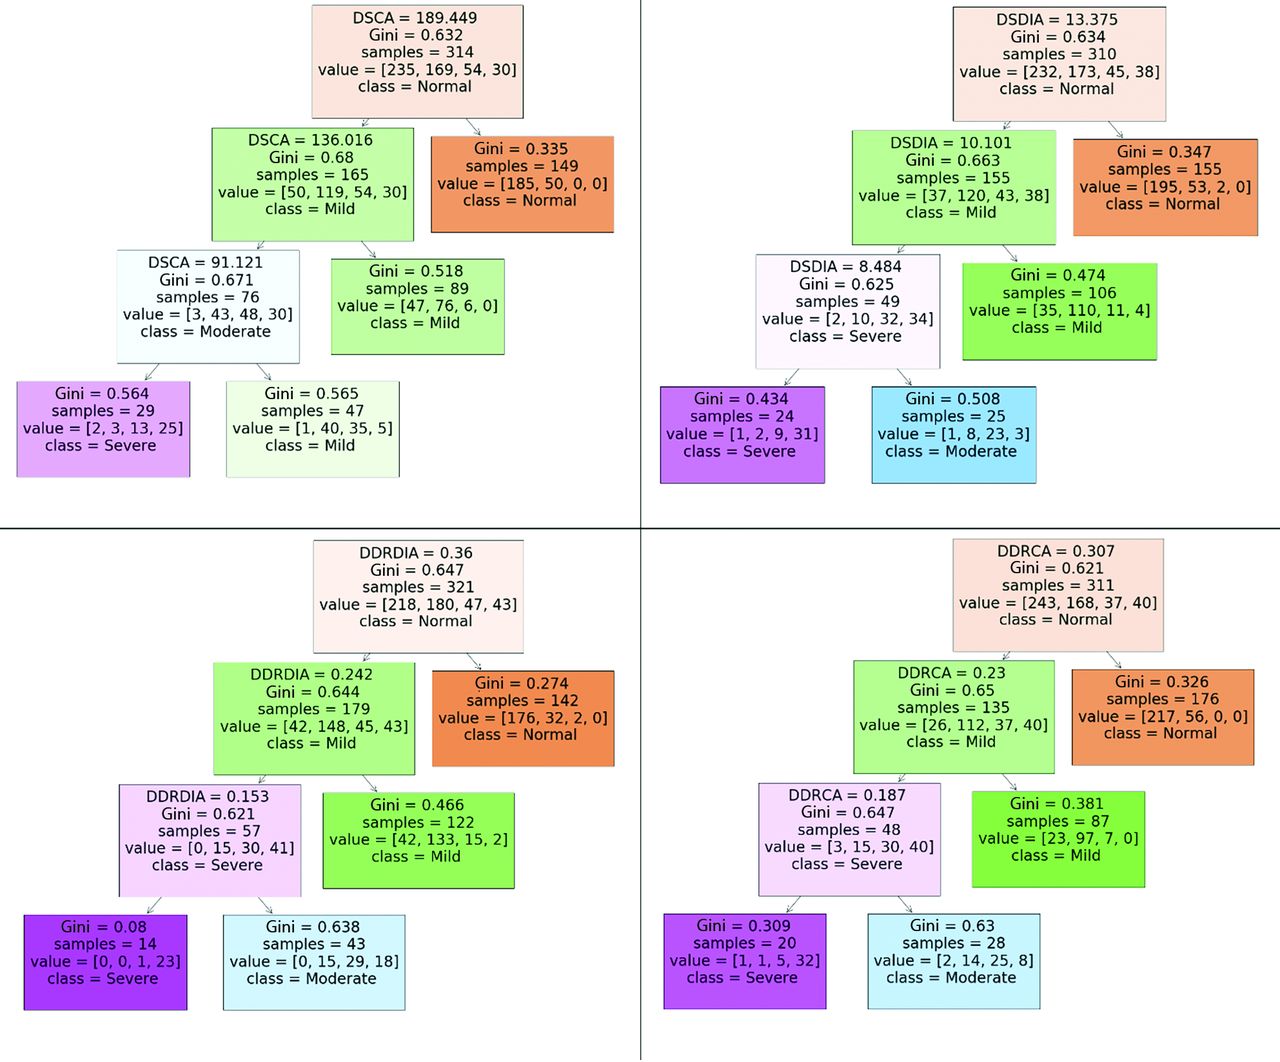
The decision tree for each quantitative metric was of depth 3 as visualized in Fig 3. Cutoff thresholds for grading stenosis using each metric were derived as follows:

Decision rules and cutoff thresholds generated by a decision the tree classifier (maximum depth = 3, maximum leaves = 4, criterion = Gini impurity) for each quantitative metric.
DDRDIA: normal, DDRDIA ≥ 0.36; mild, 0.24 ≤ DDRDIA < 0.36; moderate, 0.15 ≤ DDRDIA < 0.24; severe, DDRDIA < 0.15.
DDRCA: normal, DDRCA ≥0.31; mild, 0.23 ≤ DDRCA < 0.31; moderate, 0.19 ≤ DDRCA < 0.23; severe, DDRCA < 0.19.
DSCA: normal, DSCA ≥ 189.5 mm2; mild, 136.0 mm2 ≤ DSCA < 189.5 mm2; moderate, 91.1 mm2 ≤ DSCA < 136.0 mm2; severe, DSCA < 91.1 mm2.
DSDIA: normal, DSDIA ≥ 13.4 mm; mild, 10.1 mm ≤ DSDIA < 13.4 mm; moderate, 8.5 mm ≤ DSDIA < 10.1 mm; severe, DSDIA <8 .5 mm.
Statistical Analysis
Association with Stenosis.
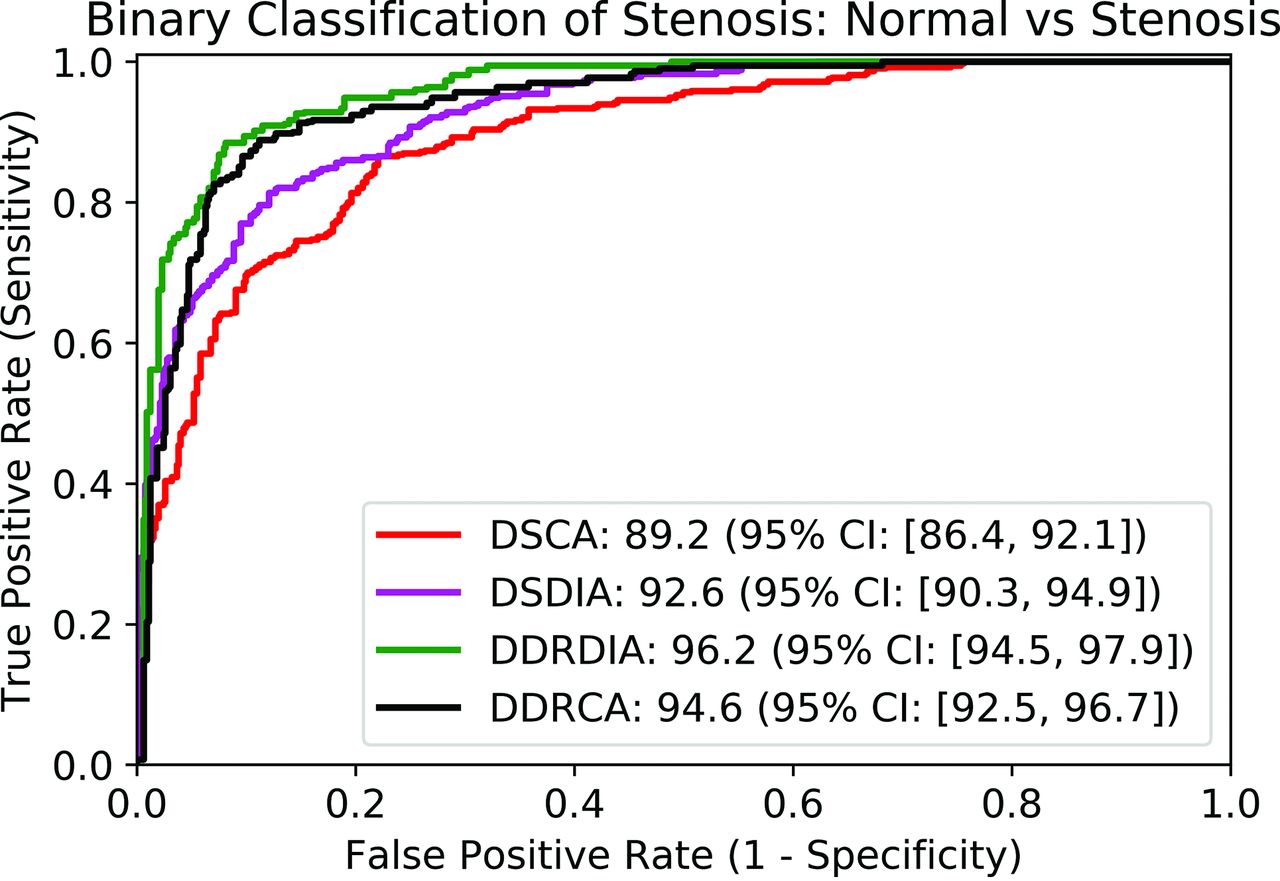
The proposed metrics, DDRCA and DDRDIA, had the highest AUROC for binarized classification of stenosis at 98.6 (97.4–99.3) and 98.0 (96.7–98.9), respectively, which were significantly higher (P < .05) than the standard of reference metrics, DSCA and DSDIA, with an AUROC of 96.5 (95.0–97.7) and DSDIA at 96.6 (95.1–97.8). The results are presented in Table 1 and visualized in Fig 4.

Receiver operator characteristic curve using each quantitative metric as a score for binary classification of stenosis. AUROC values are reported in the legend.
Classification of each spinal level as normal versus stenosed on the evaluation cohort (n = 130) using each quantitative metrica
DDRCA and DDRDIA had the highest agreement with R1 for multigrade classification of stenosis with κ values of 0.80 (0.75–0.83) and 0.75 (0.71–0.79), respectively, compared with DSCA at 0.62 (0.57–0.66) and DSDIA at 0.69 (0.64–0.75), respectively. Multiclass accuracy, AUROC, and κ scores for each metric are presented in Table 2.
Classification of each spinal level as normal, mild, moderate, and severe stenosis on the evaluation cohort (n = 130) using decision trees trained on the development cohort (n = 130)
Demographic Variability.
All 4 quantitative metrics had higher AUROC values for men compared with women (P < .001). No significant difference (P < .1) in the AUROC was observed in the case of the proposed metric DDRDIA across BMI groups. The other 3 metrics (DDRCA, DSDIA, DSCA) all had significant differences in the AUROC among the demographic splits (P < .001).
Symptomatology.
DDRDIA had a higher AUROC than all other metrics in cases with VAS ≥ 7. DDRDIA was also the only metric in which the AUROC for cases with VAS ≥ 7 was significantly higher (P < .001) than that of cases with VAS < 7. AUROC values are presented in Table 3.
AUROC for binary classification based on each metric across symptomatic splits (VAS <7 versus VAS ≥7) of low back pain and radicular paina
Anatomic Normalization.
No significant differences were observed in the values of DDRDIA and DDRCA for stenotic cases (mild, moderate, or severe) across the upper lumbar levels (L1/L2, L2/L3, L3/L4) and the lower lumbar levels (L4/L5 and L5/S1). The standard-of-reference metrics, DSCA and DSDIA. were sensitive to anatomic changes in cases with stenosis (P < .001).
Association with Prognosis.
The DDRCA had the highest AUROC for predicting surgery at each spinal level from the prognostic cohort (n = 58), with a value of 83.5 (76.6–90.1), which was significantly greater than the standard-of-reference DSCA and DSDIA, which had AUROCs of 82.4 (75.5–90.4) and 81.3 (73.2–89.4). DDRDIA had the lowest AUROC for predicting surgery, with a value of 80.8 (73.0–89.5). These results are reported in Table 4.
AUROC for predicting surgery using each quantitative metric on the prognostic cohort (n = 58)
The DDRDIA had the highest agreement with R1 for multiclass grading of stenosis in surgical cases, with a κ coefficient of 0.77 (0.65–0.90). κ scores for all other metrics across surgical-versus-nonsurgical levels were significantly lower, reported in Table 5.
Classification of each spinal level as normal, mild, moderate, and severe stenosis on the prognostic cohort (n = 58) using decision trees trained on the development cohort (n = 130)
Agreement and Reproducibility.
The reproducibility of measuring DDRDIA was substantial, with a concordance correlation coefficient of 0.9 between R1 and R2. Interrater agreement among (R1, R2), (R1, R3), and (R2, R3) was substantial with κ scores of 0.79, 0.72, and 0.65, respectively.
DISCUSSION
In this study, we proposed 2 ratio-based metrics for grading LSS, which, to our knowledge, has heretofore not been investigated in the literature. DDRDIA and DDRCA measured ratios between the dural sac and the intervertebral disc of the anterior-posterior diameters and cross-sectional areas, respectively. Our ratio-based approach naturally lends itself to a normalized metric between 0 and 1, which can be interpreted clinically as a surrogate for the severity of stenosis.
Our results indicate that DDRDIA and DDRCA perform as well or superior to the standard of reference metrics such as DSCA and DSDIA. Prescribed thresholds for DSCA are typically binarized into normal versus stenosed or normal/mild/moderate stenosis versus severe stenosis.13,14 Our study provides more fine-grained thresholds for grading stenosis using each quantitative metric. The thresholds generated by a decision tree for DSCA and DSDIA, 91.1 mm2 and 10.1 mm, respectively, are consistent with previously published values for these metrics,14 further validating our methodology to obtain thresholds using a decision tree classifier.
Our analysis suggests that ratio-based metrics such as DDRDIA and DDRCA are more consistent across demographic variability, anatomically normalized, and better correlated with symptomatology and clinical outcomes compared with nonratio metrics such as DSCA and DSDIA.
DDRCA had a linearly weighted κ score of 0.80 using R1’s grades as the ground truth, which is higher (albeit not statistically significant) than the agreement between R1 and R2 as well as between R1 and R3. High accuracy of DDRCA is an encouraging step toward multigrade classification of stenosis using ratio-based quantitative metrics. In comparison, DSCA had a significantly lower κ score of 0.62, lower than all pair-wise interrater agreement scores, confirming our hypothesis that normalized measures may be more effective as a quantitative metric for not only diagnosing stenosis but also classifying it into more granular grades.
Quantitative metrics based on ratios are also inherently robust to measurement, a finding supported by our reproducibility analysis, in which the concordance correlation coefficient between R1 and R2 was 0.9 for estimating DDRDIA. Although not explicitly quantified in this study, DDRDIA may be less prone to errors because it requires the radiologist to draw 2 lines as opposed to segmentation of the dural sac for area measurements, also making it more time-efficient.
A few other quantitative ratios have been proposed in the literature. The stenosis ratio, defined as a ratio between the cross-sectional dural sac area of the motion segment and that of the stable segment, was proposed as a promising alternative to DSCA in controlling for inherent differences in patient demographics.34,35 The Torg-Pavlov ratio, which measures the ratio between the sagittal diameter of the spinal canal and the sagittal diameter of the vertebral body, is a normalized metric that can be used to assess the presence of spinal cord compression from MR imaging.36 Neither the stenosis ratio nor the Torg-Pavlov ratio has been widely adopted in clinical practice for grading stenosis. The stenosis ratio requires precise measurements of multiple regions and their respective areas, which can be time-consuming and not consistent.14 The Torg-Pavlov ratio has been sparsely applied to the cervical spine, with almost no prior studies establishing its effectiveness for the lumbar spine.37 Moreover, for any given level, the disc level has been reported to be the most stenotic and prone to degenerative changes compared with the vertebral body.38 Hence, the disc size measured as either the anterior-posterior diameter or the cross-sectional area may be a relevant feature associated with degenerative changes.
Ratios between the dural sac and the vertebral body have been published in the literature for adults as well as children and have been used for evaluation of multiple conditions.39,40 For degenerative lumbar stenosis, the disc levels are the predominant stenotic levels, motivating our proposed metrics. Studies calculating a “disc index,” a ratio of the disc-to-canal size, have reported that larger disc indexes are associated with more continuous symptoms, and as ratios decreased with time, the symptoms also regressed.41 An early description of the anterior-posterior length of disc protrusion and the percentage of the canal occupied by the disc protrusion was reported in 1997, and strong predictive effects were found between ratio measurements and patient outcomes.42 Subsequent studies have also supported the use of disc ratios for predicting patient groups with favorable-versus-unfavorable surgical outcomes.43 While disc dimension has been previously used in the context of lumbar disc herniation, to our knowledge, it is not commonly incorporated as a potential quantitative feature along with dural sac measurements for grading LSS.
We acknowledge the following limitations of this study: Our results are based on a single expert radiologist grader and do not incorporate consensus grading or any other form of adjudication; while consensus grades are advantageous, prior studies that relied on a single grader have shown meaningful associations.28 Our approach based on decision trees may be prone to overfitting and brittle decision boundaries, wherein a slight perturbation to the development data can lead to drastically different thresholds.28 Also, there are numerous statistical and machine learning techniques that can be used to determine a decision rule for each metric. A random forest model, which is a collection of several decision trees, may be more robust; we deliberately selected a decision tree for its interpretable thresholds and decision rules. We limited the depth to 3 and the maximum number of leaves to 4 to address some of the concerns around overfitting, and we observed that the derived thresholds of 91.1 mm2 for severe stenosis based on DSCA and 10.1 mm for moderate or severe stenosis based on DSDIA are in line with previously published thresholds for the dural sac cross-sectional area and diameter.14
Another potential limitation is our reliance on a single outcome measure (VAS) for symptoms and a cutoff threshold of 7 to denote severe pain; other less common measures may be very valuable and the subject of future studies. Last, a potential limitation may be the acquisition of contiguous axial MR images, our institution’s routine lumbar spine imaging protocol. A prior study reported that the use of disc space–targeted angled images resulted in a 75% reduction in the detection of migrated or sequestered disc material and a 50% decrease in detected pars defects compared with contiguous axial images.44
CONCLUSIONS
We found favorable results for our proposed ratio-based metrics, DDRDIA and DDRCA, which rely on simple measurements of the intervertebral disc and the dural sac, compared with common metrics such as the DSCA. Our results indicate that ratio-based metrics may offer a convenient trade-off between the classification of stenosis, robustness to measurement errors, and normalization across anatomic and demographic variability and stronger associations with LSS symptoms and prognosis. The proposed metrics are also practical in a clinical setting and amenable to automated estimation and can influence the diagnosis and subsequent management of patients with LSS.
Acknowledgments
We also thank Mirandarae Christine, Steven Li, and Eduarda Vieira for their contributions to image annotations.
Footnotes
A.R. Ben-Natan and J. Huang contributed equally to this work.
This work was funded by the National Institute of Arthritis and Musculoskeletal and Skin Diseases, grant/award No: UH2AR076724-01.
Disclosure forms provided by the authors are available with the full text and PDF of this article at www.ajnr.org.
Indicates open access to non-subscribers at www.ajnr.org
References
- Received January 30, 2022.
- Accepted after revision July 25, 2022.
- © 2022 by American Journal of Neuroradiology


