
Abstract
BACKGROUND AND PURPOSE: Despite high interest in machine-learning algorithms for automated segmentation of MRIs of patients with brain tumors, there are few reports on the variability of segmentation results. The purpose of this study was to obtain benchmark measures of repeatability for a widely accessible software program, BraTumIA (Versions 1.2 and 2.0), which uses a machine-learning algorithm to segment tumor features on contrast-enhanced brain MR imaging.
MATERIALS AND METHODS: Automatic segmentation of enhancing tumor, tumor edema, nonenhancing tumor, and necrosis was performed on repeat MR imaging scans obtained approximately 2 days apart in 20 patients with recurrent glioblastoma. Measures of repeatability and spatial overlap, including repeatability and Dice coefficients, are reported.
RESULTS: Larger volumes of enhancing tumor were obtained on later compared with earlier scans (mean, 26.3 versus 24.2 mL for BraTumIA 1.2; P < .05; and 24.9 versus 22.9 mL for BraTumIA 2.0, P < .01). In terms of percentage change, repeatability coefficients ranged from 31% to 46% for enhancing tumor and edema components and from 87% to 116% for nonenhancing tumor and necrosis. Dice coefficients were highest (>0.7) for enhancing tumor and edema components, intermediate for necrosis, and lowest for nonenhancing tumor and did not differ between software versions. Enhancing tumor and tumor edema were smaller, and necrotic tumor larger using BraTumIA 2.0 rather than 1.2.
CONCLUSIONS: Repeatability and overlap metrics varied by segmentation type, with better performance for segmentations of enhancing tumor and tumor edema compared with other components. Incomplete washout of gadolinium contrast agents could account for increasing enhancing tumor volumes on later scans.
ABBREVIATIONS:
- BRATS
- Multimodal Brain Tumor Image Segmentation Benchmark
- CCC
- concordance correlation coefficient
- ICC
- intraclass correlation coefficient
- GCI
- generalized conformity index
- RC
- absolute Bland-Altman repeatability coefficient
- RC%
- Bland-Altman repeatability coefficient in terms of percentage change
Automated tumor-segmentation software is usually evaluated by comparing automated segmentations with those obtained by or approved by human expert observers. For example, in the Multimodal Brain Tumor Image Segmentation Benchmark (BRATS) challenges, consensus segmentations were obtained by fusing the input of human expert observers, and segmentation software performance was measured using the Dice score, sensitivity, specificity, and 95th percentile of the Hausdorff distance.1 Although this analysis is helpful for evaluating segmentation accuracy, it does not measure the variability of automated segmentation. Measurements of segmentation variability are important for quantifying the uncertainty for any given segmentation volume measurement and estimating the smallest change in these parameters that can be measured reliably. These estimates are useful to evaluate the suitability of automated segmentation software for clinical applications in which interval change in tumor size is the primary parameter of interest.
The primary goal of this study was to study the variability of segmentation volumes and spatial overlap obtained using the widely available software package, Brain Tumor Image Analysis (BraTumIA)2 (Version 1.2 and Version 2.0; https://www.nitrc.org/projects/bratumia).2 This software uses machine-learning techniques to produce fully automated segmentations of high-grade gliomas, which are highly correlated with the results of manual human rater segmenations.2,3
MATERIALS AND METHODS
Patient Population
Segmentations were performed on MR image sets obtained from 20 patients (13 men, 7 women; age range, 39–64 years; mean, 52.9 [SD, 7.7] years of age) with pathologically confirmed glioblastoma diagnosed with recurrence who underwent repeat pretreatment imaging as part of a study of bevacizumab and irinotecan therapy.4 These patients were older than 18 years of age and had Karnofsky scores of at least 60%. Included patients had a minimum of 6 weeks between previous surgical resection and the beginning of the study and 4 weeks between previous radiation therapy or chemotherapy and the beginning of the study.
Written informed consent was obtained for the underlying clinical study, which was approved by the Duke Health Institutional Review Board, and also for this retrospective study on collected imaging data. Of note, 19 of the 20 patients reported here have publicly available imaging from the Cancer Imaging Archive (https://wiki.cancerimagingarchive.net/display/Public/RIDER+NEURO+MRI).
MR Imaging
MR images were obtained on a single 1.5T scanner (Avanto; Siemens). The imaging protocol included the following: axial precontrast 2D spin-echo T1WI (TE = 7.7 ms, TR = 500 ms, flip angle = 90º, FOV = 178.75 × 220 mm2, voxel size = 0.430 × 0.430 × 7.5 mm3); axial 2D spin-echo T2WI (TE = 93 ms, TR = 4100 ms, flip angle = 150°, FOV = 192.50 × 220 mm2, voxel size = 0.573 × 0.573 × 7.5 mm3); and axial 3D-FLAIR images (TE = 119 ms, TR = 9000 ms, TI = 2300 ms, flip angle = 180°, FOV = 175.31 × 220 mm2, voxel size = .859 × 0.859 × 7.5 mm3). Gd-DTPA (Magnevist; Bayer HealthCare Pharmaceuticals) was injected intravenously at a dose of 0.1 mmol/kg for dynamic contrast-enhanced MR imaging. This was immediately followed by axial postcontrast 2D spin-echo T1WI (TE = 7.7 ms, TR = 500 ms, flip angle = 90°, FOV = 165 × 220 mm2, voxel size = 0.430 × 0.430 × 7.5 mm3). Next, a T1-weighted 3D echo-spoiled gradient-echo sequence was performed. Repeat scans were generally performed 2 days after the initial scans (mean, 45.1 [SD, 7.6] hours; range, 23.2–54.6 hours).
Automatic Segmentation
The BraTumIA2 software was used to automatically segment each MR imaging scan into 4 components: enhancing tumor, tumor edema, nonenhancing tumor, and tumor necrosis. Segmentation of white matter and gray matter components of normal brain are also provided. 2D-T1WI, contrast-enhanced T1WI, T2WI, and FLAIR MR imaging sequences described above were used as input. The machine learning–based methods used by the BraTumIA to produce segmentations are described separately.2 Of note, the segmentations produced by BraTumIA 1.2 were deterministic, and those of BraTumIA 2.0 were not. For BraTumIA 2.0, a single summary segmentation was produced for each scan by repeating the segmentation 25 times and resolving disagreements using the same procedure used for resolving reader disagreements in the BRATS study.1 Across the 25 repetitions, the variability of segmentation volumes was assessed using percentage coefficients of variation and variability of overlap, using the generalized conformity index (GCI),5 in which a GCI of zero indicates no segmentation overlap across repetitions, a GCI of 1 indicates complete spatial overlap across repetitions, and a GCI of 0.7–1.0 is considered excellent performance.6
Statistical and Image Analysis
Standard repeatability metrics,7 including Bland-Altman repeatability coefficients (RC), intraclass correlation coefficients (ICC), and concordance correlation coefficients (CCC), were obtained for the volumes for each segmentation component as well as selected segmentation combinations. Segmentation combinations included total tumor-related abnormality (enhancing + edema + nonenhancing + necrosis), total nonenhancing tumor–related abnormality (edema + nonenhancing + necrosis), and nonenhancing non-necrotic tumor–related abnormality (edema + nonenhancing). Segmentation volumes obtained at the earlier and later scans using Version 1.2 and Version 2.0 of the software were compared using t tests. ICCs were interpreted using standard guidelines.8
The rigid body algorithm in 3D Slicer, Version 4.8.19 (www.slicer.org) and the Mattes Mutual Information algorithm were used to spatially register the segmentations of 3D echo-spoiled gradient-echo sequences from the 2 time points. The registration matrix obtained from combining this registration with registration of the input images to the 3D echo-spoiled gradient-echo sequence from the same time point was then applied to align the output segmentations. Spatial overlap of segmentations was measured using EvaluateSegmentation10 (https://github.com/Visceral-Project/EvaluateSegmentation). To minimize possible bias due to head positioning, we calculated overlap metrics both after registration of the later-to-earlier scan and registration of the earlier-to-later scan and averaged them.
RESULTS
Summary Statistics
Measurements of the reproducibility of segmentation volumes and overlap for repeat BraTumIA 2.0 segmentations on identical datasets are summarized in the Online Supplemental Data. The mean coefficient of variation was <4%, and the GCI showed excellent segmentation overlap for all segmentation components and all combined segmentations except for the segmentations of nonenhancing and necrotic tumor, the 2 components with the smallest mean volume.
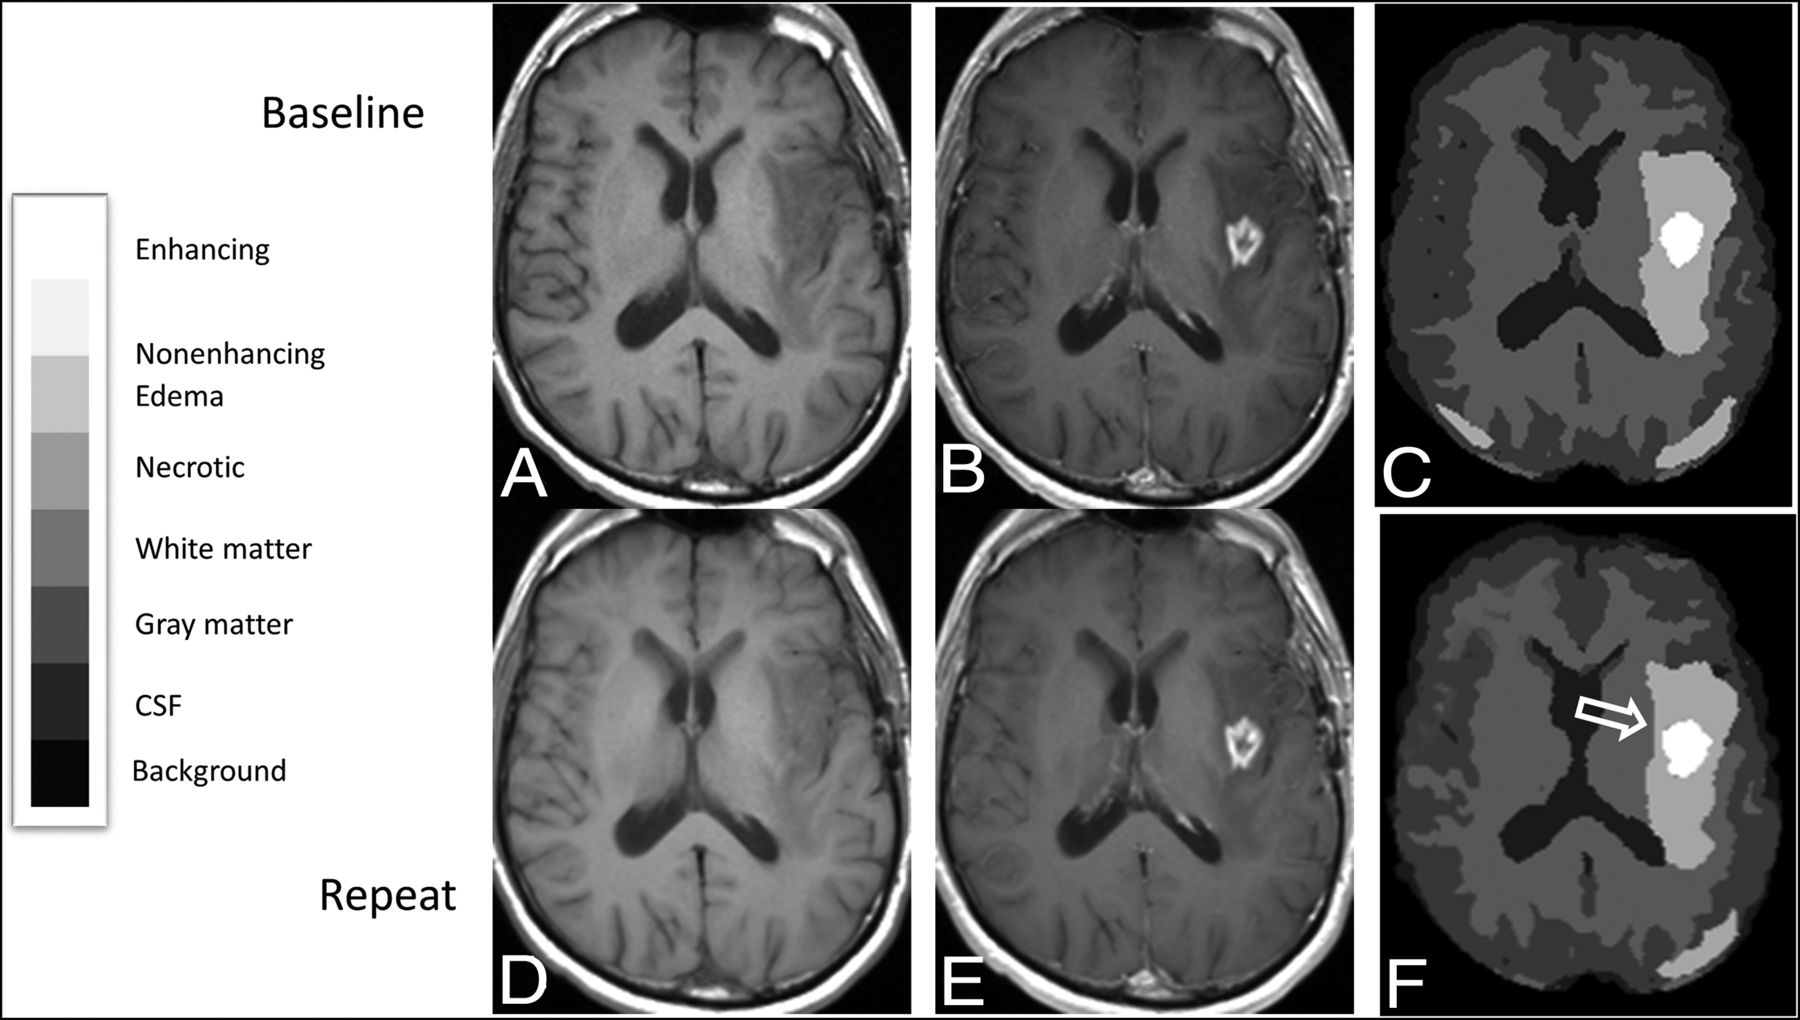
Mean segmentation volumes obtained by BraTumIA 1.2 and BraTumIA 2.0 software (using the summary segmentation for the latter) at baseline and repeat MR imaging scans are summarized in Table 1. For both BraTumIA 1.2 and 2.0, volumes of enhancing tumor were larger on the later dataset (mean, 26.3 versus 24.2 mL, P < .05; and 24.9 versus 22.9 mL, P < .01, respectively); an example of a case with a larger volume of enhancement on repeat imaging is shown in Fig 1. No significant differences in volumes for any of the remaining segmentation components and/or combinations were seen.

Registered baseline and repeat MR images from a 53-year-old man with multifocal left-hemispheric recurrent glioblastoma, with corresponding segmentations showing enlargement of enhancement segmentation on the repeat study compared with the baseline study. Registered T1-weighted axial slices obtained at baseline before (A) and after (B) administration of Gd-DTPA are shown along with segmentations obtained using BraTumIA 2.0 (C), as well as corresponding registered slices (D and E) and segmentation (F) from the repeat image set, aligned to match the baseline image set. The segmentation from the repeat image set appears larger along its anterior margin (open arrow). The overall enhancement volume increased by 2.2 mL on the repeat image set across all slices in the imaging volume. The legend for categorization of segmentation components within the segmentation is provided on the left.
Differences between segmentation volumes obtained at baseline and repeat imaging (in mL)
Repeatability coefficient in terms of both absolute volume (RC) and percent change (RC%) are summarized in Table 2. Other previously recommended repeatability measurements,7 including the mean total SD, mean within-subject SD, ICC, and CCC are also reported for each segmentation type and combined segmentations in the Online Supplemental Data.
Measures of repeatability for automatically segmented volumes
CCCs were >0.8 for all tumor-related segmentations. By standard interpretation of ICCs, the reliability of segmentation volumes was excellent for segmentation of enhancement and necrosis for both software versions and for total tumor-related abnormality using BraTumIA 1.2, and it was good-to-excellent for all other segmentations (including all other combined segmentations) using both BraTumIA 1.2 and 2.0, except for segmentation of gray matter with BraTumIA 1.2 and of edema and white matter with BraTumIA 2.0, for which reliability was fair-to-excellent.
Repeatability varied across segmentation types. In terms of absolute volume, the mean RC was ≥24 mL for edema, total tumor-related abnormality, total nonenhancing tumor-related abnormality, and nonenhancing non-necrotic tumor–related abnormality for both software packages, and 95% CIs overlapped. For enhancing tumor volume, mean RCs were 6.9 and 5.2 mL for BraTumIA 1.2 and 2.0, respectively. For nonenhancing and necrotic tumor, the mean RCs were between 2 and 3 mL.
In terms of RC% for change in volume, CIs included or exceeded 100% change for nonenhancing tumor and necrosis segmentations. Mean RC% ranged from 26% to 46% for enhancing tumor; tumor edema; total tumor-related abnormality; total nonenhancing tumor–related abnormality; and total nonenhancing non-necrotic segmentations for both software packages.
Overlap Metrics
Analysis of Dice coefficients and 95th percentile and average Hausdorff distance (Table 3) showed that for the component segmentations, the Dice coefficients were highest (>0.7) for enhancing tumor and edema components; nonenhancing tumor had the lowest Dice coefficient; and necrosis was intermediate. An example of registered imaging slices and segmentations for a case with a relatively high Dice coefficient is illustrated in Fig 2. For all combined tumor segmentations, Dice coefficients were, on average, ≥0.75.

Registered baseline and repeat MR images from a 62-year-old man with recurrent glioblastoma in the left temporal lobe, with corresponding segmentations showing a relatively high Dice coefficient for segmentation of enhancing tumor. Registered axial slices from the baseline image set, including T1-weighted images before (A) and after (B) administration of contrast agent, as well as FLAIR (C) and T2-weighted images (D) produced segmentation (E) using BraTumIA 1.2. Corresponding registered slices from the repeat imaging set (F – I) produced segmentation (K) using BraTumIA 1.2. The legend for categorization of segmentation components within the segmentation is provided on the left. The overlap of enhancing tumor segmentations from baseline (white) and repeat (black outline) time points at this slice is shown (J). For this case, the overall Dice coefficient is 0.94 and the 95% Hausdorff distance was 4.3 mm for the enhancing tumor segmentations. The legend for categorization of segmentation components within the segmentation is provided on the left.
Spatial measures of similarity across repeat image segmentations
Average 95th percentile Hausdorff distances were <25 mm for enhancing, nonenhancing, and necrotic tumor and higher for tumor edema. Average Hausdorff distances were lowest (<1.2 mm) for enhancing tumor, tumor edema, and all combined tumor segmentations, and highest for nonenhancing and necrotic tumor.
Comparison of BraTumIA 1.2 and 2.0
The mean volumes for segmentations produced by the 2 versions of BraTumIA are reported in Table 4. BraTumIA 2.0 produced significantly smaller volumes for enhancing tumor and edema segmentations and significantly larger necrosis segmentations compared with BraTumIA 1.2 (P < .01 for all). The corresponding effect was also seen on the combined tumor segmentations, with BraTumIA 2.0 producing significantly smaller volumes on average (P < .05 for all). In contrast, the gray and white matter volumes reported by BraTumIA 2.0 were significantly larger than those reported by BraTumIA 1.2 (P < .005 and P < .05, respectively). A comparison of BraTumIA 1.2 and 2.0 segmentations performed on identical imaging data is shown in Fig 3. For all tumor segmentation components except for necrosis and for all combined tumor segmentations, the average 95th percentile Hausdorff distances were lower for BraTumIA 2.0 than for BraTumIA 1.2. Otherwise, no differences in the repeatability or overlap metrics were seen when comparing BraTumIA versions, and 95% CIs overlapped when measuring CCC, ICC, RC, RC%, Dice coefficients, and average Hausdorff distances for all segmentation components and combinations.
Paired t test results for volumes reported by BraTumIA 1.2 and BraTumIA 2.0 (in mL)

Contrast-enhanced T1-weighted image from an MR imaging study of a 47-year-old man with recurrent glioblastoma in the right parietal lobe with corresponding segmentations obtained using BraTumIA 1.2 and BraTumIA 2.0. Registered axial contrast-enhanced T1-weighted image from the baseline image set (B) is compared to segmentations obtained by BraTumIA 1.2 (A) and BraTumIA 2.0 (C). For this case, the overall volume of the enhancing tumor segmentations was 23.4 mL for BraTumIA 1.2 and 20.0 mL for BraTumIA 2.0. The legend for categorization of segmentation components within the segmentation is the same as for Figs. 1 and 2.
DISCUSSION
The purpose of this study was to establish benchmarks for segmentation software performance in terms of variability using widely accessible software developed using a machine-learning approach.2 These results may be useful for comparison with results obtained from other automated software using machine-learning or other approaches.
Although methods for measuring segmentation variability in the absence of ground truth segmentations have been described, none have been widely accepted. One approach to evaluating variability is to measure the repeatability of results when applied to images obtained in close temporal succession, the so-called "coffee break experiment” paradigm. For measurement of enhancing brain tumors using MR imaging, the choice of the interval between repeat scans represents a compromise between minimizing time during which the underlying tumor may change and maximizing time for washout of contrast agent from the circulation and tumor.
In this study, in which contrast-enhanced MR imaging scans were obtained between 23.2 to 54.6 hours apart, significantly larger volumes of enhancing tumor were obtained on the later scan than on the earlier scan using both BraTumIA 1.2 and 2.0, despite the relatively short time interval between scans. This result points out an important limitation in using repeat scans at short time intervals to measure the repeatability for segmentation of enhancing tumor. Although one cannot exclude this result possibly being, in part, due to tumor growth in the interval, this seems unlikely to entirely account for the magnitude of these changes. The median increase in enhancement volume in this short time period was approximately 3.0 mL (10.0% median volume increase) for BraTumIA 1.2, and 2.0 mL (10.3% median volume increase) for BraTumIA 2.0. These findings would suggest median specific growth rates of 2.1% and 2.3%/day, respectively, higher than the 1.2%/day rate reported for untreated glioblastoma.11 There were no significant differences in segmentation volumes for nonenhancing tumor and tumor edema between these time points; it seems unlikely that true tumor change of this magnitude would be unaccompanied by change in the volumes of these segmentation components. Finally, segmentations of enhancement in patients with glioblastoma using human raters have not shown volume change during similarly short time intervals.12
Incomplete washout of gadolinium contrast agents for days to weeks as previously documented by mass spectroscopy of brain tumor specimens13 could contribute to this result. Retained gadolinium contrast agent from the initial injection may result in more voxels becoming detectable above the image noise after contrast agent administration at the later scan, or it may indicate that the software was unable to completely correct for retained contrast agent on the noncontrast T1-weighted imaging on the later scan.
As a result, measurements of repeatability for the enhancing tumor reported in this study should be interpreted with caution. Although some of our figures of merit such as RCs are primarily related to measurement variability, the relationship of this variability to measurement magnitude is not known. In addition, inclusion of larger areas of enhancement on the later images would be expected to affect overlap metrics, leading to decreased Dice coefficients and increased Hausdorff distances. Replicating this study with longer intervals between scans may not yield more valid repeatability measurements because of the length of time gadolinium contrast agents may be retained in tumors,13 as well as the possible confounding effect of tumor growth.
Our results show that RCs are variable and dependent on the segmentation type; in terms of percentage change, the RC%s for both BraTumIA versions are high enough (>85%) that applications designed to reliably measure small changes in nonenhancing and necrotic tumor components in single patients across time are unlikely to be successful. In contrast, our results suggest that large changes in underlying tumor (for example, ≥24 mL in tumor edema, total tumor-related abnormality, total nonenhancing tumor, or nonenhancing non-necrotic tumor) could be reliably assessed, even in single patients.
Similarly, the performance of BraTumIA software segmentation in terms of overlap metrics varied across segmentation types. Dice coefficients were low, and average Hausdorff distance metrics were high for the nonenhancing and necrotic tumor components. These segmentations were the smallest tumor-related components, raising the possibility that the known confounding relationship between poorer overlap metrics and smaller objects compared with larger ones, given a fixed resolution,14 could account for these findings. In addition, the task of delineating these regions from adjacent areas may be particularly challenging; this challenge could be due to a poor definition of boundaries, particularly between nonenhancing tumor and adjacent edema, and for tumor necrosis and normal CSF-containing structures such as the sulci. It is interesting that (except for necrotic tumor) the 95th percentile Hausdorff distances were smaller for segmentations produced by BraTumIA 2.0 compared with Version 1.2. This could be explained by more spatial smoothing of segmentation surfaces in the newer version, which would presumably lead to fewer outliers when comparing contours.
To place our results in context, we found that the mean Dice score between raters as noted in the BRATS challenge was 0.85 for whole tumor and 0.74 for active tumor;1 this finding corresponds to 0.85 and 0.83 for whole tumor and 0.81 and 0.75 for enhancing tumor for BraTumIA 1.2 and 2.0, respectively, in our study. Thus, the performance of software in terms of the degree of overlap of segmentations on repeat image sets is roughly similar to the performance of different human raters on identical image sets. Similarly, the performance of BraTumIA software as measured by 95th percentile Hausdorff distances on repeat image sets was 40 and 27 mm for whole tumor and 19 and 14 mm for BraTumIA 1.2 and 2.0, respectively. This level of performance is well within the spectrum of performance of 20 software packages evaluated with similar measurements comparing software segmentations with consensus rater segmentations in the BRATS challenge.1
In comparing the 2 software versions, we noted significant differences in the performance of the segmentations: BraTumIA 2.0 produces significantly smaller volumes of enhancing tumor and edema tumor segmentations (on average 5% smaller for tumor and 4% smaller for edema) compared with BraTumIA 1.2. If segmentation performance compared with expert raters is improved in the newer version, our finding that white and particularly gray matter volumes were higher in BraTumIA 2.0 raises the possibility that the tumor segmentations may be more specific in the newer version. This possibility may help address concerns about overestimation of enhancing tumor volume when using BraTumIA 1.2, previously noted in preoperative patients,15 which was confirmed in a more recent study.16 Reliability measured by ICC, concordance measured by CCC, and overlap measured by Dice coefficients were similar between the 2 software versions.
This study has several limitations. Measurements of repeatability and overlap metrics reported in our study may only apply to a similar group of patients imaged under similar conditions. In this case, all patients were postoperative and had recurrent enhancing tumor, and volumes of enhancement were relatively large (mean volume of enhancement using BraTumIA 1.2 was 25.2 mL). Repeatability may be different if patients with smaller tumors are included; for comparison, in a study of the use of BraTumIA for estimating the extent of resection, preoperative and immediate postoperative scans had a mean volume of enhancement of 23.0 and 0.8 mL, respectively, using BraTumIA 1.2.13 Of note, when we studied the performance of the software version that produced nondeterministic results (BraTumIA 2.0) across identical datasets, the poorest performance in terms of variability in segmentation volume and segmentation overlap was seen with the segmentation components with the smallest volumes. Finally, factors related to the imaging, including MR imaging equipment (all imaging was performed on the same 1.5T scanner in our study) and the imaging protocol used, could further limit generalizability.
CONCLUSIONS
Segmentation software performance metrics for segmentation variability using BraTumIA, a widely accessible automated software package developed using machine learning, were calculated in patients with recurrent glioblastoma who underwent repeat MR imaging. These metrics can be used to inform evaluations of the practicality of using this software for applications for automated software volumetry, particularly for measuring interval changes in segmentation volumes. The finding that when MR images are obtained approximately 2 days apart, the volumes of enhancing tumors measure larger on later scans suggests that measuring reproducibility of this segmentation may be challenging. These results may be useful as a benchmark for comparison with results obtained from other automatic segmentation programs.
ACKNOWLEDGMENTS
We thank Gino Lerebours, MA, and Sheng Luo, PhD, for statistical advice, and David Radoff, MS, for analysis support.
Footnotes
Disclosures: Annick Desjardins—RELATED: Grant: Genentech/Roche, Comments: grant to the institution to support clinical trial work*; Consulting Fee or Honorarium: Advisory Board, Comments: Advisory Board more than 2 years ago; UNRELATED: Consultancy: Istari Oncology; Employment: Duke University Medical Center; Grants/Grants Pending: Celgene, Symphogen A/S, Orbus Therapeutics*; Patents (Planned, Pending or Issued): patent for genetically modified poliovirus for the treatment of solid tumors*; Stock/Stock Options: less than 1% stock in Istari Oncology. Daniel P. Barboriak—UNRELATED: Board Membership: Blue Earth Diagnostics, Comments: Medical Advisory Board for evaluation of a radiopharmaceutical; compensated for time and travel, none in last year; Grants/Grants Pending: NVIDIA, Comments: received TITAN Xp as part of NVIDIA GPU Grant program for an unrelated project.* *Money paid to the institution.
References
- Received March 18, 2020.
- Accepted after revision January 10, 2021.
- © 2021 by American Journal of Neuroradiology


Jump to section
Related Articles
Cited By...
- No citing articles found.