
Abstract
BACKGROUND AND PURPOSE: The secondary progressive phase of multiple sclerosis is characterised by disability progression due to processes that lead to neurodegeneration. Surrogate markers such as those derived from MRI are beneficial in understanding the pathophysiology that drives disease progression and its relationship to clinical disability. We undertook a 1H-MRS imaging study in a large secondary progressive MS (SPMS) cohort, to examine whether metabolic markers of brain injury are associated with measures of disability, both physical and cognitive.
MATERIALS AND METHODS: A cross-sectional analysis of individuals with secondary-progressive MS was performed in 119 participants. They underwent 1H-MR spectroscopy to obtain estimated concentrations and ratios to total Cr for total NAA, mIns, Glx, and total Cho in normal-appearing WM and GM. Clinical outcome measures chosen were the following: Paced Auditory Serial Addition Test, Symbol Digit Modalities Test, Nine-Hole Peg Test, Timed 25-foot Walk Test, and the Expanded Disability Status Scale. The relationship between these neurometabolites and clinical disability measures was initially examined using Spearman rank correlations. Significant associations were then further analyzed in multiple regression models adjusting for age, sex, disease duration, T2 lesion load, normalized brain volume, and occurrence of relapses in 2 years preceding study entry.
RESULTS: Significant associations, which were then confirmed by multiple linear regression, were found in normal-appearing WM for total NAA (tNAA)/total Cr (tCr) and the Nine-Hole Peg Test (ρ = 0.23; 95% CI, 0.06–0.40); tNAA and tNAA/tCr and the Paced Auditory Serial Addition Test (ρ = 0.21; 95% CI, 0.03–0.38) (ρ = 0.19; 95% CI, 0.01–0.36); mIns/tCr and the Paced Auditory Serial Addition Test, (ρ = −0.23; 95% CI, −0.39 to −0.05); and in GM for tCho and the Paced Auditory Serial Addition Test (ρ = −0.24; 95% CI, −0.40 to −0.06). No other GM or normal-appearing WM relationships were found with any metabolite, with associations found during initial correlation testing losing significance after multiple linear regression analysis.
CONCLUSIONS: This study suggests that metabolic markers of neuroaxonal integrity and astrogliosis in normal-appearing WM and membrane turnover in GM may act as markers of disability in secondary-progressive MS.
ABBREVIATIONS:
- CSI
- chemical shift imaging
- EDSS
- Expanded Disability Status Scale
- 9HPT
- Nine-Hole Peg Test
- IPS
- information processing speed
- NAWM
- normal-appearing white matter
- PASAT3
- Paced Auditory Serial Addition Test (3-second)
- PPMS
- primary-progressive MS
- SDMT
- Symbol Digit Modalities Test
- SPMS
- secondary-progressive MS
- T25-FW
- Timed 25-foot Walk
- tCho
- total Cho
- tCr
- total Cr
- tNAA
- total NAA
- WML
- white matter lesions
- PMS
- Progressive forms of MS
Secondary-progressive MS (SPMS) is the dominant progressive form of multiple sclerosis that is characterized by accumulating disability due to a variety of neurodegenerative processes.1 These include microglial activation with subsequent formation of reactive oxygen species inducing mitochondrial damage, sodium channel dysfunction leading to histotoxic hypoxia and axonal energy failure, and glutaminergic excitotoxicity.2⇓-4
Surrogate markers of brain injury are valuable in improving our understanding of the pathophysiology driving clinical disability in progressive forms of MS (PMS). Surrogate imaging-based markers such as MR imaging–based lesional and atrophy metrics can identify existing inflammatory injury and axonal loss and provide adjunctive prognostic information. Yet existing imaging based–measures are relatively limited in their ability to demonstrate metabolic or microstructural changes and show only a modest association with clinical disability outcomes in PMS.5 This is where advanced nonstructural MR imaging techniques such as 1H-MR spectroscopy are attractive to further understand this neuropathology and its association with clinical disability in progressive forms of MS.
By means of 1H-MR spectroscopy, neurometabolites of interest in MS include the following: N-acetylaspartate plus N-acetylaspartylglutamate (total NAA = tNAA), a marker of neuroaxonal integrity and mitochondrial function;6,7 Glx, the sum of the excitatory neurotransmitter glutamate and its precursor glutamine;4 myo-inositol (mIns), a marker of glial cell activity, most likely astrogliosis; and total choline (tCho = glycerophosphocholine and phosphocholine), a marker of membrane turnover.7,8 Many studies have demonstrated decreases in tNAA and tNAA/tCr and increases in total creatine (tCr = creatine and phosphocreatine) and inositol in normal-appearing white matter (NAWM) and GM in SPMS.9 In a recent meta-analysis of 1H-MR spectroscopy studies, effect sizes for a reduction in NAA and NAA/Cr were larger in PMS compared with relapsing-remitting MS.9 There have been conflicting results from studies examining disability associations in PMS: Several studies showed no association between metabolites (NAA, Glx, mIns, tCho) and the Expanded Disability Status Scale score (EDSS),10⇓⇓-13 while others showed moderate associations with EDSS, the Nine-Hole Peg Test (9HPT), and the Timed 25-foot Walk Test (T25-FW) in cortical GM and NAWM.14⇓-16 Of the studies examining cognitive performance (including information processing speed [IPS]) in PMS, no associations were found in sample sizes ranging from 14 to 31, with only 2 of these studies containing pure SPMS cohorts.13,14,16⇓-18
The rationale for this cross-sectional study was to further define metabolite levels and their associations with disability in a much larger sample of individuals with SPMS than has been achieved before.
MATERIALS AND METHODS
Participants and Measures
Participants were recruited from the MS-Secondary Progressive Multi-Arm Randomization Trial (MS-SMART) (NCT01910259), a Phase IIb double-blind, placebo-controlled, multiarm, multicenter study assessing the neuroprotective potential of amiloride, fluoxetine, and riluzole in SPMS. Details of the trial protocol and final trial results were recently published.19,20 Participants recruited into the study were individuals with SPMS, 25–65 years of age with an EDSS score of 4.0–6.5, which showed evidence of progression independent of relapses during the past 2 years. Participants were randomized 1:1:1:1 to amiloride, fluoxetine, riluzole, or placebo, and the primary outcome measure was the percentage brain volume change over 96 weeks.
Participants involved in the MS-SMART study at our site (Queen Square MS Center, University College London) were invited to take part in an optional “Advanced MR imaging substudy” inclusive of 1H-MR spectroscopy scans. Recruited participants had their MR imaging and clinical assessments before randomization and commencing study medication. They underwent a series of clinical assessments including EDSS, T25-FW, 9HPT, and 2 standard measures of IPS: the Paced Auditory Serial Addition Test-3 (PASAT3) and the Symbol Digit Modalities Test (SDMT).21⇓-23 MR imaging measures included normalized brain volume, NAWM, cortical GM, and T2 lesion volume.
Consent was obtained for all participants according to the Declaration of Helsinki and ethical approval for the study was provided by the Scotland A Research Ethics Committee (13/SS/0007).
MR Imaging Acquisition
Neurometabolite spectra from multiple voxels within 1 scan were acquired using a technique known as chemical shift imaging (CSI) to determine estimated neurometabolite concentrations and ratios by obtaining average metabolite concentrations from a slice of neuronal tissue.24 Imaging was acquired using an Achieva 3T MR imaging scanner (Philips Healthcare) with a 16-channel neurovascular coil.
All participants underwent the following scans:
MRS.
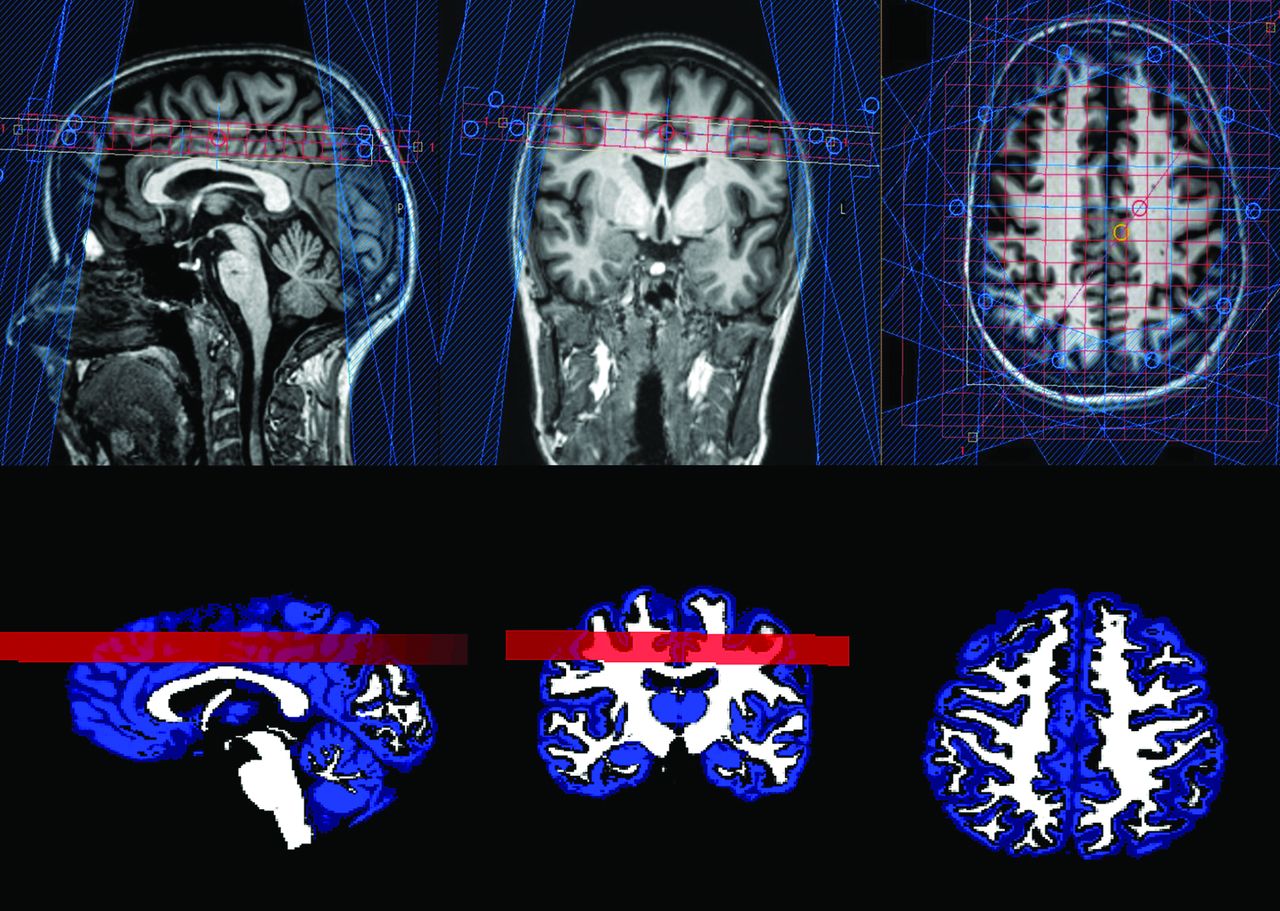
A 210 × 160 mm2 VOI with a 15-mm slice thickness was selected for CSI, placed superior to the lateral ventricles (Fig 1). The inferior margin of the slice was positioned at the superior margin of the corpus callosum, angulated to the anterior/posterior commissure line. At the baseline visit, a screen shot of the exact positioning of the CSI was saved (Fig 1) to be used as a reference for subsequent time points. The slice placement was chosen to avoid the ventricles to ensure that all voxels were of consistent quality and shim. The CSI VOI was subdivided into a 21 × 16 grid, with a voxel size of 10 × 10 × 15 mm3. Spectra were acquired using the manufacturer’s 2D point-resolved spectroscopic sequence (short TE = 35 ms, TR = 2000 ms). Outer volume suppression using fat saturation was applied to limit artifacts, and the VOI was shimmed using the pencil beam-automatic technique.25 Chemical shift selective saturation pulses were used for water suppression. A reference scan with no water suppression was also performed with identical parameters during the same examination for quantification. tNAA (total NAA = N-acetylaspartate and N-acetylaspartylglutamate), mIns, Glx (sum of glutamate and glutamine), tCho (total choline = glycerophosphocholine and phosphocholine), and each of their ratios to total creatine (sum of creatine and phosphocreatine) were calculated.

Proton MR spectroscopy slice placement and mask. The upper panel demonstrates slice placement in the sagittal, coronal, and axial planes. The lower panel shows an example of the chemical shift mask for normal-appearing white matter and gray matter.
Structural MR Imaging.
Scans for structural information and lesion assessment were collected before MR spectroscopy as detailed below and were also used for planning purposes. A sagittal 3D-T1WI with matrix = 256 × 256, FOV = 256 × 256 mm2, 180 sagittal slices 1 mm thick, flip angle = 8°, TR/TI/TE = 7/840/3.2 ms (turbo factor = 230) was acquired for structural information. An axial proton-density T2 (TR/TE1/TE2 = 3500/19/85 ms, turbo factor = 10) and FLAIR sequences (TR/TI/TE = 8000/2400/125 ms, turbo factor = 24) with matrix = 240 × 180, FOV = 240 × 180 mm2, and 50 slices 3 mm thick) were acquired for lesion assessment.
MR Imaging Analysis
Brain and WM Lesion Segmentation.
To obtain segmentations of WM, GM, and CSF, a NIfTI image was created in the same space as the axial proton-density T2 to represent the positioning of the CSI matrix and to act as a mask for the MR spectroscopy volume (Fig 1). The axial proton-density T2 image was rigidly registered and resampled to the 3D T1 image space using Nifty Reg (https://sourceforge.net/projects/niftyreg/),26 and an identical transform was applied to the CSI mask to get the matrix in the desired space for segmentation. WM lesions were semimanually delineated using Jim 7 software (http://www.xinapse.com/home.php) on the T2WI using the FLAIR image as a reference. After lesion-filling,27 the 3D-T1WI was segmented using Geodesical Information Flows, enabling the calculation of T2 lesion volume.28
Brain Volume Measures.
Normalized brain volume was calculated using the FSL SIENAX (http://fsl.fmrib.ox.ac.uk/fsl/fslwiki/SIENA) method from the segmented 3D-T1WI.29 SIENAX rescales each subject head to a Montreal Neurological Institute atlas size, hence correcting each individual brain volume. Thus, the normalized brain volume is the volume of the rescaled brain, and it allows us to correct brain volume for variations in head size, effectively resulting in a measure of cross-sectional atrophy.29
CSI Spectra and Image Postprocessing.
Following the acquisition, postprocessing of spectra were completed using Linear Combination of Model spectra (LCModel, Version 6.3-1A; http://www.lcmodel.com), a program used to fit MR spectroscopy data to a basis set, which, together with the water reference scan, enabled estimated quantification of metabolites as well as providing a set of parameters to perform quality assurance for each voxel.30 The LCModel basis set was provided by S. Provencher (personal written communication, 24 October 2010).
The water reference scan was used to find a scaling factor for the basis set, as detailed in the LCmodel manual.30 This carries with it the assumption that the concentration of water in the spectrum is equivalent to that of healthy white matter (35880 mM), which, in the absence of a specific measure per patient, is often used as the default.30,31 In addition, to correct for T2 relaxation, we set the default water density to 0.7, based on TE = 30 and on Ernst et al,31 who found that the major water compartment in brain has T2 ≈ 80 ms [exp(−TE/T2) = exp (−30/80) ≈ 0.7].30 If substituted for TE = 35 ms, this reduces to 0.65; however, in the absence of an accurate T2 in pathology, the default was again kept (Section 11.2; LCmodel manual). Because we used a long TR and water scaling, no correction for T1 was made.
Spectra from individual voxels were automatically rejected if any neurometabolite Cramer-Rao lower bounds were >20%, the full width at half maximum of the tNAA spectral peak was >15Hz, or the SNR was <9. All voxels that passed the automated step were visually inspected by an experienced assessor (B.S.S.) to look for baseline artifacts, nonrandom residuals, or outer volume contamination that may prevent the accurate measurement of neurometabolites. The resulting set of voxels made up a clean dataset, which passed the automated and visual quality assurance.
Figure 2 is a sample spectrum from a single voxel of brain tissue and spectra from the chemical shift imaging grid.

Sample spectra and the chemical shift grid show the position where representative spectra originate, including a lesion (A), accepted spectra in red and lesion in black (B), and spectra from a rejected voxel (C). The position is shown in green in A.
Neurometabolite Analysis.
Neurometabolites were analyzed in the following 2 ways:
Estimated metabolite concentrations: The mean metabolite concentrations (tNAA, mIns, Glx, tCho) of all voxels that passed the automatic and visual quality assurance (clean data) were averaged for each participant to calculate a per-patient estimated metabolite concentration reported in institutional units.
Metabolite ratios: Mean neurometabolite ratios (tNAA, mIns, Glx, tCho) to tCr were calculated from the clean data for each participant.
Metabolite concentrations and ratios were then calculated in the following 2 tissue types: NAWM and GM.
To eliminate contamination by white matter lesions (WML) and CSF, we first removed any voxels containing >1% WML and >15% CSF. Linear regression models were used to explore the association between the concentration of each metabolite and the white or gray matter fraction on a voxel-by-voxel basis. These models were then extrapolated to find the value for each metabolite in which the GM or WM fraction was 100%, to find the metabolite concentration for each tissue type. Metabolite outliers were removed from the regression models, leaving us with per-patient metabolite values. This method has been previously described.32 Owing to the small lesion load in the acquired slice (average WML fraction in the SPMS cohort was 0.01), calculation of metabolite values in WML could not be completed.
Statistical Analyses
Neurometabolic data and distribution over the cohort were summarized descriptively. Statistical analysis was completed using R statistical and computing software (Version 3.5.1; http://www.r-project.org/).33 All P values were 2-tailed and reported using a .05 significance level.
Neurometabolite Correlations with Clinical Disability Measures
To examine the association between tissue-specific neurometabolites and clinical disability measures (EDSS, T25-FW, 9HPT, PASAT3, SDMT), we calculated Spearman rank correlation coefficients, given the non-normal distribution of the clinical disability measures. The scope of the analysis was to analyze the association between our key metabolites in NAWM and GM (tNAA, mIns, Glx, tCho, and their ratios to tCr) and the disability measures listed above. During correlation testing, 60 comparisons were prespecified, but here we report 80 after tCho and tCho/tCr were added following a post hoc request by a peer reviewer. These are reported in On-line Table 1. In reporting multiple analyses, we were guided by considerations outlined in Patel et al:34 Multiplicity adjustment is not required when a list of hypotheses of primary importance are prespecified; emphasis is placed on being explicit and transparent about the extent of multiplicity; and the magnitude of observed associations is interpreted in the context of the background literature.
When statistically significant correlations were found in the Spearman rank correlation analysis, a subsequent multivariable linear regression analysis was performed, adjusting for age, sex, disease-duration from onset, occurrence of relapses in the preceding 2 years, T2 lesion volume, and normalized brain volume. Model diagnostics undertaken to assess the regression model included the following: calculation of variance inflation factors to determine multicollinearity, the Cook’s distance to determine effect of leveraged data points, and plots of studentized residuals against adjusted predicted values to check residual homoscedasticity.
RESULTS
One hundred fifty-four participants gave consent for the Advanced MR Imaging substudy from January 2015 to June 2016. Of these 154 participants, 6 failed the CSI quality assurance, leaving 148 participants in the CSI arm of the Advanced MR Imaging substudy at baseline.
In total, there were 8361 CSI voxels for the analysis that passed both automatic and visual quality assurance; 3035 voxels remained after excluding voxels that contained >1% WML and >15% CSF (mean, 20.5 ± 9.2 voxels per patient). After calculating metabolite values and removing metabolic outliers, 119 participants with SPMS remained for analysis. Cohort demographics are provided for the cohort of 119 participants who underwent correlation testing and regression analysis; 81/119 (68%) were women and 108/119 (91%) had not experienced a relapse in the 2 years before randomization. Further details of the cohort are shown in Table 1.
Baseline demographics and characteristics (n = 119)
Estimated neurometabolite concentrations (in institutional units) and metabolite ratios to tCr can be found in the On-line Table 2.
Metabolite concentrations/ratios that showed statistically significant correlations to disability measures in NAWM and GM are shown in On-line Table 1.
Table 2 shows the results of the regression analysis for neurometabolites that were significantly associated with clinical disability measures after adjusting for covariates. Neurometabolites that showed a statistically significant association on the Spearman rank correlation but lost statistical significance after regression analysis are not shown in Table 2. In NAWM, associations were seen between tNAA/tCr and 9HPT (β = 0.19, P = .04); tNAA and tNAA/tCr and PASAT3 (β = 0.17, P = .04) (β = 0.19, P = .02), respectively; and mIns/tCr and PASAT3 (β = −0.22, P = .007). In GM, tCho was associated with PASAT3 (β = −0.17, P = .04).
Results from multiple regression analysis examining associations between neurometabolites and clinical disability measuresa
DISCUSSION
This is the largest reported cohort of individuals with SPMS undergoing 1H-MR spectroscopy. On-line Table 1 shows all of the correlations that were statistically significant indicated. These were then explored in a multiple regression analysis (Table 2). The results suggest a relationship in NAWM between tNAA (tNAA/tCr) and mIns/tCr and IPS performance (PASAT3) and between tNAA/tCr and upper limb function (9HPT). In GM, tCho was associated with IPS performance. While a number of other correlations were identified in the correlation analysis, no associations with EDSS or T25-FW were found in GM or NAWM after multiple regression analysis.
Relationships between Neurometabolites and Clinical Disability
Upper Limb Function.
Previous smaller studies examining tNAA or tNAA/tCr in NAWM in PMS have not demonstrated statistically significant associations between neuroaxonal integrity and upper limb function (Table 2).14,16 Our study suggests that as neuroaxonal integrity (and mitochondrial function) decreases, upper limb function, as reflected by 9HPT, also decreases. The association found between tNAA/tCr and 9HPT during the correlation analysis (On-line Table 1) and multiple regression is in the expected direction with decreased tNAA/tCr associated with decreased upper limb function (as reflected by the 9HPT). It remains of interest whether this association is reflective of regional changes in NAWM that affect specific tracts related to upper limb and hand function or more reflective of generalized changes throughout the NAWM. With the association being seen with 9HPT but not T25-FW, it may suggest that changes in neuroaxonal integrity and mitochondrial function in the brain play a more important role in upper limb dysfunction in the progressive stage of the disease. This could be further explained by the hypothesis that PMS is a length-dependent central axonopathy, whereby the legs are affected earlier due to greater susceptibility of spinal cord motor neurons and the greater reserve capacity of shorter neuronal pathways such as the upper limb earlier in progressive disease.35
Sastre-Garriga et al14 found an association between tNAA and 9HPT in cortical GM (r = −0.48, P = .03), and in this context, the correlation in this study of 0.22 (On-line Table 1) is lower, though our association was in NAWM rather than cortical GM. Our result contrasts with previous studies, but this contrast could be explained by the differences in cohort characteristics, whereby Sastre-Garriga et al examined 43 predominantly male participants with early PPMS with a lower median EDSS of 4.5 and Obert et al16 analyzed 15 participants with SPMS with a median EDSS score of 4.5.14
Information Processing Speed.
The aforementioned study by Obert et al examined measures of IPS (PASAT3) and its relationship to in vivo neurometabolites in NAWM in SPMS (n = 15). This study did not show any associations.16 Several other studies reported results in the form of standardized scores such as multiple sclerosis functional composite or the Brief Repeatable Battery Neuropsychological Tests, making it difficult to discern the true relationship between IPS and neurometabolites in PMS.13,14,18 First, our findings of an association between NAWM tNAA and tNAA/tCr with PASAT3 scores (On-line Table 1 and Table 2 and Fig 3) are in the expected direction, with decreased neuroaxonal integrity in NAWM associated with decreased performance on the PASAT3. We were unable to determine whether there was a predilection to a specific region of NAWM or whether it was possibly associated with altered functional or structural connectivity. Solana et al32 examined this issue in a mixed cohort of relapsing-remitting MS and SPMS, demonstrating that tNAA/tCr and mIns/tCr in WM were associated with abnormal efficiency in the frontoparietal network, with abnormalities in this network associated with impaired attention and processing speed (compared with healthy controls).

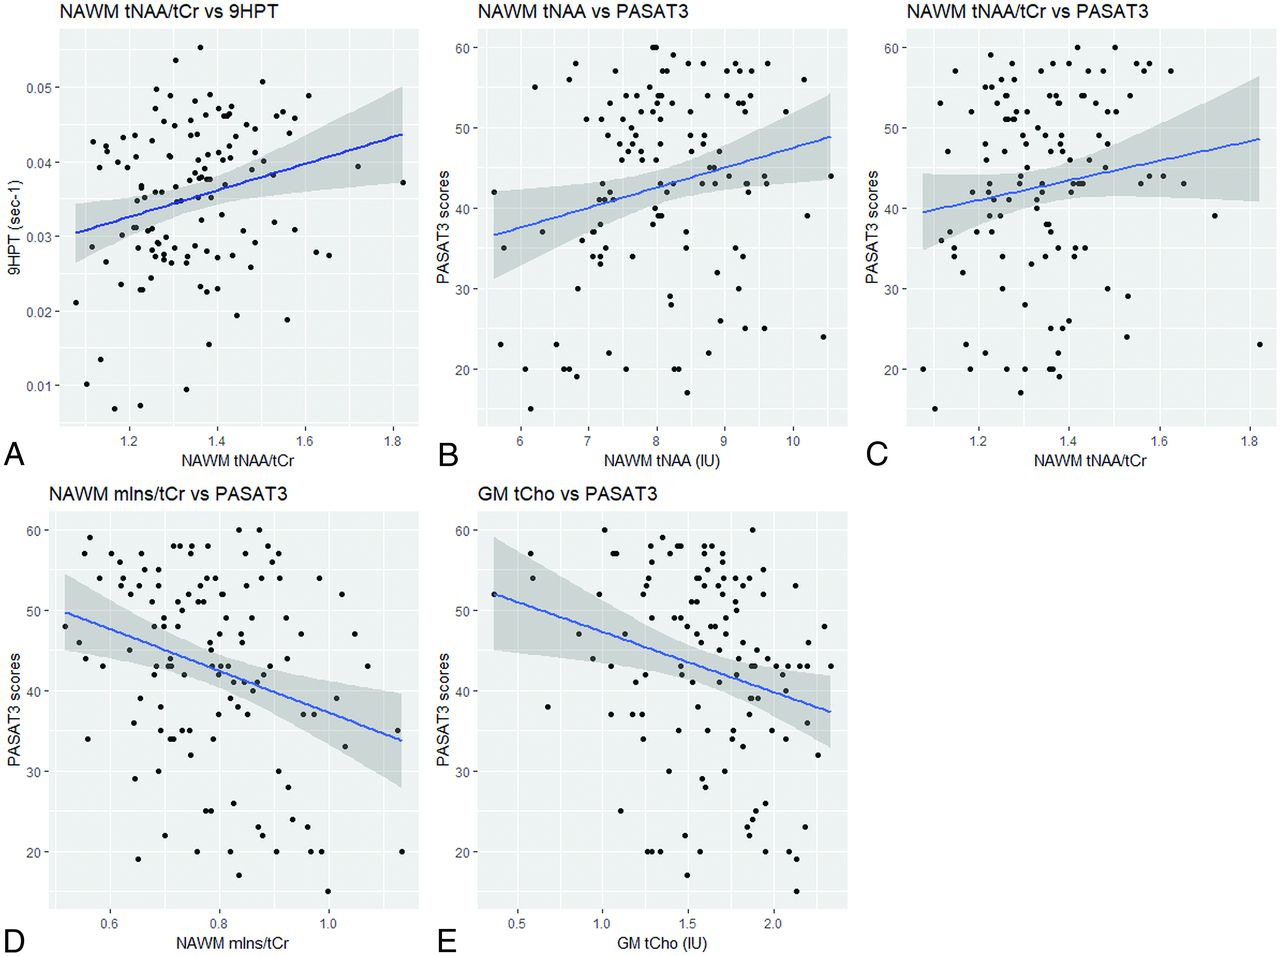
Associations between neurometabolites and clinical disability measures. The scatterplots with the line of best fit and 95% confidence intervals are shown for the associations in normal-appearing white matter among the following: A, tNAA/tCr and 9HPT (ρ = 0.23; 95% CI, 0.06–0.40). B, tNAA and Paced Auditory Serial Addition Test (ρ = 0.21; 95% CI, 0.03–0.38). C, tNAA/tCr and Paced Auditory Serial Addition Test (ρ = 0.19; 95% CI, 0.01–0.36). D, mIns/tCr and Paced Auditory Serial Addition Test (ρ = –0.23; 95% CI,–0.39 to −0.05) and in gray matter between tCho and Paced Auditory Serial Addition Test (ρ = –0.24; 95% CI, –0.40 to −0.06) (E).
Our findings differed from those of Obert et al,16 who used a similar 1H-MR spectroscopy acquisition to calculate tNAA and tNAA/tCr, but their SPMS cohort of 15 undergoing 1H-MR spectroscopy may not have had sufficient power to detect an association. Sex is also associated with IPS with women being associated with decreased PASAT3 scores compared with men, adjusting for the other covariates (Table 2). Neurometabolic differences between men and women in SPMS were examined by De Stefano et al,36 who did not find differences in NAA/Cr in NAWM. There was also no difference in tNAA or tNAA/tCr in NAWM between men and women in our SPMS cohort (Welch t test: P = .3, P = .7, respectively). Penny et al37 examined the longitudinal association between tNAA and IPS in PPMS and did not identify sex as being associated with 5-year measures of IPS. Their results, however, may differ because they studied a cohort of patients with PPMS who had a predominance of men and a lower baseline median EDSS score of 4.5. T2 lesion volume reflecting the inflammatory lesion burden was also associated with IPS and cognitive performance, findings that have been demonstrated before confirming the strong association between inflammatory lesion burden and clinical disability in PMS.18,37
We also found that mIns/tCr in NAWM had a negative association with PASAT3 scores (On-line Table 1 and Table 2). This relationship is in the expected direction, with increased astrogliosis (as reflected by higher mIns/tCr) associated with decreased performance on PASAT3. mIns values were not associated with tests of IPS, but the ratio between the 2 showed a weak negative association, which suggests that as the mIns/tCr ratio increases, PASAT3 scores decrease (Fig 3). This finding could be driven by either an increased mIns or a decreased tCr (tCr is more commonly used a reference metabolite) and reflective of increased astrogliosis in SPMS causing IPS dysfunction.
There was a correlation between tNAA in NAWM and the SDMT. However, this association was not significant after adjusting for covariates in the regression analysis. While both PASAT3 and SDMT measure IPS, PASAT3 involves verbal working memory compared with SDMT, which involves visuospatial memory, and this difference may explain the association between neuroaxonal integrity in NAWM and PASAT3, but not SDMT.38 A separate study comparing PASAT with SDMT using fMRI found that PASAT activated more frontal areas and the left inferior parietal lobe, suggesting that PASAT required more working memory capacity and executive function to execute compared with SDMT.39 However, studies in those with relapsing-remitting MS suggest a strong correlation between the PASAT3 and SDMT, with similar sensitivity and specificity between the 2 tests, so our lack of association with SDMT should be interpreted with caution.40
A previous study of choline levels in cortical GM did not show any difference between those with primary-progressive MS and healthy controls, nor was there any association with clinical disability measures.14 Our results suggest an association between GM tCho (a surrogate marker of membrane turnover) and IPS: As GM tCho levels increase, IPS performance (reflected by PASAT3 scores) decreases (On-line Table 1 and Table 2 and Fig 3). Phosphatidylcholine is one of the major choline-containing compounds within cell membranes, and there is evidence that this, along with its precursor molecule phosphocholine and the breakdown product glycerophosphocholine, is measured by the tCho peak in 1H-MR spectroscopy.41 In addition, the consistent finding of increased tCho (tCho/tCr) in active MS lesions suggests that tCho is a marker of membrane turnover.9 Recent findings have demonstrated that meningeal lymphoid follicles release proinflammatory molecules that can lead to cortical GM inflammation in SPMS, and our findings may support this finding, with a surrogate marker of increased membrane turnover in cortical GM being associated with IPS.42,43 However, this association should be interpreted with caution because tCho was not associated with other measures of clinical disability. Our findings may have differed from those in the previous study because Sastre-Garriga et al14 examined a cohort of 41 participants with early and lower disability (median EDSS score = 4.5; mean disease duration = 3.31 years).
Previous studies exploring the relationship between brain neurometabolites and measures of IPS in PMS did not report the correlation coefficients, making it difficult to place our results from this study in the context of previously reported results.14,16,18,44 Examining the associations in these studies between metabolites and other clinical disability measures (eg, EDSS) would suggest that the size of our correlations (On-line Table 1) is generally in keeping with previously reported work.14,16
There were statistically significant correlations in GM between mIns and PASAT3 scores, mIns/tCr and SDMT scores, and mIns/tCr and T25-FW (On-line Table 1), however these were not significant in the regression analysis after adjusting for other covariates and were generally in keeping with previous studies that have examined associations between cortical GM metabolites and clinical disability measures such as EDSS and the Brief Repeatable Battery Neuropsychological Tests in SPMS cohorts.13,45⇓-47 A single study found that tNAA was decreased in cortical GM compared with controls and tNAA in cortical GM showed a moderate association with EDSS and 9HPT, but this was in early PPMS.14 When calculating GM metabolites, several studies used careful placement of the VOI using single-voxel spectroscopy,13,46 while the remaining studies used CSI followed by automated or manual tissue segmentation.45,47 These differing techniques reflect the technical challenges in GM metabolite calculation in which the partial volume effect can result in contamination of the VOI or leave insufficient pure GM voxels. The other issue is that previous studies have reported clinical measures that reflect general disability or composite scores (eg, EDSS and Brief Repeatable Battery Neuropsychological Tests), making it difficult to determine associations with specific functional measures such as upper limb function or ambulation. We attempted to address these issues using CSI followed by segmentation, then using a regression method to calculate GM metabolite values, and then examining these associations with specific functional measures of clinical disability.
Measures of Ambulation and General Disability
While there were several associations seen between metabolites and T25-FW and EDSS (On-line Table 1), after multiple regression analysis, we did not find any significant associations between the T25-FW performance or the EDSS score and any neurometabolite levels. Previous studies examining SPMS cohorts have shown relationships between total choline and EDSS in NAWM and tNAA/Cr in cortical GM and EDSS in a cohort of PPMS (n = 15).16 The lack of association between metabolites and the EDSS could be due to the limited distribution of scores in the cohort in which 106/148 had an EDSS score of 6.0–6.5, compounded by the ceiling effect and nonlinear characteristics of the EDSS.35 EDSS scores, particularly between 4.0–6.5, are defined by ambulatory distance, and there is a moderate-to-strong correlation between the T25-FW and EDSS;48 or there is no relationship to be found.
There were statistically significant correlations between GM Glx (Glx/tCr) and EDSS and with T25-FW (On-line Table 1), but after multiple regression analysis, we did not find any significant relationships between Glx or Glx/tCr and measures of clinical disability. Glutaminergic excitotoxicity has been shown to be involved in the pathogenesis of PMS.4 When glutamate values were measured separate from glutamine using a TE-averaged MR spectroscopic imaging technique, glutamate was associated with a decline in neuroaxonal integrity in a mixed cohort of MS (number of PMS = 31/343).49 We measured Glx (glutamine + glutamate) due to the difficulty in resolving glutamate from its precursor glutamine at 3T. It also seems unlikely that we can measure glutaminergic excitotoxicity directly because most Glx signal arises from the intracellular compartment and thereby is more likely to reflect neuroaxonal integrity.
Methodologic and Analytic Considerations
The demographics and characteristics (n = 119) of the cohort analyzed in this study were consistent with those reported from the main MS-SMART study (n = 445).20 The placement of the CSI grid above the ventricles was designed to limit the effect of ventricles from which there is no metabolite signal, decrease the partial volume effect, and ensure consistency of shimming across the CSI slice. The predilection of WML to periventricular regions led to voxels containing predominantly WM and GM, which meant we were unable to obtain metabolite values from WML. When determining metabolite values for NAWM and GM, we attempted to limit contamination by WML and CSF by excluding voxels that contained 1% WML and 15% CSF. These parameters kept the best balance between the loss of CSI voxels while minimizing WML and CSF contamination of voxels used in NAWM and GM calculations. During the calculation of metabolite values in NAWM and GM, 29 participants were excluded as metabolite outliers. No formal statistical comparison was undertaken, but the characteristics of these 29 participants were generally similar to those in the cohort that underwent analysis (n = 119), except to note that the median T2 lesion volume was higher in the excluded group (15.6 versus 9.7 mL). While we outline a rationale for dealing with multiple comparisons, some caution is advised during interpretation of the associations due to the multiple comparisons being undertaken. Owing to technical difficulties in GM lesion detection, GM lesions were not segmented, and this feature should be acknowledged when interpreting metabolite values and results pertaining to GM.
The neurometabolite ratios to tCr need careful interpretation because tCr is also affected by neuropathology.11 There are, however, benefits to using tCr as a stable reference because it removes the need to adjust for head-coil loading and T1 and T2 effects.9 Estimated concentrations are reported using a water reference for scaling, which can be used to produce absolute concentrations; this process, in turn, carries assumptions within LCModel about the water content of tissue, which is based on reports from healthy volunteers.31 Given this assumption and the fact that at TR = 2000 ms, T1 effects may still be present, we chose to present an estimated (rather than absolute) concentration in institutional units. The use of estimated concentrations allows the possibility that errors between the LCmodel “absolute” concentrations and the true metabolite concentrations may be present.
CONCLUSIONS
After multiple regression analysis, tNAA, tNAA/tCr, and mIns/tCr in NAWM and tCho in GM are associated with clinical disability in upper limb function and information processing speed. These metabolites are therefore of interest as surrogate markers of brain injury in SPMS.
Acknowledgments
The authors would like to thank all the participants of the MS-SMART trial and all the collaborators involved in the trial, particularly, Tiggy Beyene, Vanessa Bassan, Marios Yiannakis, Almudena Garcia Gomez, Alvin Zapata, Rebecca Samson, Alberto Calvi, and Marcello Moccia.
Footnotes
Bhavana S. Solanky and Nevin A. John are joint first authors and contributed equally to this work.
This work was funded by the Efficacy and Mechanism Evaluation program as project number 11/30/11. MS-SMART is an investigator-led project sponsored by University College London. This independent research is awarded by and funded by the Medical Research Council, the UK MS Society, and the National MS Society and is managed by the National Institute for Health Research on behalf of the Medical Research Council–National Institute for Health partnership. Additional support comes from the University of Edinburgh; the National Institute for Health Research University College London Hospitals Biomedical Research Center and University College London; and the National Institute for Health Research Leeds Clinical Research Facility (Dental Translational and Clinical Research Unit).
C.J.W. and R.A.P. were supported in this work by National Health Service Lothian via the Edinburgh Clinical Trials Unit.
Disclosures: Bhavana S. Solanky—RELATED: Grant: Efficacy and Mechanism Evaluation, Comments: funding reference number 11/30/11*; UNRELATED: Employment: University College London; Grants/Grants Pending: Wings for Life.* Nevin A. John—RELATED: Grant: Efficacy and Mechanism Evaluation, Comments: funding reference number 11/30/11.* Jonathan Stutters—RELATED: Grant: Efficacy and Mechanism Evaluation, Comments: funding reference number 11/30/11.* Ferran Prados—RELATED: Grant: Guarantors of Brain, Comments: nonclinical Guarantors of Brain fellowship; UNRELATED: Employment: University College London. Torben Schneider—UNRELATED: Employment: employee at Philips Healthcare, Comments: During the time of the study, I was employed by Philips Healthcare; Patents (Planned, Pending or Issued): patents with Philips Healthcare. Richard A. Parker—RELATED: Grant: Efficacy and Mechanism Evaluation, Comments: funding reference number 11/30/11.* Other: National Health Service Lothian, Comments: support for the salary of Dr Parker via the Edinburgh Clinical Trials Unit.* Christopher J. Weir—RELATED: Grant: Efficacy and Mechanism Evaluation, Comments: funding reference number 11/30/11*; Other: National Health Service Lothian, Comments: support for the salary of Professor Weir via the Edinburgh Clinical Trials Unit.* Anita Monteverdi—RELATED: Grant: Efficacy and Mechanism Evaluation, Comments: funding reference number 11/30/11.* Anisha Doshi—RELATED: Grant: Efficacy and Mechanism Evaluation, Comments: funding reference number 11/30/11*; UNRELATED: Employment: Queen Square MS Center Institute for Neurology. David MacManus—RELATED: Grant: Efficacy and Mechanism Evaluation, Comments: funding reference number 11/30/11.* Frederik Barkhof—UNRELATED: Board Membership: Roche, Biogen, Bayer AG, Merck, Comments: Steering committee and Independent data monitoring committee membership; Consultancy: IXICO; Grants/Grants Pending: European Union–Internal Market Information System.* Jeremy Chataway—RELATED: Grant: Efficacy and Mechanism Evaluation Program and Health Technology Assessment Program (National Institute for Health Research); UK Multiple Sclerosis Society and National Multiple Sclerosis Society; National Institute for Health Research University College London Hospitals Biomedical Research Center, Comments: funding reference number 11/30/11*; UNRELATED: Consultancy: Azadyne, Biogen, Celgene, MedDay Pharma, Merck, and Roche; Grants/Grants Pending: Novartis, Comments: investigator grant from Novartis*; Other: a local Principal Investigator for commercial trials funded by Actelion, Biogen, Novartis, and Roche.* Ian Marshall—RELATED: Grant: Efficacy and Mechanism Evaluation, Comments: funding reference number 11/30/11.* Claudia A.M. Gandini Wheeler-Kingshott—RELATED: Grant: Efficacy and Mechanism Evaluation program, Comments: funding reference number 11/30/11*; UNRELATED: Grants/Grants Pending: MS Society, Wings for Life, International Spinal Research Trust, Craig H. Neilsen Foundation, Horizon2020*; Royalties: Elsevier. *Money paid to the institution.
Indicates open access to non-subscribers at www.ajnr.org
References
- Received June 3, 2020.
- Accepted after revision July 24, 2020.
- © 2020 by American Journal of Neuroradiology


Jump to section
Related Articles
Cited By...
- UPDATE trial: investigating the effects of ultra-processed versus minimally processed diets following UK dietary guidance on health outcomes: a protocol for an 8-week community-based cross-over randomised controlled trial in people with overweight or obesity, followed by a 6-month behavioural intervention
- ORYX-MRSI: A Fully-Automated Open-Source Software for Three-Dimensional Proton Magnetic Resonance Spectroscopic Imaging Data Analysis
- A systematic review of resting state functional MRI connectivity changes and cognitive impairment in multiple sclerosis