
Abstract
BACKGROUND AND PURPOSE: 4D CT angiography is increasingly used in clinical practice for the assessment of different neurovascular disorders. Optimized processing of 4D-CTA is crucial for diagnostic interpretation because of the large amount of data that is generated. A color-mapping method for 4D-CTA is presented for improved and enhanced visualization of the cerebral vasculature hemodynamics. This method was applied to detect cranial AVFs.
MATERIALS AND METHODS: All patients who underwent both 4D-CTA and DSA in our hospital from 2011 to 2018 for the clinical suspicion of a cranial AVF or carotid cavernous fistula were retrospectively collected. Temporal information in the cerebral vasculature was visualized using a patient-specific color scale. All color-maps were evaluated by 3 observers for the presence or absence of an AVF or carotid cavernous fistula. The presence or absence of cortical venous reflux was evaluated as a secondary outcome measure.
RESULTS: In total, 31 patients were included, 21 patients with and 10 without an AVF. Arterialization of venous structures in AVFs was accurately visualized using color-mapping. There was high sensitivity (86%–100%) and moderate-to-high specificity (70%–100%) for the detection of AVFs on color-mapping 4D-CTA, even without the availability of dynamic subtraction rendering. The diagnostic performance of the 3 observers in the detection of cortical venous reflux was variable (sensitivity, 43%–88%; specificity, 60%–80%).
CONCLUSIONS: Arterialization of venous structures can be visualized using color-mapping of 4D-CTA and proves to be accurate for the detection of cranial AVFs. This finding makes color-mapping a promising visualization technique for assessing temporal hemodynamics in 4D-CTA.
ABBREVIATIONS:
- CCF
- carotid cavernous fistula
- TTS
- time-to-signal
Four-dimensional CT angiography (4D-CTA) is increasingly used in clinical practice for the assessment of different neurovascular disorders as a noninvasive alternative to invasive DSA.1 Multiple acquisitions over time enable visualization of the cerebral vasculature hemodynamics. Dynamic acquisition during the passage of a contrast bolus enables accurate detection of arterial-venous shunting, seen as abnormal early contrast enhancement of a dural sinus or cortical vein, due to an AVM or AVF.2⇓⇓–5 The main arterial feeders of AVFs can be identified, and the pathway of venous drainage can be estimated. Compared with DSA, 4D-CTA is less time-consuming, less expensive, and has a lower risk of complications.6,7 In addition, 4D-CTA is less sensitive to the timing of the acquisition relative to the contrast bolus injection as opposed to static, single-phase CTA.
The high spatial and temporal resolution of 4D-CTA yields large amounts of data, resulting in a laborious and time-consuming diagnostic evaluation and hampers direct interpretation, even for experienced observers. The challenge of 4D-CTA lies in comprehensively and accurately visualizing the essential parts of the imaging data. For example, in the diagnostic work-up of cranial arteriovenous shunts, a continuous 4D-CTA acquisition with high temporal and spatial resolution is crucial, and hemodynamics is evaluated by creating dynamic CTA subtraction images. The evaluation of dynamic CTA requires an accurate evaluation of multiple individual time points for the detection of arterialized venous structures. In a more sophisticated approach for evaluating the vascular morphology on 4D-CTA, the whole 4D dataset can be condensed into a 3D dataset using a temporal maximum intensity projection.8 However, this projection has the disadvantage of temporal information being lost.
In this work, a visualization technique for 4D-CTA is proposed that is based on mapping the contrast bolus arrival times in the cerebral vasculature to a color scale. A flow window is adjusted specifically for each patient on the basis of the aggregated temporal information. The method retains temporal (4D) information in a 3D reconstruction. The 4D-CTA color-mapping method was evaluated in an observer study for the detection of cranial AVFs.
Materials and Methods
Study Design and Study Population
All patients older than 18 years of age who underwent both 4D-CTA and DSA in our hospital (Radboud University Medical Hospital, Nijmegen) from 2011 to 2018 for the clinical suspicion of a cranial AVF or carotid cavernous fistula (CCF) were retrospectively collected. Patients with a proved AVM (ie, the presence of an intervening nidus) were excluded. The study was approved by the medical ethical committee of our hospital, and informed consent was waived because of the retrospective collection of the study data. The study was conducted in accordance with the ethical standards of the 1964 Declaration of Helsinki and its later amendments.
Data Acquisition
All patients underwent whole-brain 4D-CTA on a 320–detector-row Aquilion ONE CT scanner (Canon Medical Systems, Tokyo, Japan). The 4D-CTA scanning protocol consisted of a 10- to 12-second continuous acquisition (80 kV, 115 mAs, 0.5-second rotation speed) reconstructed at a temporal resolution of 1 volume per second. A 50-mL contrast agent bolus of iomeprol (300 mg iodine/mL, Iomeron; Bracco, Milan, Italy) was intravenously injected. A test bolus of 15 mL of contrast agent was used for the timing of the acquisition. Image reconstruction was performed with a smooth reconstruction kernel (FC41), resulting in an image matrix of 512 × 512 with voxel sizes of 0.43 × 0.43 × 0.5 mm. The estimated mean radiation dose for the 4D-CTA examinations was 6.6 mSv (dose-length product, 3176; k-factor, 0.0021).
Color-Mapping
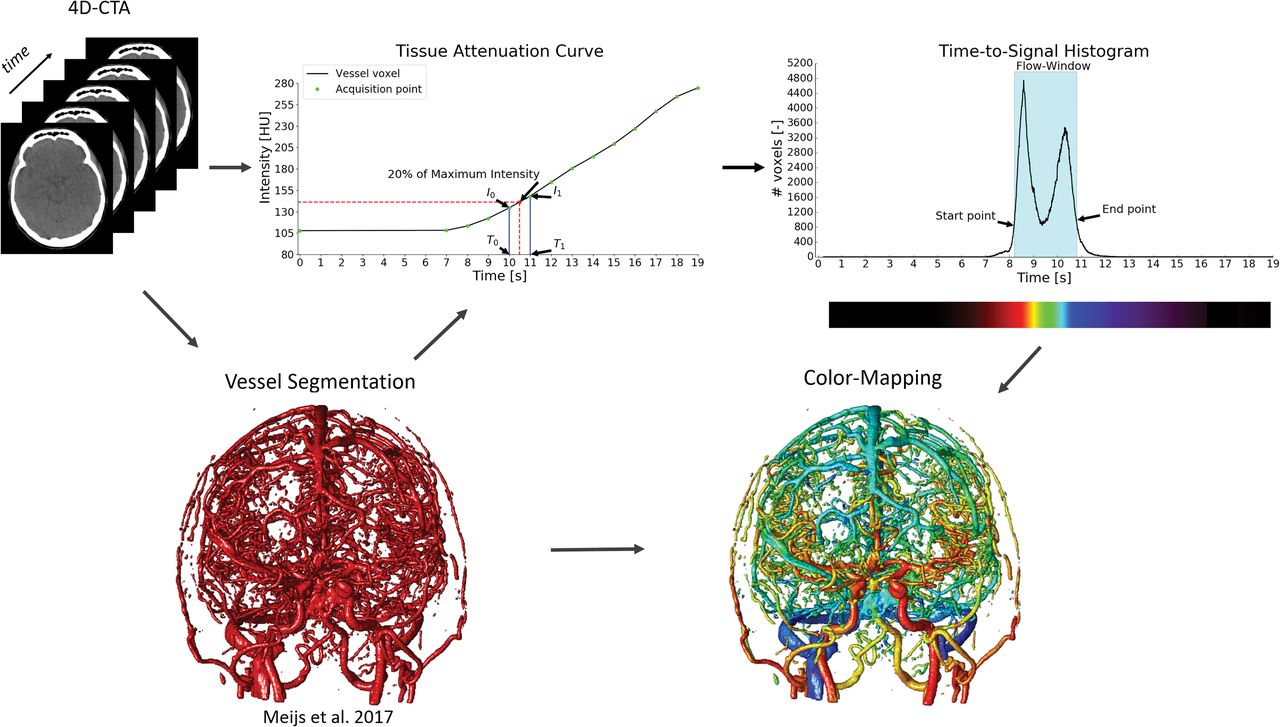
The color-mapping visualization of 4D-CTA consists of 4 steps (Fig 1). First, the vessels are segmented using a random forest classifier using a weighted temporal average and variance as the main image features.9 The second step is calculation of the contrast bolus arrival times in the segmented vessels. Gaussian blurring is applied in the temporal direction with σ = 3 seconds to reduce noise while maintaining spatial resolution. The tissue attenuation curve per voxel describes contrast changes over time in Hounsfield units (HU). For each vessel voxel, a point on this curve is searched where the attenuation reaches a fraction, α, of the maximum signal intensity, corrected for the baseline intensity:
 Here, Imin and Imax are the minimum and maximum intensity in the temporal direction for the current voxel. Depending on the application, α may range from 0 to 1, where 1 resulted in the temporal maximum intensity projection and the time-to-peak. In our method, the parameter, α, was set to 0.2 for optimal evaluation of contrast bolus arrival times. The TTS is linearly interpolated using IThreshold and the known acquisition time points as follows:
 With
With
 Here, T0, T1, I0, and I1 are the acquisition time points and intensity values around IThreshold, respectively, as shown in the profile intensity curve plot in Fig 1. In the next step, all TTS values of the vessels are aggregated in a histogram that is used to determine a flow window for each patient specifically. The start and end of the flow window are defined as the first and last time points that reach 20% of the maximum peak in the histogram, as illustrated by the TTS histogram in Fig 1. In the final step of the method, a color scale is adjusted around the flow window and overlaid on the vessel segmentation to visualize the arrival times and thus the flow dynamics in the cerebral vasculature.

Overview of the proposed method. First, the vessels are segmented in the 4D-CTA acquisitions. Second, time-to-signal is calculated per vessel voxel in the segmentation. Third, the TTS values are aggregated in a histogram, and the start and end of the flow window are determined. Last, a color scale is mapped to the flow window, and the colors are overlaid on the vessel segmentation.
Diagnostic Evaluation
Three observers, 2 neuroradiologists (F.J.A.M., S.A.H.P.) and a neurosurgeon (H.D.B.) with various levels of experience in reading 4D-CTA, evaluated the color-mapping visualization datasets. The cases were presented to the observers in a random order, and the observers were blinded to clinical symptoms, DSA, and patient outcome. Initially, only color-mapping processing of 4D-CTA as an overlay on temporal average images of the 4D-CTA was presented to the observers (method 1). In a second step, dynamic subtraction rendering of 4D-CTA was available in addition to color-mapping (method 2).
The primary outcome measure was the detection of cranial AVFs. In case an AVF or CCF was identified, the location, dominant arterial feeders, and the pattern of venous drainage were assessed. The secondary outcome measure was the presence or absence of cortical venous reflux, which is of relevance for grading the dural AVF and for treatment decision-making.10 The CCFs were graded as either direct type (originating from the internal carotid artery) or indirect type (branches of the external carotid artery serving as arterial feeders).
Reference Standard and Statistical Analysis
DSA was performed in the clinical diagnostic work-up of all cases, was independently evaluated by neurovascular interventionalists, and served as the reference standard for the primary and secondary outcome measures. Measures of diagnostic accuracy for the detection of AVFs on 4D-CTA color-mapping were calculated per observer. Fleiss κ statistics11 was used for assessing agreement for AVF detection among the 3 observers. The Krippendorff statistical test12 was used for evaluating interobserver agreement on cortical venous reflux (taking possible missing data points into account). SPSS Statistics (Version 25; IBM, Armonk, New York) and Python 3.6 were used for data management and data analyses.
Results
Study Population
A total of 34 patients were included, of whom 3 were excluded due to failure of the vessel segmentation. The failure was the result of heavy distortion due to metal artifacts and poor contrast opacification of the vasculature. The remaining study population consisted of 31 patients, 21 with and 10 without a cranial AVF. The group of AVFs consisted of 18 dural AVFs and 3 CCFs. An overview of the study population demographics and AVF characteristics is provided in Table 1.
Patient demographics and characteristics of the AVFs
Diagnostic Accuracy
The results of the color-mapping evaluation of 4D-CTA per observer are provided in Table 2. Overall, there was high sensitivity (86%–100%) and moderate-to-high specificity (70%–100%) for the detection of cranial AVFs on color-mapping 4D-CTA. For observer 1, two cases were rated false-negative on 4D-CTA color-mapping, of which 1 (a CCF) was detected with additional dynamic subtraction rendering. All AVFs were correctly identified on 4D-CTA color-mapping by observer 2, even before the availability of dynamic subtraction rendering. For observer 3, three cases were read as false-negative and 3 cases were read as false-positive. For observers 2 and 3, there were no changes in the reading before and after the availability of dynamic subtraction rendering. In all cases with a true-positive evaluation of 4D-CTA, there was full agreement with DSA for the location of the AVFs for all observers. The interobserver agreement for the detection of cranial AVFs was substantial (0.619 for method 1 and 0.661 for method 2).
Diagnostic accuracy of the 3 observers for the detection of cranial AVFs (n = 31), with DSA serving as the reference standarda
The diagnostic performance in the detection of cortical venous reflux was highly variable among the observers (Table 3), ranging from low-to-high sensitivity (43%–88%) and moderate specificity (60%–80%) for both methods. Only for observer 3 was there a slight increase in sensitivity with the availability of dynamic subtraction rendering because cortical venous reflux was correctly identified in 1 additional case (initial false-negative reading on color-mapping). Regarding the 3 cases with a CCF included in the evaluation, 1 case with an indirect type of CCF was, as mentioned, initially missed on color-mapping by observer 1 but was detected with the availability of dynamic subtraction rendering. This case was detected by observers 2 and 3 but was misclassified as a direct type by observer 2 and could not be classified by observer 3. The interobserver agreement for the detection of cortical venous reflux was fair (0.294 for method 1 and 0.372 for method 2).
Diagnostic accuracy for the detection of cortical venous reflux on 4D-CTA for the correctly identified AVFs by the 3 observers, with DSA serving as the reference standarda
Discussion
We have presented a visualization technique to represent temporal information of the cerebral vasculature in a 4D-CTA acquisition, enabling accurate detection and enhanced visualization of cranial AVFs. The visualization of contrast bolus arrival times using a color scale enables temporal information (4D) to be assessed on a 3D volume without losing information. The 3 observers were able to accurately detect and localize the AVFs using 4D-CTA color-mapping, even without the availability of dynamic subtraction rendering. The difference in the diagnostic performance among the observers is most likely related to the level of experience in reading 4D-CTA studies and is a reflection of clinical practice. Examples of AVFs in different locations as detected on 4D-CTA color-mapping are provided in Figs 2⇓–4.

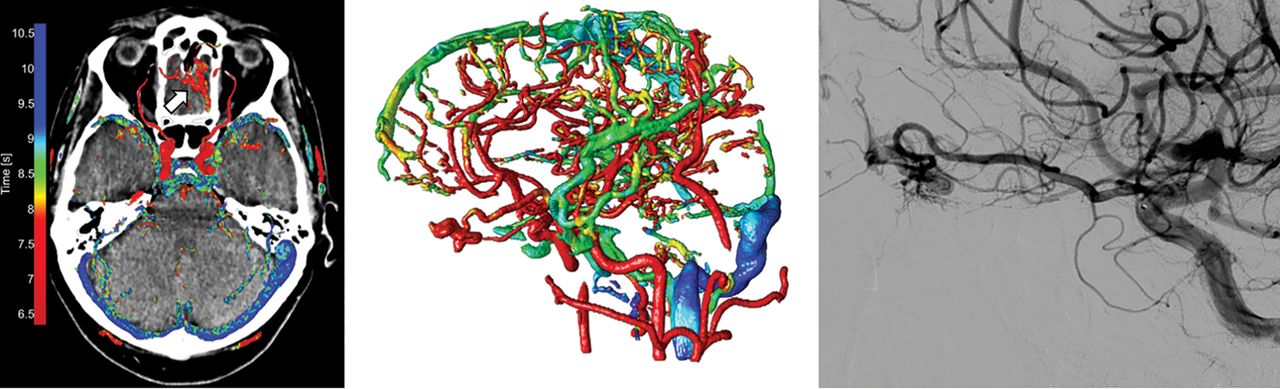
Left image, 4D-CTA color-mapping in a patient with a dural AVF located in the left sigmoid sinus. Early contrast bolus arrival and arterialization of the left sigmoid sinus are depicted in red (large arrow). Middle image, 3D rendering of color-mapping. Right image, conventional angiography. Note the occipital artery branches serving as arterial feeders (small arrows) with anterograde venous drainage in the jugular vein.

Left image, 4D-CTA color-mapping in a patient with a small dural AVF located at the left anterior skull base. Middle image, 3D rendering of color-mapping. Right image, conventional angiography. Early contrast bolus arrival of the AVF is seen as a prominent red (arrow). The ophthalmic artery with ethmoidal branches serving as the arterial feeder and arterialization of a tortuous cortical draining vein are clearly seen.

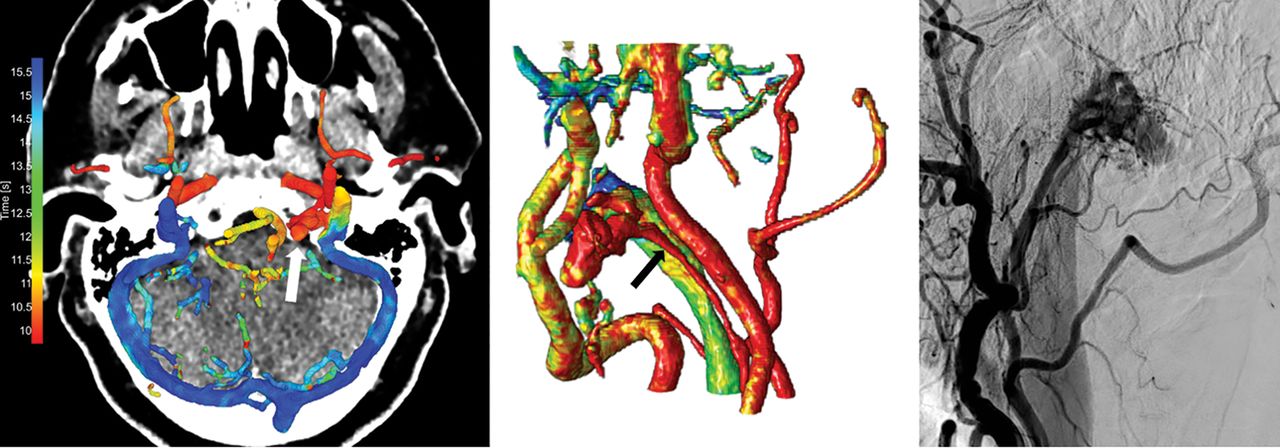
Left image, 4D-CTA color-mapping of 4D-CTA in a patient with a dural AVF located in the left condylar venous plexus (white arrow). Middle image, 3D rendering of the color-mapping. Right image, conventional angiography. The ascending pharyngeal artery serves as the feeding artery (black arrow), and venous drainage is into the green jugular vein.
The detection of cortical venous reflux on 4D-CTA color-mapping, with the availability of dynamic subtraction rendering, proved challenging. The performance in the detection of cortical venous reflux was probably also related to the observers' experience in reading 4D-CTA because observers 1 and 2 were considerably more experienced in reading 4D-CTA than observer 3. Cortical venous reflux can be depicted on 4D-CTA, as has been reported previously1,13, but there were discrepancies with DSA in a considerable number of cases. Although our study population was scanned with a continuous 4D-CTA volume acquisition, the temporal resolution was set at 1 volume per second based on which color-mapping was applied. A higher temporal resolution would enable targeted color-mapping in a more specific timeframe during the acquisition, which could improve the evaluation of cortical venous reflux.
The cerebral vessel segmentation is an important part of the presented method. It allows the arrival times to be extracted directly from the vascular system, and it reduces the large amount of 4D-CTA data to the essential parts needed for the diagnostic evaluation and visualization of the cerebral vasculature hemodynamics. The accuracy of the color-mapping method is therefore strongly dependent on the quality of the vessel segmentation, which is especially challenging for small-caliber arteries and veins. When combined with vessel labeling, this method could serve as a base for automated detection of AVFs.
Three patients were excluded due to failed color-mapping, which resulted from insufficient vessel segmentation. Although only 3 patients were excluded, it is a relatively large percentage of the small dataset. The vessel segmentation algorithm was primarily developed for a discontinuous 4D-CTA scanning protocol used in acute ischemic stroke.9 This feature may cause the vessel-segmentation algorithm to be less equipped to handle image artifacts and suboptimal contrast opacification of the vasculature. A vessel segmentation algorithm optimized for a continuous 4D-CTA scanning protocol might result in a decreased failure rate of the vessel segmentations.
The α factor in the TTS calculation of the presented method defines the threshold for the contrast bolus arrival time in the cerebral vasculature and determines the final visualization. A low α factor is more suited to a detailed distinction in early contrast-arrival times, making it more sensitive for the detection of arterialized venous structures (ie, arteriovenous shunts). In other pathologies such as ischemic stroke, a higher α factor resembles the time-to-peak, which is beneficial for the evaluation of the collateral vessel status, which is an important independent predictor of patient outcome.14 Preliminary results already showed that the temporal dynamics of collateral flow in the circle of Willis can be depicted in patients with a unilateral carotid artery occlusion using the presented method.15 It is expected that color-mapping could also be beneficial for 4D-CTA evaluation of vascular malformations in other organ systems or in the evaluation of cardiovascular pathology. The visualization of arrival times using a color scale has been suggested before in 2D-DSA16⇓–18 and in 4D-CTA,19,20 but none of these methods are adjusted for each patient individually independent from the cerebral blood flow, heart rate, and cardiac output function. The application of a histogram to normalize the arrival times for each patient individually is a novel approach that allows an automatic visualization and comparison among patients with different contrast bolus arrival times. The 20% threshold on the TTS histogram was chosen to ensure the detection of the contrast bolus arrival at a reasonable signal-to-noise ratio. Relevant arrival times in other parts of the vasculature that might be outside the flow window are still visualized as the flow-window servers as anchor points the color scale and no arrival times are masked out.
Our study has some limitations. First, our study population was collected retrospectively with the risk of selection bias. Our findings therefore need validation in a prospective cohort study. Second, dynamic subtraction rendering of 4D-CTA was not independently evaluated from color-mapping because we chose to evaluate color-mapping in a manner similar to that applied in clinical practice in which both color-mapping and dynamic subtraction rendering are available. Our goal was not to repeal dynamic subtraction rendering of 4D-CTA but to provide color-mapping as an initial evaluation tool of 4D-CTA, enabling accurate detection of an AVF, with dynamic subtraction rendering available for further detailed analysis. However, a direct comparison is of added value, which can be evaluated in a future prospective study. Third, the role of 4D-CTA in the diagnostic work-up of AVFs is still under debate, and a direct comparison of the diagnostic accuracy of 4D-CTA with DSA or time-resolved MR angiography is lacking. MR angiography is preferable to 4D-CTA because the patient is not exposed to radiation. On the contrary, 4D-CTA is preferable to dynamic MR angiography because 4D-CTA is much less limited by the trade-off between temporal and spatial resolution.21 In addition, the radiation dose of 4D-CTA is currently considerably reduced by advanced noise filtering and registration techniques, though this reduction still strongly depends on the exact scanning protocol. Last, we did not include subjects with intracranial AVMs in our cohort to have a more homogeneous study population. It is expected that AVMs can also be detected with high accuracy using 4D-CTA color-mapping because an AVM is also characterized by AV shunting. Nevertheless, a follow-up study is needed to validate this assumption.
Conclusions
Arterialization of venous structures is visualized by color-mapping of 4D-CTA and proves to be accurate for the detection of cranial AVFs. This finding makes color-mapping a promising visualization technique for 4D-CTA.
Footnotes
Disclosures: Midas Meijs—RELATED: Grant: Dutch Research Council (Dutch Technology Foundation).* Kazuhiro Murayama—RELATED: Support for Travel to Meetings for the Study or Other Purposes: Canon Medical Systems*; UNRELATED: Comments: Grant-in-Aid for Scientific Research.* Frederick J.A. Meijer—UNRELATED: Board Membership: Editorial Board of Neuroradiology; Patents (Planned, Pending or Issued): color-mapping algorithm. Mathias Prokop—UNRELATED: Grants/Grants Pending: Canon Medical Systems, Siemens*; Payment for Lectures Including Service on Speakers Bureaus: Bracco, Bayer, Canon Medical Systems, Siemens.* *Money paid to institution.
This work was supported by funding from Canon Medical Systems, Japan, and the Nederlandse Organisatie voor Wetenschappelijk Onderzoek.
Indicates open access to non-subscribers at www.ajnr.org
REFERENCES
- Received September 18, 2018.
- Accepted after revision June 25, 2019.
- © 2019 by American Journal of Neuroradiology


