
Abstract
SUMMARY: We developed a robust automated algorithm called statistical detection of changes for detecting morphologic changes of multiple sclerosis lesions between 2 T2-weighted FLAIR brain images. Results from 30 patients showed that statistical detection of changes achieved significantly higher sensitivity and specificity (0.964, 95% CI, 0.823–0.994; 0.691, 95% CI, 0.612–0.761) than with the lesion-prediction algorithm (0.614, 95% CI, 0.410–0.784; 0.281, 95% CI, 0.228–0.314), while resulting in a 49% reduction in human review time (P = .007).
ABBREVIATIONS:
- LPA
- lesion prediction algorithm
- SDC
- statistical detection of changes
Patients with multiple sclerosis undergo regular MRIs to monitor disease activity and therapeutic response.1 Volumetric brain MR imaging protocols with 1-mm3 isotropic resolution have become increasingly common for imaging patients with MS but result in hundreds of images, making detection of new lesions or changes in lesion morphology very time-consuming for radiologists. One approach to overcoming this problem is to extract lesion masks with a lesion-segmentation algorithm2; these masks are subtracted to yield a lesion-change mask. Alternatively, lesion change can be detected on the subtraction of 2 images either by humans3 or with the help of an algorithm relying on the subtraction signal and lesion geometry.4 While image subtraction can substantially improve lesion contrast, separating lesion change from background noise requires consideration of the statistical properties of the signal and noise.
Here we propose a rapid and robust algorithm for statistical detection of changes (SDC) in WM lesions. We describe a specific SDC implementation using the Neyman-Pearson detector in statistics to optimally detect lesion change according to the MR imaging signal-to-noise property.
Materials and Methods
SDC Lesion-Detection Algorithm
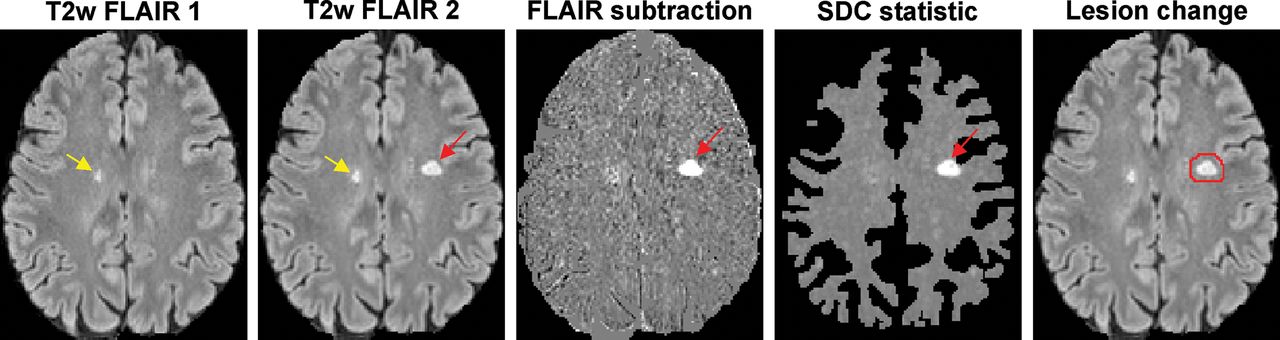
Given 2 MR images I1 and I2 of the same brain acquired at 2 time points, the voxel-subtraction signal d = I2 − I1 (Fig 1) is assumed to follow a Gaussian distribution N(μ, σ2) with mean μ and SD σ, in which σ can be estimated from the set of nonlesion WM voxels on the subtraction image. Most of these voxels belong to the intersection of the 2 WM masks obtained by brain segmentation tools (such as FSL; http://www.fmrib.ox.ac.uk/fsl5) from T1-weighted structural images. These masks typically exclude large lesions that are hypointense on T1WI and therefore consist mainly of nonlesion voxels (On-line Fig 1).

Schematic of the proposed SDC lesion-change detection algorithm on the T2-weighted FLAIR subtraction image. One unchanged lesion (yellow arrow) and 1 new lesion (red arrow) are correctly identified by the SDC. The algorithm automatically generates red ROIs, which encompass the detected areas of change on the second FLAIR image to help the human reader quickly identify lesion changes.
The MR imaging signal-to-noise property can be used to formulate an optimal SDC of lesions as a composite statistical test between 2 hypotheses of the following likelihood functions:
 In this work, the SDC test statistic was computed over a 3-voxel connected neighborhood based on the currently accepted minimum MS lesion size requirement of 3 mm (3 voxels in 1-mm3 isotropic images)6 and on the assumption that the subtraction signals within this small neighborhood are similar. Denoting the subtraction signals at the i-th voxel and its neighbor voxels as di1, …, di3 and assuming μ > 0 (positive change), the test statistic ti can be computed from the log-likelihood ratio test7 and compared with a threshold γ to make a decision:
 Here γ was chosen to control the false-positive rate PFP = P(ti > γ | H0). According to the Neyman-Pearson lemma, this test provides the best detection power for a given PFP regardless of the unknown mean μ (uniformly most powerful detector).7
The test statistic is maximized over all possible neighborhoods surrounding the voxel, to increase the sensitivity of lesion detection:
 where Vi denotes a 3-voxel connected neighborhood system of the i-th voxel (On-line Fig 2). Intuitively, this test statistic encodes in probabilistic terms the expectation that a bright voxel on the subtraction image is more likely to be identified as “changed” if at least 2 of its neighboring voxels also have high signals.
MR Imaging Experiment
This was a retrospective study of 30 patients with MS with 2 consecutive brain MRIs (mean scan interval, 267 ± 104 days; range, 15–410 days) performed on 3T scanners (Magnetom Skyra, VE11A software; Siemens, Erlangen, Germany). The imaging protocol consisted of an MPRAGE T1WI sequence for brain structure (TR/TE/TI = 2300/2.3/900 ms, 1 mm3 isotropic) and a T2WI FLAIR sequence for lesion detection (TR/TE/TI = 7600/446/2450 ms, 1 mm3 isotropic). After skull removal and bias field correction, FLAIR images were coregistered into the half-way space using the FMRIB Linear Image Registration Tool algorithm (FLIRT; http://www.fmrib.ox.ac.uk/fsl/fslwiki/FLIRT)5 to ensure that the degree of blurring introduced by coregistration was similar between images because this similarity improves subtraction. To account for changes in image contrast or dynamic range (eg, due to different receiver gain settings or slight changes in imaging parameters), we performed image-intensity normalization before subtraction. The robust intensity range (second and 98th percentiles, denoted as m and M, respectively) was computed for each image. The image intensity of the second image I2 was then scaled linearly to match that of the first image I1 as follows: I2,scaled = αI2 + β, where α = (M1 − m1) / (M2 − m2) and β = [(M1 − αM2) + (m1 − αm2)] / 2. In addition, brain GM, WM, and CSF masks were obtained from the T1WI using the FMRIB Automated Segmentation Tool (FAST; https://fsl.fmrib.ox.ac.uk/fsl/fslwiki/FAST) algorithm.5 The SDC test statistic (Equations 1 and 2) was then computed and thresholded to generate a change mask (Fig 1). The false-positive rate PFP was set to 0.0001, which means that, on average, 50 of approximately 500,000 WM voxels may be incorrectly labeled as “changed.” To reduce the number of false-positives, we imposed additional constraints on lesion size (≥3 voxels), location (lesions located within 2 voxels of the CSF border had to be part of a larger lesion that extended outside this border), and intensity on the second FLAIR image (>2 SDs above the mean normal-appearing WM intensity, ie, WM voxels that do not appear bright on FLAIR were excluded).
For comparison, the lesion prediction algorithm (LPA), part of the Lesion Segmentation Tool toolbox (LST; http://www.applied-statistics.de/lst.html),8 was used to compute the lesion masks from FLAIR images. This algorithm consists of a binary classifier in the form of a logistic regression model trained on the data of 53 patients with MS.8 The lesion masks were then subtracted to obtain the change mask without any human revision. Like the SDC, lesion changes of <3 voxels were excluded.
Statistical Analysis
A neuroradiologist with 6 years of experience reviewed the 2 FLAIR and the subtraction images with the help of computer-generated color ROIs that encompassed the detected lesion changes (Fig 2). These were labeled as “true-positive” or “false-positive.” The reader also reviewed the images outside these ROIs to count the number of missed (false-negative) and unchanged (true-negative) lesions. Lesion changes detected by the SDC and LPA were presented in randomized order (both by subject and by detection algorithm) to the reader, who was blinded to the algorithm. The image review time was recorded for each subject and algorithm. A 2-tailed paired-sample t test was used to compare the mean review time per subject of SDC and LPA. The sensitivity and specificity of each method were calculated using the generalized estimating equation logistic regression, which accounts for the correlation among the measurements within the same subject.9

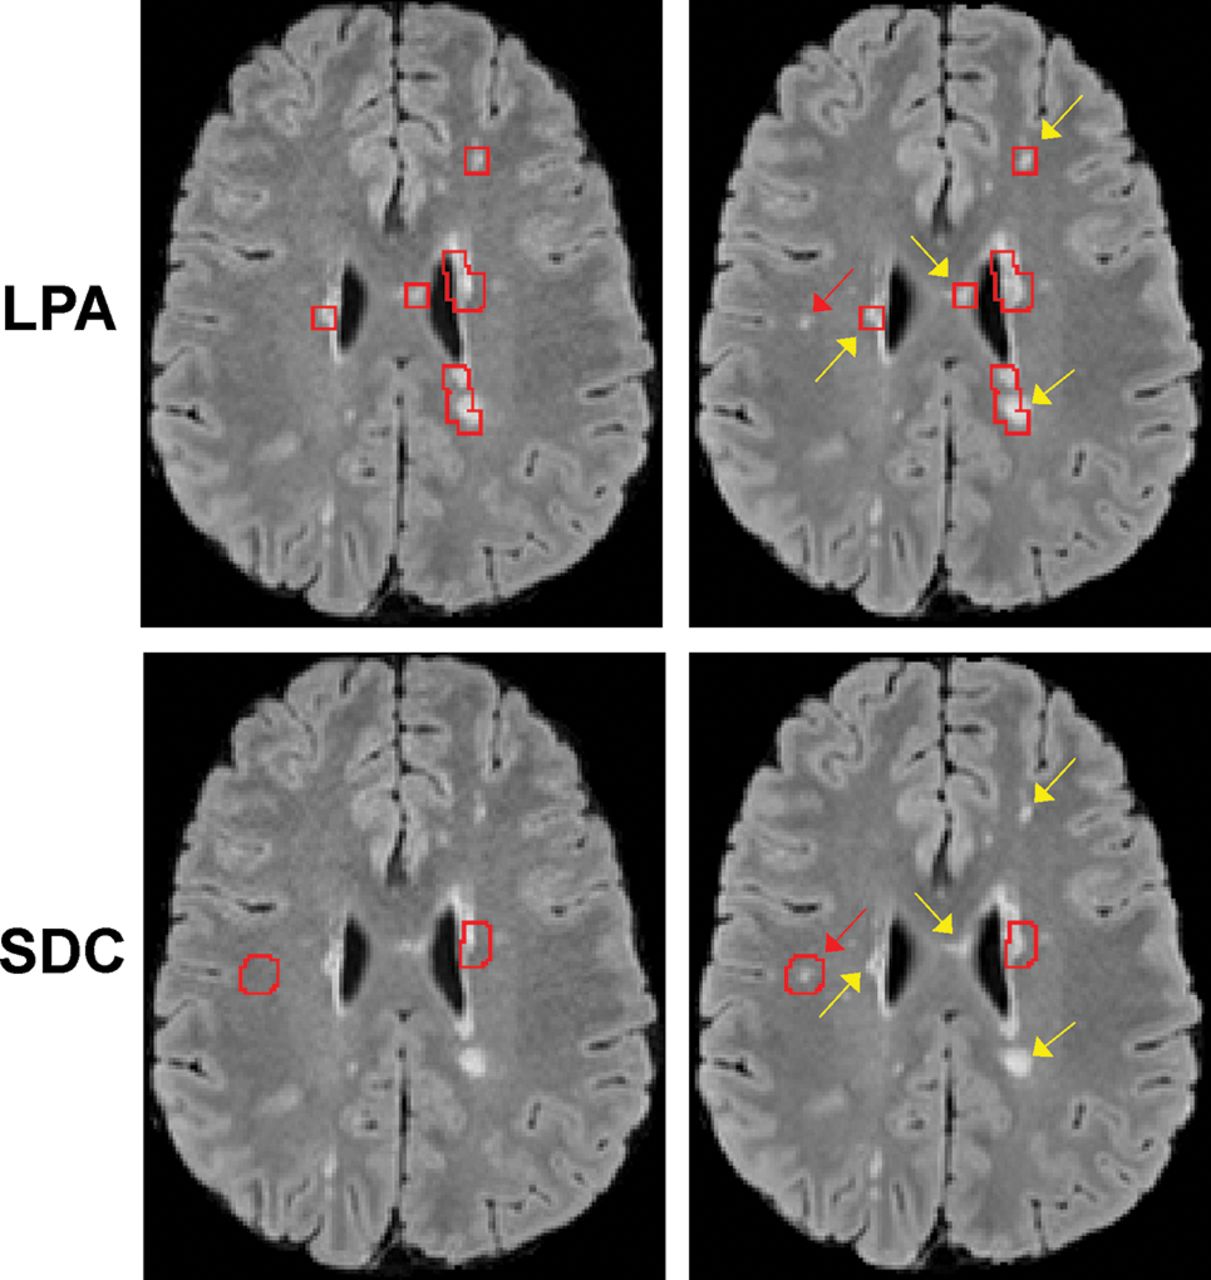
Comparison of lesion changes identified by the LPA and SDC (indicated by the red ROIs generated by the algorithms and superimposed on the T2 source FLAIR images). Each column shows images acquired at a different time points. The LPA identifies more false-positives (yellow arrows) yet misses a new small lesion (red arrow). The SDC correctly classifies positive lesion changes in concordance with the human expert.
Results
Figure 2 shows an example of lesion detection, in which the LPA generated more false-positives than the SDC and missed a small new lesion (On-line Fig 3). In 30 subjects, the SDC detected 344 lesion changes, or an average of 11 ± 7 per subject (range, 4–33), while the LPA detected 1506 changes, or an average of 50 ± 38 per subject (range, 5–152). This result led to a 49% reduction in human review time per case (116 ± 44 seconds; range, 50–182 seconds, by SDC versus 229 ± 122 seconds; range, 76–447 seconds, by LPA, P = .007). Despite fewer detected changes and decreased review time, the SDC missed only 2 new lesions compared with 34 missed lesions by the LPA. The false-positive rate was 0.241 and 0.735 for SDC and LPA, respectively. With the neuroradiologist's reading used as the reference standard, the SDC achieved both higher sensitivity (0.964; 95% CI, 0.823–0.994 by SDC, versus 0.614; 95% CI, 0.410–0.784 by LPA) and higher specificity (0.691; 95% CI, 0.612–0.761 by SDC, versus 0.281; 95% CI, 0.228–0.314 by LPA). Because the 95% CI for the SDC does not overlap that for the LPA regarding both sensitivity and specificity, we concluded that the difference between the 2 diagnostic methods is statistically significant. The Table summarizes the diagnostic accuracy of each algorithm for lesion-change detection.
Summary of diagnostic accuracy of the SDC and LPA algorithms for detecting positive lesion change (lesion growth) between 2 FLAIR images with side-by-side image review by a human reader as the reference standard
Discussion
Our data show that the proposed SDC algorithm based on the optimal Neyman-Pearson detector is a computer-assisted tool that can improve the MS lesion detection rate and decrease image-analysis time, thereby reducing the reader's fatigue. The improved robustness of the SDC can be attributed to its probabilistic approach, which uses the statistical properties of the FLAIR subtraction signal within a connected voxel neighborhood to derive an optimal detection threshold for change detection. Although only positive change (lesion growth) was considered, detecting negative change (lesion shrinkage) can be performed by swapping the order of the FLAIR images. The algorithm was designed to be highly sensitive (0.964 sensitivity) for serving as a screening tool for new lesions while providing a reasonable specificity (only 1 of 3 unchanged lesions was misclassified, compared with 3 of 4 for the LPA). We also considered the longitudinal pipeline implemented in the LST toolbox8 and found that it has much lower sensitivity (0.386; 95% CI, 0.269–0.518) though higher specificity (0.994; 95% CI, 0.985–0.999) compared with the LPA mask-subtraction method and therefore is less suited for diagnostic purposes.
This initial feasibility study has several limitations. We have focused on WM lesions to circumvent the limited contrast of cortical or deep GM lesions on FLAIR. Further studies using pulse sequences tailored for GM lesion detection (eg, double inversion recovery at 7T) are warranted to evaluate the SDC for this lesion cohort. Because most subjects (18/30) were imaged at approximately 1-year intervals, it was not possible to assess statistically whether the accuracy of SDC and LPA varies with follow-up intervals. Comparison with other algorithms and further evaluation on the impact of image interpretation in larger patient imaging datasets are also needed, particularly in those with abrupt anatomic changes between scans, which can make image alignment difficult.
Conclusions
The SDC lesion change detection algorithm has higher sensitivity and specificity than the LPA algorithm.
Footnotes
Disclosures: Thanh D. Nguyen—RELATED: Grant: National Institutes of Health (R01NS090464), National MS Society.* Ajay Gupta—RELATED: Grant: National Institutes of Health (R01NS090464).* Susan A. Gauthier—UNRELATED: Grants/Grants Pending: Mallinckrodt, Genzyme, Novartis.* Yi Wang—RELATED: Grant: National Institutes of Health (R01NS090464), National MS Society. *Money paid to the institution.
This work was supported by research grants from the National Institutes of Health (R01 NS090464) and the National MS Society (RG-1602-07671).
Indicates open access to non-subscribers at www.ajnr.org
References
- Received November 21, 2017.
- Accepted after revision January 20, 2018.
- © 2018 by American Journal of Neuroradiology


Jump to section
Related Articles
Cited By...
- Evaluation of the Statistical Detection of Change Algorithm for Screening Patients with MS with New Lesion Activity on Longitudinal Brain MRI
- Evaluation of the Statistical Detection of Change Algorithm for Screening Patients with MS with New Lesion Activity on Longitudinal Brain MRI
- Evaluation of statistical detection of change algorithm for triaging multiple sclerosis patients with new lesion activity on longitudinal brain MRI