
Abstract
BACKGROUND AND PURPOSE: Identifying cerebral microhemorrhage burden can aid in the diagnosis and management of traumatic brain injury, stroke, hypertension, and cerebral amyloid angiopathy. MR imaging susceptibility-based methods are more sensitive than CT for detecting cerebral microhemorrhage, but methods other than quantitative susceptibility mapping provide results that vary with field strength and TE, require additional phase maps to distinguish blood from calcification, and depict cerebral microhemorrhages as bloom artifacts. Quantitative susceptibility mapping provides universal quantification of tissue magnetic property without these constraints but traditionally requires a mask generated by skull-stripping, which can pose challenges at tissue interphases. We evaluated the preconditioned quantitative susceptibility mapping MR imaging method, which does not require skull-stripping, for improved depiction of brain parenchyma and pathology.
MATERIALS AND METHODS: Fifty-six subjects underwent brain MR imaging with a 3D multiecho gradient recalled echo acquisition. Mask-based quantitative susceptibility mapping images were created using a commonly used mask-based quantitative susceptibility mapping method, and preconditioned quantitative susceptibility images were made using precondition-based total field inversion. All images were reviewed by a neuroradiologist and a radiology resident.
RESULTS: Ten subjects (18%), all with traumatic brain injury, demonstrated blood products on 3D gradient recalled echo imaging. All lesions were visible on preconditioned quantitative susceptibility mapping, while 6 were not visible on mask-based quantitative susceptibility mapping. Thirty-one subjects (55%) demonstrated brain parenchyma and/or lesions that were visible on preconditioned quantitative susceptibility mapping but not on mask-based quantitative susceptibility mapping. Six subjects (11%) demonstrated pons artifacts on preconditioned quantitative susceptibility mapping and mask-based quantitative susceptibility mapping; they were worse on preconditioned quantitative susceptibility mapping.
CONCLUSIONS: Preconditioned quantitative susceptibility mapping MR imaging can bring the benefits of quantitative susceptibility mapping imaging to clinical practice without the limitations of mask-based quantitative susceptibility mapping, especially for evaluating cerebral microhemorrhage–associated pathologies, such as traumatic brain injury.
ABBREVIATIONS:
- CMH
- cerebral microhemorrhage
- GRE
- gradient recalled-echo
- mQSM
- mask-based QSM
- pQSM
- preconditioned QSM
- QSM
- quantitative susceptibility mapping
- TBI
- traumatic brain injury
Multiple diseases, including traumatic brain injury (TBI),1,2 stroke,3,4 hypertension, and cerebral amyloid angiopathy5 require assessment of cerebral microhemorrhage (CMH) for diagnosis and/or management. However, the choice of neuroimaging technique can provide very different assessments of CMH burden. While knowledge of CMH burden and distribution should inform risk stratification and treatment choices, variability in CMH assessment based on the choice of neuroimaging method produces uncertainty about how this information should be used to inform patient management.6 This ambiguity signals the need for an easy-to-implement, sensitive, and specific method to identify CMHs.
Susceptibility-based (T2*) MR imaging methods (2D gradient recalled-echo[GRE], 3D GRE, susceptibility-weighted imaging, quantitative susceptibility mapping [QSM]) are more sensitive than CT for CMH detection.7,8 However, all these MR imaging CMH evaluation methods, other than QSM,9⇓⇓⇓–13 will depict CMHs as bloom artifacts instead of as actual lesion size.14 They also have an appearance that varies on the basis of MR imaging field strength and scan parameters9,15⇓⇓–18 and require an additional phase map to distinguish blood products (diamagnetic) from calcium19 (paramagnetic). Also, QSM distinguishes calcium from blood products better than susceptibility-weighted imaging.20 QSM estimates the intrinsic susceptibility distribution of tissue by deconvolving the blooming in the GRE phase.21
Most QSM methods, however, use a mask (mQSM) to remove the phase of low-magnitude signal to avoid singularities and streaking artifacts (mainly in the noise). The mask may either include high-susceptibility regions shown as hypointense blooming artifacts on GRE or mask out regions of brain parenchyma. Selecting a brain mask can be challenging, especially near the brain boundary, where large tissue-air or tissue-bone susceptibility differences can cause substantial signal loss on the magnitude images used to define the mask.21 This signal loss can be made even worse when hemorrhage is near the boundary. Using a mask for mQSM that is too small can include noisy phase information and lead to streaking, while a mask that is too large results in nonvisualized brain. Erosion of the brain mask can especially prevent visualization of important structures at the brain boundaries. Although numerous skull-stripping algorithms can be applied to generate an optimal mask for any individual case, there is no one automated method that will uniformly generate the optimal mask for all cases. Even optimal masks can be made suboptimal after application of extreme intensity masking by some algorithms, which can lead to nonvisualized CMHs. These mask issues can result in variable portions of brain nonvisualization, impeding the application of mQSM methods in clinical practice.
A potential solution to this problem is application of the preconditioned QSM (pQSM) method with total field inversion,22 which produces whole-head quantitative susceptibility maps without skull-stripping, reduces the error propagation associated with imprecise background field removal, and suppresses streaking artifacts in intracerebral hemorrhage on QSM images.22 pQSM calculates tissue-susceptibility values for the entire FOV (including the otherwise hypointense areas). We hypothesize that removing the need for a brain mask will enable pQSM imaging to generate robust brain susceptibility imaging, which can more reliably identify brain parenchyma and characterize CMHs relative to mQSM. To test this hypothesis, we evaluated the visualized brain parenchyma and lesions generated from a single multiecho 3D GRE MR image in a cohort of patients with TBI and controls, comparing the images of the resulting three 3D GRE magnitude images (each at a different TE), mQSM using a standard mask method,23 and pQSM.
Materials and Methods
Subjects
Under an institutional review board protocol approved by the VA Palo Alto Health Care System and Stanford University, subjects with a history of TBI and control subjects without TBI were recruited through the Santa Clara Valley Medical Center, VA Palo Alto Health Care System, and surrounding communities. All subjects were evaluated for a history of prior TBI using the Ohio State University Traumatic Brain Injury Identification Method score (Ohio TBI score), which was then used to classify subjects as having no, mild, moderate, or severe TBI.24 Subjects also underwent neuroimaging.
A total of 81 subjects were recruited, of which only 63 subjects could tolerate the entire MR imaging protocol to undergo multiecho 3D GRE for QSM imaging. Of these 63 subjects, mQSM and pQSM images could only be produced for 56 subjects (89%) due to erroneous lines of k-space present in the raw data files. Subjects' ages, sex, and TBI demographic information are summarized in Table 1. There was no significant difference between non-TBI subjects and TBI subgroups (mild, moderate, or severe, as defined from the Ohio TBI score24) for age (1-way ANOVA, F[3,52] = 0.74, P = .53) or sex (χ2 = 0.17, P = .98, Table 1).
Subject demographics across Ohio TBI Scores23 (n = 56)
Image Acquisition
Images were obtained with a Discovery MR750 3T MR imaging scanner (GE Healthcare, Milwaukee, Wisconsin), using a 3D multishot multiecho EPI acquisition (TR = 98 ms; echoes = 3; TE = 14.3–19.7/33.1–46.99/51.8–74.28 ms; matrix = 224 × 224; resolution = 1 × 1 × 1mm3), and a 3D fast-spoiled gradient-recalled acquisition (TR/TE/TI = 9.5/3.8/900 ms, resolution = 1 × 1 × 1 mm3) using an 8-channel Signa head coil (GE Healthcare). Multicoil phase reconstruction was performed using the method of Bernstein et al.25 Magnitude 3D GRE images were produced automatically with the MR imaging scanner. mQSM images were created with the MEDI toolbox using the default mask (genmask.m).23 pQSM images were created using the method described by Liu et al.22,26
Image Interpretation
The images derived from the 3D multiecho GRE (the three 3D GRE magnitude volumes—each at 1 of 3 TE values [TE = 14.3–19.7/33.1–46.99/51.8–74.28 ms], the mQSM, and pQSM) and the T1-weighted fast-spoiled gradient-recalled images were examined by a neuroradiologist and a radiology resident, evaluating the presence of lesions and absent/distorted brain parenchyma, blinded to patient TBI status. Images were reviewed in 4 sessions (the T1 images were available for all sessions): 1) the three 3D GRE magnitude volumes, 2) the three 3D GRE volumes and mQSM, 3) the three 3D GRE volumes and pQSM images, and 4) all images. For each subject, consensus reading by the neuroradiologist and radiology resident resulting in scores of yes or no were created for the image pair attributes listed in Tables 1 and 2.
3D GRE, mQSM, and pQSM image review results (n = 56)
Statistics
The Student t test, ANOVA, and χ2 statistics with contingency tables were used to calculate statistical differences between groups on the following variables: age, sex, a history of TBI, blood on 3D GRE, and tissue missing on mQSM that was preserved on pQSM. The Fisher exact test was performed on the detection of blood on pQSM that was not seen on mQSM and blood on mQSM that was preserved on pQSM.
Results
Subjects with blood products did not show a significant difference from those without regarding age (P = .49), sex (χ2 = 0.04, P = .86, Table 1), or TBI severity (P = .11). Ten subjects demonstrated blood products on at least 1 of the three 3D GRE volumes in the occipital, temporal, parietal, or frontal lobes, as well as the basal ganglia or cerebellum (Figs 1⇓–3). Nine of these 10 subjects had a history of TBI.

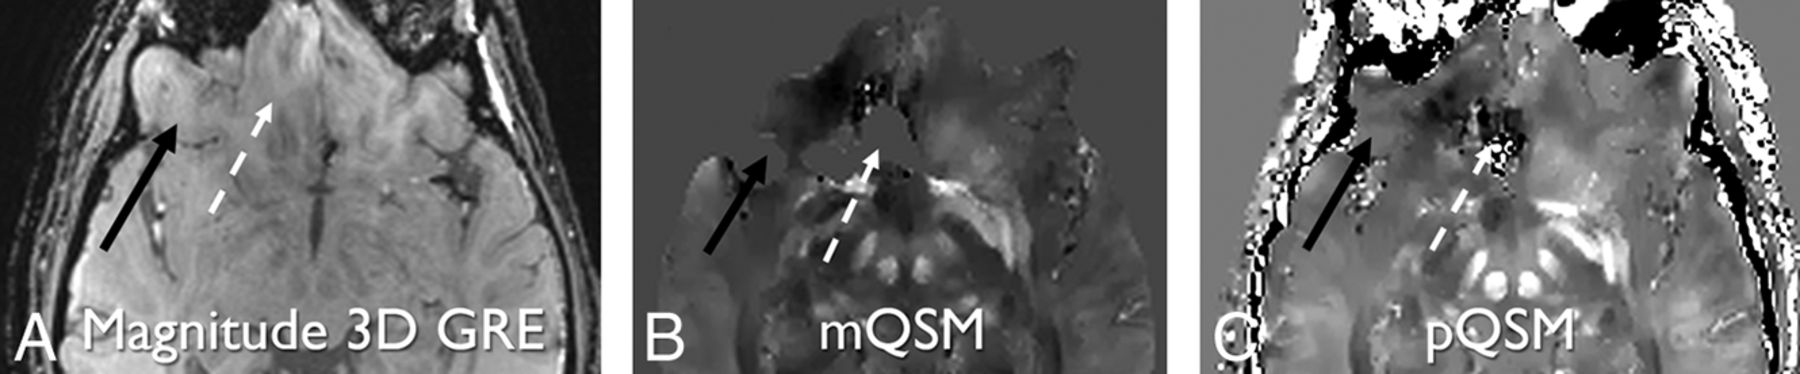
Paramagnetic right temporal hemorrhage is hypointense on magnitude 3D GRE (TE = 17.3 ms) (A) and hyperintense on mQSM (B) and pQSM (C) images (white dashed arrows). The diamagnetic calcification in bone (white solid arrows) is mostly hypointense on 3D GRE (A) and pQSM (C) and not present on mQSM (B) secondary to masking. Some areas of hyperintensity within the bone may represent diamagnetic structures, such as veins or artifacts. Left temporal lobe parenchyma next to hemorrhage is eroded on the mQSM (B), but preserved on magnitude and pQSM (C) images (white circles).

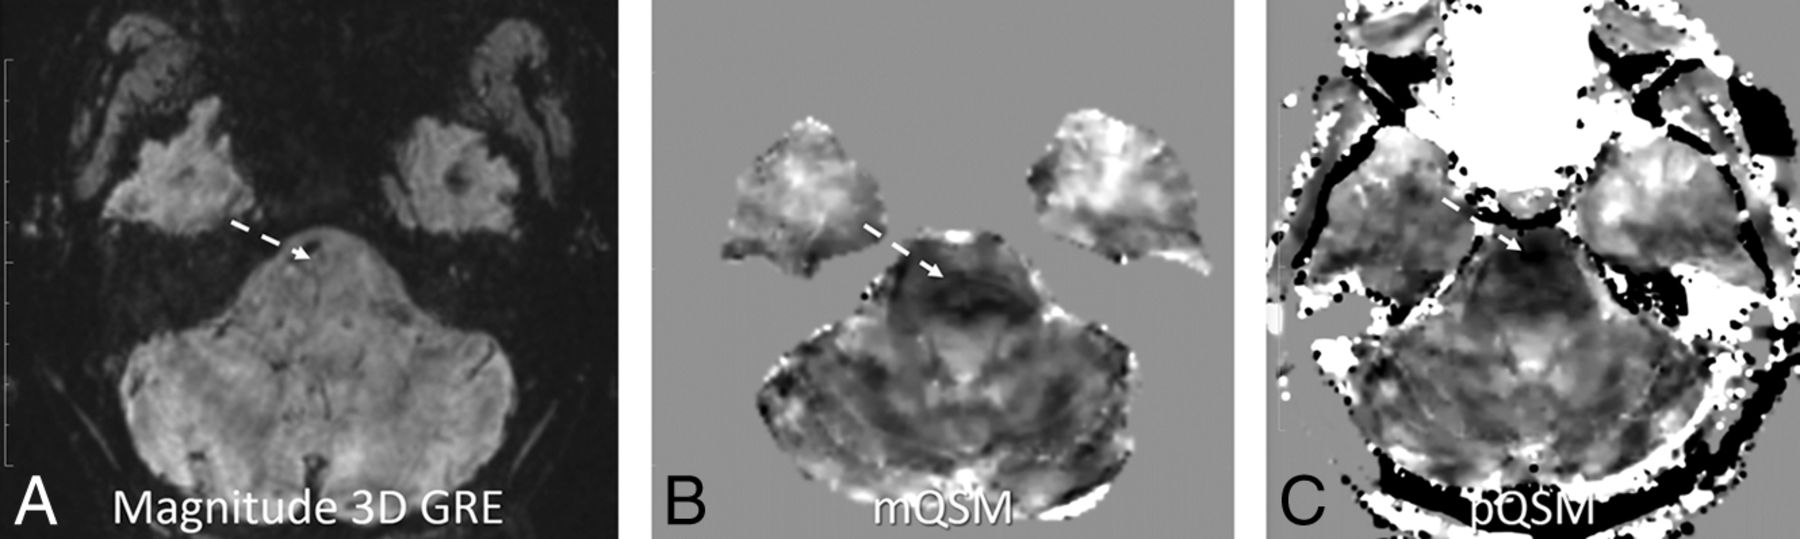
Right cerebellar hemorrhage is hypointense on magnitude 3D GRE (TE = 14.3 ms) (A). This part of the cerebellar parenchyma has been eroded on mQSM (B) and so is not visible due to masking. The same anatomy is preserved on pQSM (C), and hemorrhage is demonstrated (white solid arrows and circles). Additionally, an absent section of the right temporal brain parenchyma on mQSM (B) is partially preserved on the pQSM (C) relative to the 3D GRE image (A) (white dashed arrows and dashed circles). Note areas of black pixels within the white dashed circles on the mQSM and pQSM images (B and C) that correspond to brain tissue seen on 3D GRE image (A) indicate areas of nonvisualized brain.

Magnitude 3D GRE (TE = 14.3 ms) (A), mQSM (B), and pQSM (C) images demonstrating partial pQSM image depiction relative to mQSM. An area of the right inferior frontal lobe present on the 3D GRE image is present on the pQSM image and absent on mQSM image (black solid arrows). An adjacent inferior frontal lobe is present on the 3D GRE image, distorted on the pQSM image, and absent on the mQSM (white dashed arrows).
Of the 10 subjects with blood on a 3D GRE image, these cases had pQSM images depicting those lesions, but only 4 of these lesions were visible on the mQSM images, due to nonvisualized brain parenchyma, which was a statistically significant difference (P < .01).
Thirty-one subjects (55%) demonstrated brain parenchyma (some containing lesions) preserved on pQSM but eroded on mQSM due to masking. Five subjects (9%) demonstrated areas of more nonvisualized brain parenchyma on mQSM compared with that same region on pQSM images (P = .88, Table 1 and Fig 3). In subjects in whom there was brain parenchyma nonvisualization on mQSM or pQSM, none demonstrated greater areas of nonvisualized brain parenchyma on pQSM relative to mQSM images. Overall, there was more brain parenchyma visualization on pQSM images compared with corresponding mQSM images. The differences in parenchymal depiction on pQSM compared with mQSM were statistically significant (P < .01). There was not a statistically significant difference in age (P = .76), sex (χ2 = 0.04, P = .84), TBI severity (χ2 = 2.20, P = .5, Table 1), or the presence of blood products on 3D GRE (χ2 = 2.99, P = .08, Table 1) for cases demonstrating nonvisualized brain parenchyma on mQSM relative to cases that did not. Six subjects (11%) demonstrated mQSM and pQSM pons hypointensity with no corresponding 3D GRE finding suggestive of artifacts, all larger on pQSM than on corresponding mQSM images (Fig 4).

pQSM (C) demonstrates worse nonspecific diffuse low signal in the pons compared with mQSM (B), with no corresponding abnormality on the magnitude 3D GRE (TE = 41.8 ms) image (A) (white dashed arrows). Note that areas of hypointensity are in different positions within the pons.
Discussion
This report shows that pQSM can depict more brain parenchyma than masked-based QSM using the same acquisition data. Comparing these images generated from a single multiecho 3D GRE scan allowed evaluation of imaging features while holding other acquisition parameters constant (eg, field strength, flip angle, sampled TEs, and so forth.). Additionally, our results demonstrate that some of these areas of brain visible on pQSM but not present on mQSM contained clinically relevant pathology, such as CMHs. This difference in brain depiction is consistent with the expectation that variations in skull-stripping performance and variations of intensity that threshold-based masking algorithms use, especially near hemorrhages (as demonstrated in Figs 2 and 3), can result in areas of nonvisualized brain on mQSM methods. This contrasts with pQSM, which uses magnitude information to differentiate weak from strong sources of susceptibility over the entire head for reconstruction. Instead of splitting the QSM problem into background field removal and local field fitting (in which errors are propagated from the first into the second), preconditioned QSM solves them together. Demonstration of better preservation of brain parenchyma in pQSM compared with mQSM in subjects was independent of age, sex, and the presence of hemorrhage or history of prior trauma; this finding suggests generalizability across patients. The preservation of anatomic landmarks, such as skull margins, on pQSM images also has the potential to aid in clinical interpretation. The feature of preserving skull and scalp in pQSM may also allow better depiction of calvarial and skin masses if challenges regarding scalp SNR and implementation of a robust water/fat separation algorithm can be managed.
Like other neuroimaging studies evaluating cerebral microhemorrhage presence, this study used an accepted GRE imaging sequence as the reference standard for CMH presence.8,15,27,28 Here, the 3 echoes of the 3D GRE magnitude images were used as ground truth for the presence of CMHs, given that direct pathologic correlation was not possible (as is the case in many clinical imaging studies). Across the 3 TE volumes, more subtle susceptibility changes are likely to be visible at higher TEs, but often with corresponding increased artifacts. The three 3D GRE magnitude whole-brain volumes were each interpreted as they would be clinically for the presence of a lesion across the 3 TEs. However, in routine clinical practice, only 1 volume would likely be reviewed, leaving the possibility that smaller or subtler CMHs may have been visible at a longer TE, which is not the case for QSM-based images. Also, reviewing those magnitude images without phase maps would leave room for doubt as to whether the lesions were blood products or calcification, as is often the case in current clinical practice. Because the pQSM images did not show any lesions that did not appear on at least 1 of the 3D GRE images, no false-positives were encountered.
While our work found pQSM to always depict more brain parenchyma than mQSM, there was still omission of some brain areas on pQSM relative to at least 1 of the 3 TE 3D GRE images. These areas of pQSM failure may be related to the magnitude image of the first echo (14.3–19.7 ms in this study) not being sufficiently short, impacting the ability of pQSM to differentiate strong and weak sources. At this level of first TE, the cortex might already experience R2* decay due to field inhomogeneity at air/tissue interfaces. QSM may only reduce blooming artifacts to the amount in the first echo. Future work should study the ability of a shorter first TE to remedy this problem. The instances in which pQSM demonstrates brain parenchyma more than mQSM, but with some distortion or some nonvisualized brain tissue, do raise the concern about whether it is better to not demonstrate tissue at all rather than show it with distortion. Future work incorporating lower TE information should consider this question as well.
Overall, the osseous structures on QSM appear hypointense, compatible with paramagnetic calcification. However, some hyperintense areas in bone were noted (Figs 1⇑⇑–4). These findings may be related to intraosseous venous structures or artifacts (because, in the case of skull bone, there is little local phase signal to aid in identifying its susceptibility value). Although the current implementation of pQSM is not optimized for bone, improvement could be made by acquiring the first echo at an earlier TE, similar to acquisitions such as ultrashort TE, to more reliably characterize bone properties.
This study did not evaluate the quantitative aspects of pQSM. Although QSM is a quantitative method, current clinically used susceptibility-based neuroimaging methods are interpreted solely on a qualitative basis, assessing hypointense foci, with the occasional addition of phase maps to distinguish blood from calcification. Future work could assess the additional clinical value of mQSM/pQSM quantitative lesion analysis.
Limitations of this study include the small sample size of patients with hemorrhage. While this work did not clearly demonstrate instances of CMHs visible on pQSM or mQSM that were not seen on 3D GRE images, only 10 (18%) subjects had CMHs, despite having 34 subjects (61%) with a history of TBI. Future studies would benefit from larger subject cohorts, with more subjects demonstrating susceptibility-based pathologies, such as CMHs. An additional limitation is that categorization of brain loss in the current study was performed by only 2 readers providing a consensus read, and subsequent studies would benefit from using an automated or multireader evaluation. The 6 cases (11%) in which pQSM demonstrated greater pontine tissue contrast relative to mQSM, with no definite corresponding anatomic or pathologic finding on 3D GRE images (Fig 4), also represent an important area for future evaluation. Further investigation of pQSM specificity for CMH evaluation would also advance defining the clinical role that pQSM can play in managing patients in whom identifying CMHs is clinically relevant.
Conclusions
pQSM can improve the evaluation of CMH-associated pathologies, such as TBI.
Footnotes
Disclosures: Stephanie Kolakowsky-Hayner—UNRELATED: Consultancy: Gerson Lehrman Group, Comments: various consulting calls related to brain injury rehabilitation; Employment: Ichan School of Medicine at Mount Sinai, Comments: current employer; Grants/Grants Pending: National Institute on Disability, Independent Living, and Rehabilitation Research, Comments: TBI Model Systems Grant, Spinal Cord Injury Model Systems Grant, Spinal Cord Injury Model Systems Collaborative Grant*; Payment for Lectures Including Service on Speakers Bureaus: Brain Injury Association of Virginia, Comments: stipend for keynote; Royalties: Lash and Associates, Comments: Tip Card Royalties; Travel/Accommodations/Meeting Expenses Unrelated to Activities Listed: Paralyzed Veterans of America, Comments: conference scholarship. Maheen M. Adamson—RELATED: Grant: VA Office of Public Health (War Related Illness and Injury Study Center)*; Support for Travel to Meetings for the Study or Other Purposes: VA Office of Public Health (War Related Illness and Injury Study Center)*. Pascal Spincemallie—RELATED: Grant: National Institutes of Health, Comments: R01CA181566, includes salary support*; Support for Travel to Meetings for the Study or Other Purposes: National Institutes of Health, Comments: R01CA181566*; UNRELATED: Patents (Planned, Pending or Issued): US 8781197*. Yi Wang—RELATED: Grant: National Institutes of Health, Comments: R01CA178007, R01NS090464, R01NS095562*; UNRELATED: Patents (Planned, Pending or Issued): Cornell University, Comments: I am one of the inventors on QSM technology*; Stock/Stock Options: Medimagemetric, Comments: Medimagemetric is working with Cornell on commercializing QSM technology.* Magdy Selim—UNRELATED: Grants/Grants Pending: National Institute of Neurological Disorders and Stroke, American Heart Association*; Royalties: Oxford University Press, Cambridge University Press. *Money paid to the institution.
Paper previously presented, in part, at Annual Meeting of the American Society of Neuroradiology and the Foundation of the ASNR Symposium, April 22–27, 2017; Long Beach, California; and International Society for Magnetic Resonance in Medicine Annual Meeting and Exhibition, April 22–27, 2017; Honolulu, Hawaii.
This study was funded by the War Related Illness and Injury Study Center, National Institutes of Health RO1 EB013443, RO1 NS090464, R01 NS095562, R01 CA181566, and R01CA178007.
Indicates open access to non-subscribers at www.ajnr.org
References
- Received August 18, 2017.
- Accepted after revision December 4, 2017.
- © 2018 by American Journal of Neuroradiology


Jump to section
Related Articles
Cited By...
- No citing articles found.