Advertisement

Main menu

  • Home
  • Content
    • Current Issue
    • Accepted Manuscripts
    • Article Preview
    • Past Issue Archive
    • Video Articles
    • AJNR Case Collection
    • Case of the Week Archive
    • Case of the Month Archive
    • Classic Case Archive
  • Special Collections
    • AJNR Awards
    • Low-Field MRI
    • Alzheimer Disease
    • ASNR Foundation Special Collection
    • Photon-Counting CT
    • View All
  • Multimedia
    • AJNR Podcasts
    • AJNR SCANtastic
    • Trainee Corner
    • MRI Safety Corner
    • Imaging Protocols
  • For Authors
    • Submit a Manuscript
    • Submit a Video Article
    • Submit an eLetter to the Editor/Response
    • Manuscript Submission Guidelines
    • Statistical Tips
    • Fast Publishing of Accepted Manuscripts
    • Graphical Abstract Preparation
    • Imaging Protocol Submission
    • Author Policies
  • About Us
    • About AJNR
    • Editorial Board
    • Editorial Board Alumni
  • More
    • Become a Reviewer/Academy of Reviewers
    • Subscribers
    • Permissions
    • Alerts
    • Feedback
    • Advertisers
    • ASNR Home

User menu

  • Alerts
  • Log in

Search

  • Advanced search
American Journal of Neuroradiology

American Journal of Neuroradiology

ASHNR American Society of Functional Neuroradiology ASHNR American Society of Pediatric Neuroradiology ASSR
  • Alerts
  • Log in

Advanced Search

  • Home
  • Content
    • Current Issue
    • Accepted Manuscripts
    • Article Preview
    • Past Issue Archive
    • Video Articles
    • AJNR Case Collection
    • Case of the Week Archive
    • Case of the Month Archive
    • Classic Case Archive
  • Special Collections
    • AJNR Awards
    • Low-Field MRI
    • Alzheimer Disease
    • ASNR Foundation Special Collection
    • Photon-Counting CT
    • View All
  • Multimedia
    • AJNR Podcasts
    • AJNR SCANtastic
    • Trainee Corner
    • MRI Safety Corner
    • Imaging Protocols
  • For Authors
    • Submit a Manuscript
    • Submit a Video Article
    • Submit an eLetter to the Editor/Response
    • Manuscript Submission Guidelines
    • Statistical Tips
    • Fast Publishing of Accepted Manuscripts
    • Graphical Abstract Preparation
    • Imaging Protocol Submission
    • Author Policies
  • About Us
    • About AJNR
    • Editorial Board
    • Editorial Board Alumni
  • More
    • Become a Reviewer/Academy of Reviewers
    • Subscribers
    • Permissions
    • Alerts
    • Feedback
    • Advertisers
    • ASNR Home
  • Follow AJNR on Twitter
  • Visit AJNR on Facebook
  • Follow AJNR on Instagram
  • Join AJNR on LinkedIn
  • RSS Feeds

AJNR Awards, New Junior Editors, and more. Read the latest AJNR updates

Research ArticleADULT BRAIN

T1 Recovery Is Predominantly Found in Black Holes and Is Associated with Clinical Improvement in Patients with Multiple Sclerosis

C. Thaler, T.D. Faizy, J. Sedlacik, B. Holst, K. Stürner, C. Heesen, J.-P. Stellmann, J. Fiehler and S. Siemonsen
American Journal of Neuroradiology February 2017, 38 (2) 264-269; DOI: https://doi.org/10.3174/ajnr.A5004
C. Thaler
aFrom the Departments of Diagnostic and Interventional Neuroradiology (C.T., T.D.F., J.S., B.H., J.F., S.S.)
  • Find this author on Google Scholar
  • Find this author on PubMed
  • Search for this author on this site
  • ORCID record for C. Thaler
T.D. Faizy
aFrom the Departments of Diagnostic and Interventional Neuroradiology (C.T., T.D.F., J.S., B.H., J.F., S.S.)
  • Find this author on Google Scholar
  • Find this author on PubMed
  • Search for this author on this site
  • ORCID record for T.D. Faizy
J. Sedlacik
aFrom the Departments of Diagnostic and Interventional Neuroradiology (C.T., T.D.F., J.S., B.H., J.F., S.S.)
  • Find this author on Google Scholar
  • Find this author on PubMed
  • Search for this author on this site
  • ORCID record for J. Sedlacik
B. Holst
aFrom the Departments of Diagnostic and Interventional Neuroradiology (C.T., T.D.F., J.S., B.H., J.F., S.S.)
  • Find this author on Google Scholar
  • Find this author on PubMed
  • Search for this author on this site
  • ORCID record for B. Holst
K. Stürner
bNeurology (K.S., C.H., J.-P.S.)
cInstitute for Neuroimmunology and Clinical MS Research (K.S., C.H., J.-P.S., S.S.), University Medical Centre Hamburg-Eppendorf, Hamburg, Germany.
  • Find this author on Google Scholar
  • Find this author on PubMed
  • Search for this author on this site
  • ORCID record for K. Stürner
C. Heesen
bNeurology (K.S., C.H., J.-P.S.)
cInstitute for Neuroimmunology and Clinical MS Research (K.S., C.H., J.-P.S., S.S.), University Medical Centre Hamburg-Eppendorf, Hamburg, Germany.
  • Find this author on Google Scholar
  • Find this author on PubMed
  • Search for this author on this site
  • ORCID record for C. Heesen
J.-P. Stellmann
bNeurology (K.S., C.H., J.-P.S.)
cInstitute for Neuroimmunology and Clinical MS Research (K.S., C.H., J.-P.S., S.S.), University Medical Centre Hamburg-Eppendorf, Hamburg, Germany.
  • Find this author on Google Scholar
  • Find this author on PubMed
  • Search for this author on this site
  • ORCID record for J.-P. Stellmann
J. Fiehler
aFrom the Departments of Diagnostic and Interventional Neuroradiology (C.T., T.D.F., J.S., B.H., J.F., S.S.)
  • Find this author on Google Scholar
  • Find this author on PubMed
  • Search for this author on this site
  • ORCID record for J. Fiehler
S. Siemonsen
aFrom the Departments of Diagnostic and Interventional Neuroradiology (C.T., T.D.F., J.S., B.H., J.F., S.S.)
cInstitute for Neuroimmunology and Clinical MS Research (K.S., C.H., J.-P.S., S.S.), University Medical Centre Hamburg-Eppendorf, Hamburg, Germany.
  • Find this author on Google Scholar
  • Find this author on PubMed
  • Search for this author on this site
  • ORCID record for S. Siemonsen
  • Article
  • Figures & Data
  • Supplemental
  • Info & Metrics
  • Responses
  • References
  • PDF
Loading

Abstract

BACKGROUND AND PURPOSE: Quantitative MR imaging parameters help to evaluate disease progression in multiple sclerosis and increase correlation with clinical disability. We therefore hypothesized that T1 values might be a marker for ongoing tissue damage or even remyelination and may help increase clinical correlation.

MATERIALS AND METHODS: MR imaging was performed in 17 patients with relapsing-remitting MS at baseline and after 12 months of starting immunotherapy with dimethyl fumarate. On baseline images, lesion segmentation was performed for normal-appearing white matter, T2 hyperintense (FLAIR lesions), T1 hypointense (black holes), and contrast-enhancing lesions, and T1 relaxation times were obtained at baseline and after 12 months. Changes in clinical status were assessed by using the Expanded Disability Status Scale and Symbol Digit Modalities Test at both dates (Expanded Disability Status Scale-difference/Symbol Digit Modalities Test-diff).

RESULTS: The highest T1 relaxation time at baseline was measured in black holes (1460.2 ± 209.46 ms) followed by FLAIR lesions (1400.38 ± 189.1 ms), pure FLAIR lesions (1327.5 ± 210.04 ms), contrast-enhancing lesions (1205.59 ± 199.95 ms), and normal-appearing white matter (851.34 ± 30.61 ms). After 12 months, T1 values had decreased significantly in black holes (1369.4 ± 267.81 ms), contrast-enhancing lesions (1079.57 ± 183.36 ms) (both P < .001), and normal-appearing white matter (841.98 ± 36.1 ms, P = .006). With the Jonckheere-Terpstra Test, better clinical scores were associated with decreasing T1 relaxation times in black holes (P < .05).

CONCLUSIONS: T1 relaxation time is a useful quantitative MR imaging technique, which helps detect changes in MS lesions with time. We assume that these changes are associated with the degree of myelination within the lesions themselves and are pronounced in black holes. Additionally, decreasing T1 values in black holes were associated with clinical improvement.

ABBREVIATIONS:

BH
black hole
CE-L
contrast-enhancing lesion
EDSS
Expanded Disability Status Scale
NAWM
normal-appearing white matter
MP2RAGE
double inversion-contrast magnetization-prepared rapid acquistion of gradient echo
SDMT
Symbol Digit Modalities Test
T1-RT
T1 relaxation time

MR imaging is an established tool in diagnosing multiple sclerosis and in monitoring inflammatory disease progression. In clinical routine, T2 and T1 lesion load and the detection of contrast-enhancing lesions (CE-Ls) are commonly used for monitoring subclinical disease activity and evaluating the effectiveness of pharmaceutical treatments. While hyperintense lesions on T2-weighted images (FLAIR lesions) correspond to a wide spectrum of histopathologic changes, ranging from edema and mild demyelination to glial scars or liquid necrosis, nonenhancing T1 hypointense lesions, black holes (BHs), are reported to be more specific markers for demyelination, axonal loss, and tissue damage.1⇓⇓⇓⇓–6 It was observed that for discriminating the different stages of cell damage, the degree of BH hypointensity seems to reflect the extent of axonal loss and might distinguish demyelinated and partially remyelinated lesions.7,8 Consequently, T1 relaxation times (T1-RTs) are increased in edema, demyelination, and axonal loss.9⇓–11

A recent study showed that the assessment of MS lesions by their T1 values helps to increase correlations with disability and might lead to a more differentiated lesion classification.12 However, little is known about the potential of lesional T1 values as a clinical marker in disease progression. Only a small number of previous studies have applied T1 relaxometry in patients with MS and reported increased T1 values in normal-appearing white matter (NAWM).13,14 Therefore, our study focuses on the longitudinal evaluation of T1 values in different MS lesion types, representing different grades of tissue destruction. With the recently introduced double inversion-contrast magnetization-prepared rapid acquisition of gradient echo (MP2RAGE) sequences, it is now possible to generate quantitative T1 maps with high reproducibility.15

The purpose of this study was to observe the evolution of T1 values in NAWM and in lesions in patients with MS for 1 year after starting immunotherapy with dimethyl fumarate. We hypothesized that longitudinal changes of lesional T1 values are associated with changes in clinical disability because T1 values might be a marker for ongoing tissue damage or even remyelination.

Materials and Methods

MR imaging was performed in 17 patients with MS at baseline and after 12 months. Also, at both time points, the clinical status was assessed by experienced neurologists. For this study, all patients who decided to be treated with dimethyl fumarate were treated at the MS day hospital. The study was approved by the local Ethical Committee Hamburg (Ethik-Kommission der Ärztekammer Hamburg) following the guidelines of the Declaration of Helsinki, and patients provided written informed consent. At baseline, all patients were diagnosed with relapsing-remitting MS, of whom 1 transitioned to secondary-progressive MS at follow-up. Disease duration ranged from 1 month to 19 years. All patients started treatment with dimethyl fumarate after baseline scans. For further patient characteristics, see the Table.

View this table:
  • View inline
  • View popup

Subject population

MR Imaging Data Acquisition

All MR imaging at baseline and after 12 months was performed on a 3T scanner (Magnetom Skyra; Siemens, Erlangen, Germany). The MR imaging protocol included a sagittal 3D FLAIR sequence (TE = 390 ms, TR = 4700 ms, TI = 1800 ms, 192 sections, FOV = 256 mm, voxel size = 1.0 × 1.0 × 1.0 mm), a T1-weighted magnetization-prepared rapid acquisition of gradient echo sequence before and after gadolinium injection (TE = 2.43 ms, TR = 1900 ms, TI = 900 ms, 192 sections, FOV = 256 mm, voxel size = 1.0 × 1.0 × 1.0 mm, flip-angle = 9°), and a double inversion-contrast magnetization-prepared rapid acquisition of gradient echo sequence before contrast agent injection (TE = 2.98 ms, TR = 5000 ms, TI = 700 ms, 176 sections, FOV = 256 mm, voxel size = 1.0 × 1.0 × 1.0 mm, flip angle = 4°).

Image Analysis

For measuring T1-RT in NAWM, 6 ROIs were manually defined in the occipital, frontal, and parietal white matter on baseline and follow-up MP2RAGE images. Simultaneously, ROI placement was controlled in the corresponding FLAIR images to avoid partial volume errors from MS lesions.

In baseline scans, FLAIR lesions were semiautomatically segmented on FLAIR images by using an open-source lesion-segmentation software (Lesion Segmentation Tool for SPM; http://www.academia.edu/2729347/LST_A_Lesion_Segmentation_Tool_For_SPM).16 For optimal lesion segmentation, the final threshold was set at κ = 0.3. If necessary, lesion outlines were corrected manually. FLAIR images were linearly registered to the MP2RAGE images on baseline and follow-up images, and the corresponding transformation was applied to the FLAIR lesion masks.

Additionally, BH lesion segmentation was performed by 2 independent raters with a minimum of 1-year specific training in MS image diagnostics and evaluation on T1-weighted MPRAGE images. “BHs” were defined as nonenhancing lesions that appear hypointense on T1WI with signal intensity below the cortex and are concordant with hyperintense lesions on a T2WI. Lesions were outlined by using the software Analyze 11.0 (AnalyzeDirect, Overland Park, Kansas). The BH lesion masks of both raters were binarized and multiplied patient-wise to obtain a consensus mask. Finally, the consensus masks were registered to MP2RAGE images at baseline and follow-up. We marked CE-Ls, applying the same algorithm as described for BH lesion outlining and registered them to nonenhanced MP2RAGE images.

Finally, we calculated a pure FLAIR lesion mask by subtracting the BH and CE-L mask from the corresponding FLAIR lesion mask, leaving only those lesions that were visible on FLAIR but did not correspond to a BH or CE-L.

An example of lesional ROI placement is shown in Fig 1. Due to the registration of the baseline and follow-up images, we understand that minor displacements of lesions ROIs might occur. To minimize this possible bias, we excluded lesions of <5 voxels and assessed lesion maps on follow-up images to exclude misplaced ROIs and correct them if necessary. For each patient, for FLAIR lesions, BHs, pure FLAIR lesions, and CE-L number, volumes were calculated, and lesion-wise, median T1 values were obtained at baseline and follow-up. New FLAIR lesions and CE-Ls were detected manually after 12 months and were listed separately.

Fig 1.
  • Download figure
  • Open in new tab
  • Download powerpoint
Fig 1.

An example of ROI placement in T1WI MPRAGE at baseline. From left to right: 1) T1WI MPRAGE transversal without lesion ROIs, 2) ROIs indicating FLAIR-lesion masks, 3) ROIs indicating black hole lesion masks, and 4) ROIs indicating FLAIR-lesion masks without black holes (pure FLAIR lesion masks).

Because larger lesions might have a greater impact on clinical disability, we adapted the changes in T1-RTs to the actual lesion size in which it was measured. To correct for lesion size, we calculated a weighted average of the lesional T1-RTs (ie, T1-RTs were multiplied by their lesion volume and afterward divided by the patient's total lesion volume).

Clinical Status

At baseline and follow-up, clinical status was assessed by experienced neurologists by using the Expanded Disability Status Scale (EDSS) according to published guidelines.17 In addition, the oral Symbol Digit Modalities Test (SDMT) was assessed, and an SD for an age- and education-matched control cohort was calculated.18

Statistical Analysis

Statistical analysis was performed by using R 3.0.0 statistical and computing software (http://www.r-project.org/) and SPSS 21.0 (IBM, Armonk, New York). A paired t test was used to compare lesion T1-RTs at baseline and after 12 months within lesion groups. The Jonckheere-Terpstra Test (a rank-based nonparametric test) was used to test for changes in T1-RTs in patient groups classified by clinical changes.19 Two-sided P values < .05 were statistically significant.

Results

MR Imaging Measurements

At baseline, at least 1 FLAIR lesion was detected in all patients, and BHs were detected in all except 1 patient. Overall, 380 FLAIR lesions, 504 BHs, and 362 pure FLAIR lesions were segmented on baseline scans. In 8 of 17 patients, 22 CE-Ls were detected at baseline. After 12 months, 1 patient demonstrated a new CE-L and 7 patients presented with new FLAIR lesions. Interrater reliability for the detection of black holes was high, with a Dice coefficient of 0.916.

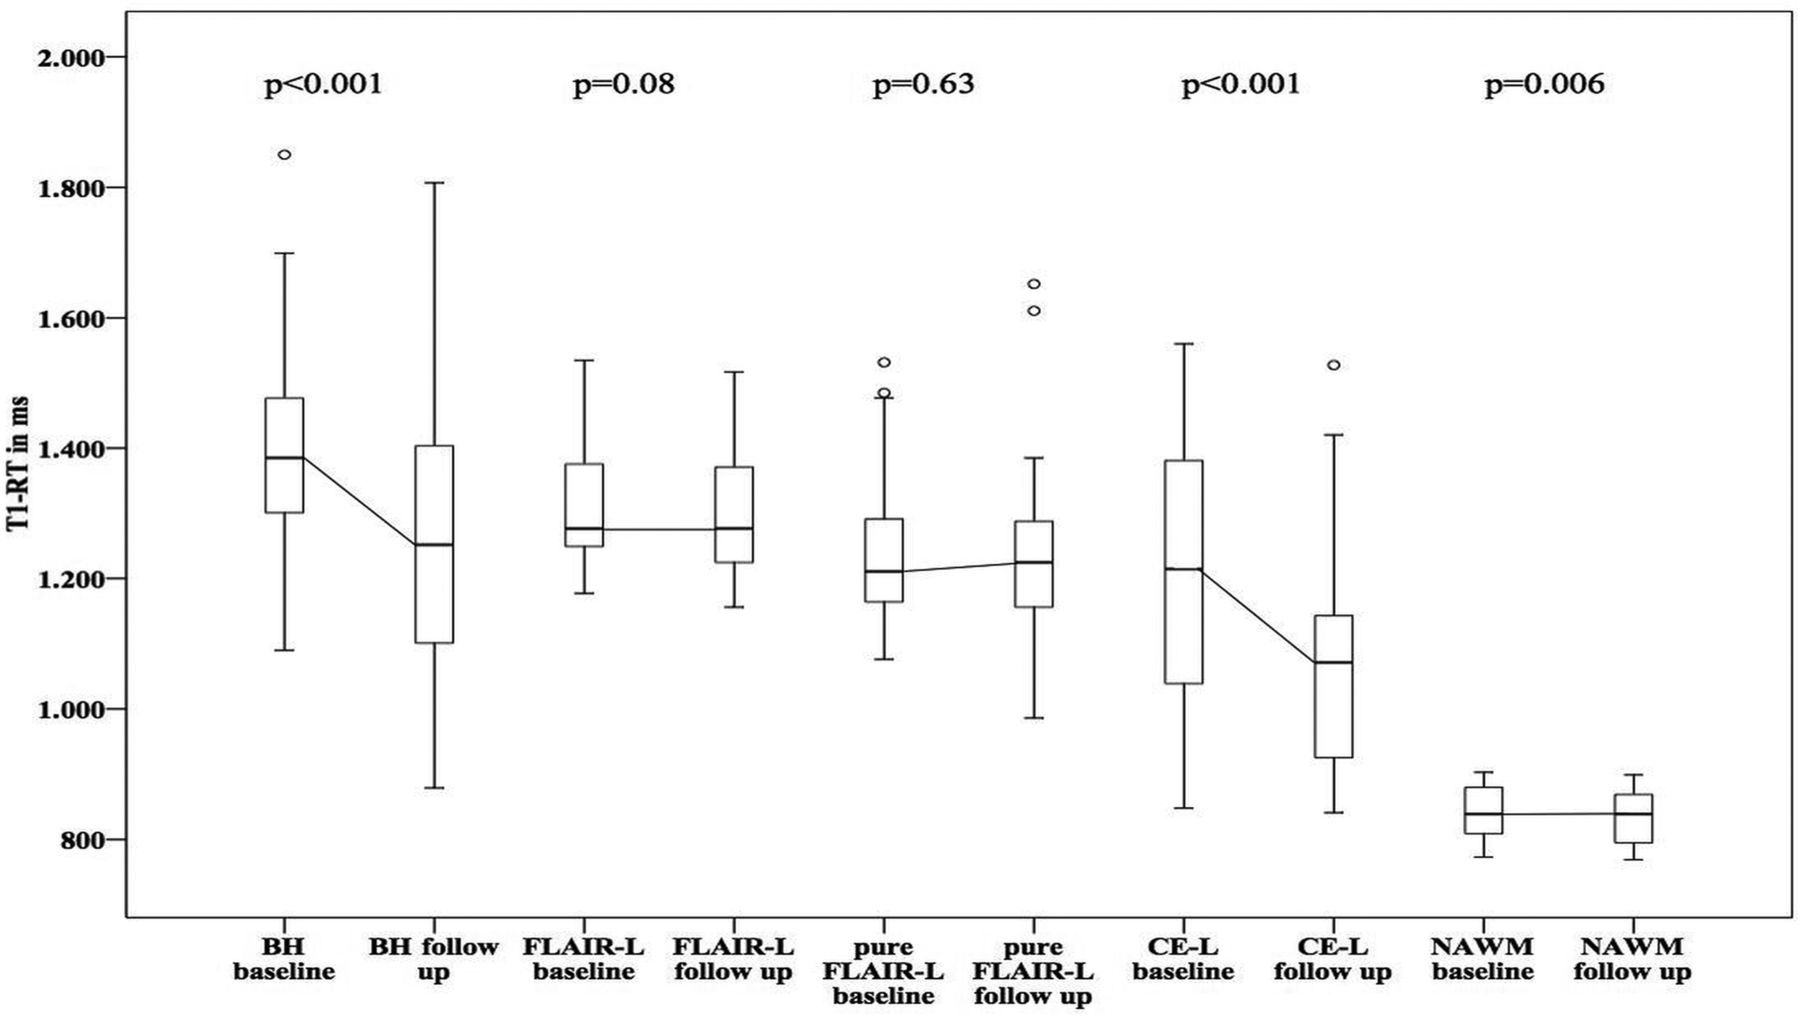
T1 values in NAWM showed a significant decrease with T1-RTs at a baseline of 851.34 ± 30.61 ms to 841.98 ± 36.1 ms after 12 months (P = .006). In MS lesions, the highest T1-RT at baseline was measured in BHs (1460.21 ± 209.46 ms) followed by T1-RTs in FLAIR lesions (1400.38 ± 189.1 ms) and T1-RTs in pure FLAIR lesions (1327.5 ± 210.04 ms). In 8 of 17 patients, 22 CE-Ls were detected at baseline, with a mean T1-RT of 1205.59 ± 199.95 ms. After 12 months, T1 values decreased in all lesion types: BHs = 1369.4 ± 267.81 ms, FLAIR lesions = 1383.33 ± 274.53 ms, pure FLAIR lesions = 1322.64 ± 305.07 ms, CE-Ls = 1079.57 ± 183.36 ms. Changes in T1-RT were calculated for all lesion ROIs. Using paired t tests, we found significant differences only for T1-RTs measured in NAWM (P = .006), BHs, and CE-Ls (both P < .001) at baseline and after 12 months, but not for FLAIR lesions (P = .08) or pure FLAIR lesions (P = .63). A detailed overview of mean T1-RTs in FLAIR lesions, BHs, pure FLAIR lesions, and CE-Ls at baseline and follow-up is given in Fig 2 and On-line Tables 1 and 2.

Fig 2.
  • Download figure
  • Open in new tab
  • Download powerpoint
Fig 2.

Boxplots showing T1 relaxation times at baseline and after 12-month follow-up for different lesion types. P values were calculated by using a paired t test.

There were no significant associations for changes in T1-RTs in BHs and NAWM or any other lesion type.

Clinical Measurements

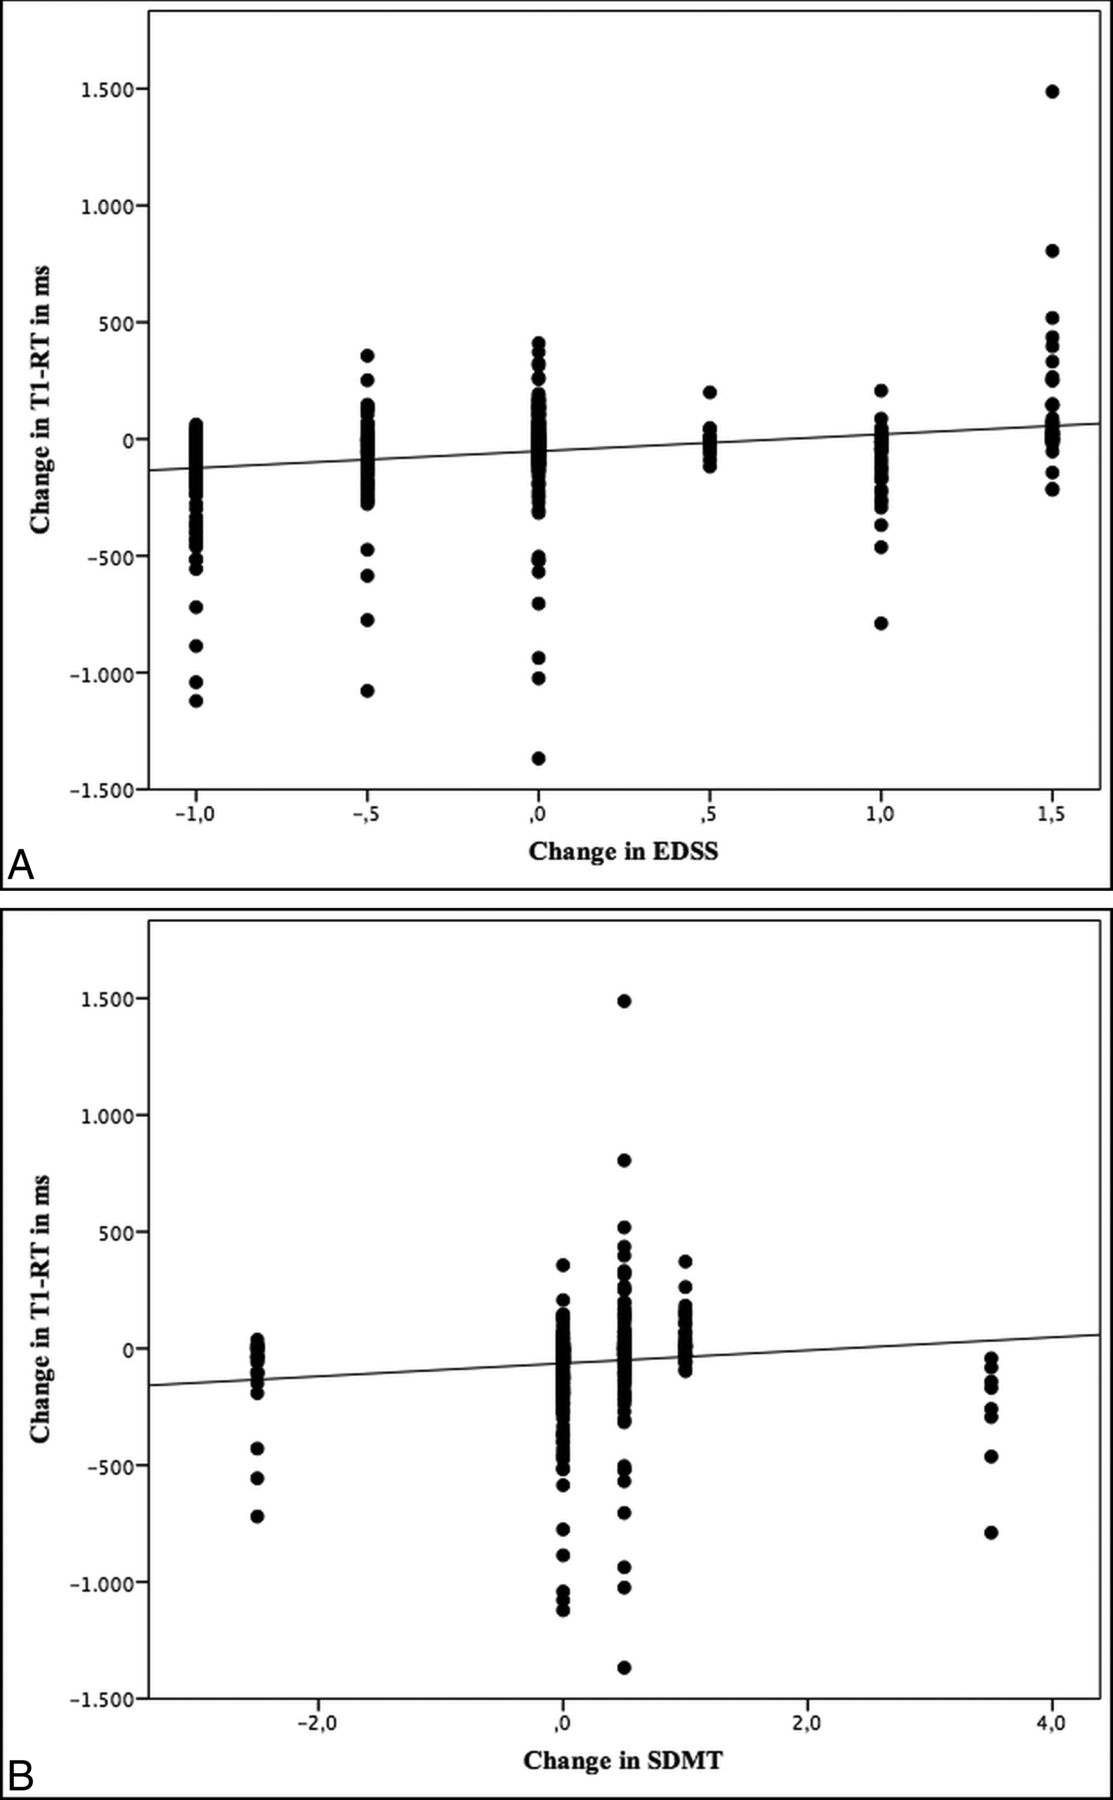
EDSS scores were obtained for all patients at baseline and follow-up. The mean EDSS score at baseline was 2.21 and changed only marginally to 2.18 after 12 months. In a subset of 14 patients, the SDMT was available. A mean SDMT-SD at baseline of −0.07 slightly increased to 0.21 after 12 months. With the Jonckheere-Terpstra Test, better clinical scores in EDSS and SDMT were associated with decreasing T1-RTs in BHs (P < .001) (Fig 3). However, there were no significant differences for changes in T1-RTs in NAWM, FLAIR lesions, pure FLAIR lesions, or CE-Ls.

Fig 3.
  • Download figure
  • Open in new tab
  • Download powerpoint
Fig 3.

Scatterplots showing an association between lesional changes in T1 relaxation times and clinical scores.

Discussion

For monitoring disease progression and the effectiveness of pharmaceutical treatment in MS, the number of T2, T1, and contrast-enhancing lesions presents a relevant diagnostic tool in clinical routine. However, with routinely used semiquantitative MS imaging biomarkers such as T1 and T2 lesion load or the number of FLAIR lesions and CE-Ls, clinical-radiologic correlations are still limited because MS lesions have histopathologic diversity.20⇓–22 Therefore, nonconventional MR imaging measures such as T1-RT have shown some promising results in cross-sectional and longitudinal studies to improve correlations with disability in patients with MS.12,13,23,24 The purpose of this study was to present T1-RT changes in MS lesions for 12 months and, secondly, to show the association of T1-RT changes with clinical disability.

At baseline the highest lesional T1 values were detected in BHs, while the lowest values were measured in CE-Ls; this finding confirms the findings of Blystad et al (2016).25 Due to severe tissue destruction, demyelination, and an increase in free water, T1-RTs are expected to be elevated in BHs. In contrast, CE-Ls represent an active inflammation process, associated with an accumulation of inflammatory cells, resulting in lower T1-RTs compared with FLAIR lesions or BHs.26

T1-RT alterations were observed in all lesion types and NAWM after 12 months compared with baseline. While T1-RTs in NAWM, BHs, and CE-Ls significantly decreased across time, FLAIR lesions and pure FLAIR lesions did not show meaningful changes of T1-RTs in 12-month follow-up. Our observations are in line with those in former studies, which reported increasing signal intensities of MS lesions in T1WI (comparable with decreasing T1-RTs) in up to 74% of initially T1WI hypointense lesions.27⇓–29 Although we did not evaluate the relative signal intensity, we observed decreasing T1-RTs in 66% of all BHs, in 82% of all CE-Ls, and in 54% of pure FLAIR lesions. However, little is known about decreasing T1-RTs in MS lesions. Bitsch et al (2001)5 and Barkhof et al (2003)7 demonstrated in histopathologic studies that the intensity of an MS lesion, and therefore its T1-RT, depends, to some extent, on the degree of its myelination. While the intensity of the lesion was decreased in demyelinated lesions, it showed an increase in remyelinated lesions. Remyelination is described as a frequent phenomenon in MS and can be extensive in subsets of patients with MS.7,30⇓⇓–33 We assume that decreasing T1-RTs in MS lesions depend, to some extent, on the level of remyelination in the lesion itself and might therefore indicate neuronal recovery.

Certainly, other pathologic processes such as resolution of edema, inflammation, or microstructural changes may influence T1-RT as well and might be the main reason for decreasing T1-RTs in CE-Ls. However, why overall T1-RTs are stable in pure FLAIR lesions but decrease in BHs remains unclear. One possible explanation could be that BHs represent a bygone, inactive inflammatory process with extensive tissue damage and prevailing neuronal recovery, whereas pure FLAIR lesions still have the potential for ongoing demyelination. This assumption is supported by histopathologic findings from Jonkman et al (2015),34 who observed lower T1-RTs in preactive and active lesions than in chronic inactive lesions, classifying pure FLAIR lesions with smaller T1-RTs as active lesions with ongoing demyelination and BHs with higher T1-RTs as rather chronic inactive lesions.

In this study, we found a significant association between improving clinical status and decreasing T1 values in BHs. So far, studies focusing on changes of T1-RTs in MS lesions and their impact on clinical status are lacking. Manfredonia et al (2007)14 observed T1 values in normal-appearing white and gray matter during a 2-year follow-up in patients with primary-progressive MS and found a significant correlation between increasing T1-RTs and clinical impairment. However, Manfredonia et al did not evaluate T1-RTs within MS lesions and included only patients with primary-progressive MS, which might explain the significant increase in T1-RTs, because progressive subtypes of MS are associated with greater damage to white matter. Also, all individuals in our study cohort were treated with dimethyl fumarate, which significantly reduces disease activity as measured by MR imaging in patients with relapsing-remitting MS35,36 and might be a reasonable explanation for decreasing T1 values in NAWM and BHs in our study cohort.

As mentioned before, we hypothesized that changes in T1-RT at least partially represent some changes in the degree of myelination. In contrast to Manfredonia et al,14 we predominantly observed decreasing T1 values in NAWM and BHs. However, it is still unclear whether remyelination leads to functional recovery in humans because there is no approved method to measure the degree of demyelination/remyelination in vivo. Yet, promising results were reported in experimental animal models, demonstrating an association between remyelination and functional recovery.37⇓–39 To support our findings and especially to confirm an association of lesion evolution and clinical status and to gain deeper insight into the underlying histopathologic process, additional longitudinal studies, including measurements of other quantitative MR imaging parameters such as diffusion tensor imaging, magnetization transfer ratio, and myelin water imaging, are needed.

There was no significant association between the appearance of new FLAIR lesions after 12 months and changes in clinical status. However, when one assesses new lesions in MS, their strategic location is an important feature when correlating with clinical changes.13,40,41 It was not the purpose of this study to evaluate the influence of single lesion locations on clinical disability but rather to search for new strategies to assess lesion quality and evolution. Nevertheless, further investigations of the localization of lesions are needed for a better understanding of their clinical impact.

To generate T1 maps, we acquired MP2RAGE sequences, which create a homogeneous T1-weighted contrast with an intrinsic correction of B1 inhomogeneities and reduce residual proton density and T2* weighting. T1 values measured in MP2RAGE sequences are highly reproducible both across subjects and within the same subject by using different scanning parameters; this feature makes these sequences applicable to longitudinal studies.15

Conclusions

T1-RT is a useful quantitative MR imaging technique that helps detect changes in MS lesions with time. We assume that these changes are associated with remyelination in the lesions themselves and are predominantly found in BHs rather than in FLAIR lesions or pure FLAIR lesions. Supporting this hypothesis, changes in T1-RT were associated with clinical status, possibly indicating neuronal and even functional recovery. To confirm our findings, further emphasis should be on combining T1-RT with other nonconventional MR imaging techniques such as magnetization transfer ratio, DTI, and myelin water imaging to gain further knowledge of myelin measurement in vivo. Undoubtedly, histopathologic studies would provide the best evidence to verify these MR imaging techniques but are naturally limited.

Footnotes

  • Disclosures: Christian Thaler—UNRELATED: Support for Travel to Meetings for the Study or Other Purposes: Deutsche Gesellschaft für Neuroradiologie (German Society of Neuroradiology), Comments: travel grant to present study results at the Annual Meeting of the American Society of Neuroradiology in 2016 in Washington, DC. Christoph Heesen—UNRELATED: Grant: German Ministry of Education and Research, Comments: Analysis was part of a Phase II study on boswellic acids in MS.* Jan-Patrick Stellmann—UNRELATED: Consultancy: Genzyme; Grants/Grants Pending: Biogen, Genzyme*; Payment for Lectures including Service on Speakers Bureaus: Biogen, Genzyme; Travel/Accommodations/Meeting Expenses Unrelated to Activities Listed: Novartis. *Money paid to the institution.

References

  1. 1.↵
    1. MacKay A,
    2. Laule C,
    3. Vavasour I, et al
    . Insights into brain microstructure from the T2 distribution. Magn Reson Imaging 2006;24:515–25 doi:10.1016/j.mri.2005.12.037 pmid:16677958
    CrossRefPubMed
  2. 2.↵
    1. Laule C,
    2. Leung E,
    3. Lis DK, et al
    . Myelin water imaging in multiple sclerosis: quantitative correlations with histopathology. Mult Scler 2006;12:747–53 doi:10.1177/1352458506070928 pmid:17263002
    Abstract/FREE Full Text
  3. 3.↵
    1. De Groot CJ,
    2. Bergers E,
    3. Kamphorst W, et al
    . Post-mortem MRI-guided sampling of multiple sclerosis brain lesions: increased yield of active demyelinating and (p)reactive lesions. Brain 2001;124:1635–45 doi:10.1093/brain/124.8.1635 pmid:11459754
    Abstract/FREE Full Text
  4. 4.↵
    1. van Walderveen MA,
    2. Kamphorst W,
    3. Scheltens P
    . Histopathologic correlate of hypointense lesions on T1-weighted spin-echo MRI in multiple sclerosis. Neurology 1998;50:1282–88 doi:10.1212/WNL.50.5.1282 pmid:9595975
    Abstract/FREE Full Text
  5. 5.↵
    1. Bitsch A,
    2. Kuhlmann T,
    3. Stadelmann C, et al
    . A longitudinal MRI study of histopathologically defined hypointense multiple sclerosis lesions. Ann Neurol 2001;49:793–96 doi:10.1002/ana.1053 pmid:11409432
    CrossRefPubMed
  6. 6.↵
    1. Faizy TD,
    2. Thaler C,
    3. Kumar D, et al
    . Heterogeneity of multiple sclerosis lesions in multislice myelin water imaging. PLoS One 2016;11:e0151496 doi:10.1371/journal.pone.0151496 pmid:26990645
    CrossRefPubMed
  7. 7.↵
    1. Barkhof F,
    2. Bruck W,
    3. De Groot CJ, et al
    . Remyelinated lesions in multiple sclerosis: magnetic resonance image appearance. Arch Neurol 2003;60:1073–81 doi:10.1001/archneur.60.8.1073 pmid:12925362
    CrossRefPubMed
  8. 8.↵
    1. Riva M,
    2. Ikonomidou VN,
    3. Ostuni JJ, et al
    . Tissue-specific imaging is a robust methodology to differentiate in vivo T1 black holes with advanced multiple sclerosis-induced damage. AJNR Am J Neuroradiol 2009;30:1394–401 doi:10.3174/ajnr.A1573 pmid:19406765
    Abstract/FREE Full Text
  9. 9.↵
    1. Naruse S,
    2. Horikawa Y,
    3. Tanaka C, et al
    . Proton nuclear magnetic resonance studies on brain edema. J Neurosurg 1982;56:747–52 doi:10.3171/jns.1982.56.6.0747 pmid:6281400
    CrossRefPubMed
  10. 10.↵
    1. Schmierer K,
    2. Scaravilli F,
    3. Altmann DR, et al
    . Magnetization transfer ratio and myelin in postmortem multiple sclerosis brain. Ann Neurol 2004;56:407–15 doi:10.1002/ana.20202 pmid:15349868
    CrossRefPubMed
  11. 11.↵
    1. Schmierer K,
    2. Tozer DJ,
    3. Scaravilli F, et al
    . Quantitative magnetization transfer imaging in postmortem multiple sclerosis brain. J Magn Reson Imaging 2007;26:41–51 doi:10.1002/jmri.20984 pmid:17659567
    CrossRefPubMed
  12. 12.↵
    1. Thaler C,
    2. Faizy T,
    3. Sedlacik J, et al
    . T1-thresholds in black holes increase clinical-radiological correlation in multiple sclerosis patients. PLoS One 2015 10:e0144693 doi:10.1371/journal.pone.0144693 pmid:26659852
    CrossRefPubMed
  13. 13.↵
    1. Parry A,
    2. Clare S,
    3. Jenkinson M, et al
    . MRI brain T1 relaxation time changes in MS patients increase over time in both the white matter and the cortex. J Neuroimaging 2003;13:234–39 doi:10.1111/j.1552-6569.2003.tb00184.x pmid:12889170
    CrossRefPubMed
  14. 14.↵
    1. Manfredonia F,
    2. Ciccarelli O,
    3. Khaleeli Z, et al
    . Normal-appearing brain T1 relaxation time predicts disability in early primary progressive multiple sclerosis. Arch Neurol 2007;64:411–15 doi:10.1001/archneur.64.3.411 pmid:17353385
    CrossRefPubMed
  15. 15.↵
    1. Marques JP,
    2. Kober T,
    3. Krueger G, et al
    . MP2RAGE, a self bias-field corrected sequence for improved segmentation and T1-mapping at high field. Neuroimage 2010;49:1271–81 doi:10.1016/j.neuroimage.2009.10.002 pmid:19819338
    CrossRefPubMed
  16. 16.↵
    1. Schmidt P,
    2. Gaser C,
    3. Arsic M, et al
    . An automated tool for detection of FLAIR-hyperintense white-matter lesions in multiple sclerosis. Neuroimage 2012;59:3774–83 doi:10.1016/j.neuroimage.2011.11.032 pmid:22119648
    CrossRefPubMed
  17. 17.↵
    1. Kappos L,
    2. Lechner-Scott J,
    3. Lienert C
    . Neurostatus. Neurostatus training and documentation DVD for a standardized neurological examination and assessment of Kurtzke's functional systems and expanded disability status scale for MS patients. 2002, 2007, Basel, Switzerland. http://neurostatus.net. Accessed January 6, 2015; 2015.
  18. 18.↵
    1. Helmuth J
    1. Smith A
    . The symbol-digit modalities test: a neuropsychologic test of learning and other cerebral disorders. In Helmuth J, ed. Learning Disorders. Seattle: Special Child Publications; 1968;83–91
  19. 19.↵
    1. Jonckheere AR
    . A distribution-free K-sample test against ordered alternatives. Biometrika 1954;41:133–45 doi:10.2307/2333011
    FREE Full Text
  20. 20.↵
    1. Miller DH,
    2. Altmann DR,
    3. Chard DT
    . Advances in imaging to support the development of novel therapies for multiple sclerosis. Clin Pharmacol Ther 2012;91:621–34 doi:10.1038/clpt.2011.349 pmid:22398971
    CrossRefPubMed
  21. 21.↵
    1. Galego O,
    2. Gouveia A,
    3. Batista S, et al
    . Brain atrophy and physical disability in primary progressive multiple sclerosis: a volumetric study. Neuroradiol J 2015;28:354–58 doi:10.1177/1971400915594984 pmid:26246109
    Abstract/FREE Full Text
  22. 22.↵
    1. McFarland HF,
    2. Barkhof F,
    3. Antel J, et al
    . The role of MRI as a surrogate outcome measure in multiple sclerosis. Mult Scler 2002;8:40–51 doi:10.1191/1352458502ms767xx pmid:11936488
    Abstract/FREE Full Text
  23. 23.↵
    1. Steenwijk MD,
    2. Vrenken H,
    3. Jonkman LE, et al
    . High-resolution T1-relaxation time mapping displays subtle, clinically relevant, gray matter damage in long-standing multiple sclerosis. Mult Scler 2016;22:1279–88 doi:10.1177/1352458515615953 pmid:26564997
    Abstract/FREE Full Text
  24. 24.↵
    1. Simioni S,
    2. Amarù F,
    3. Bonnier G, et al
    . MP2RAGE provides new clinically-compatible correlates of mild cognitive deficits in relapsing-remitting multiple sclerosis. J Neurol 2014;261:1606–13 doi:10.1007/s00415-014-7398-4 pmid:24912471
    CrossRefPubMed
  25. 25.↵
    1. Blystad I,
    2. Håkansson I,
    3. Tisell A, et al
    . Quantitative MRI for analysis of active multiple sclerosis lesions without gadolinium-based contrast agent. AJNR Am J Neuroradiol 2016;37:94–100 doi:10.3174/ajnr.A4501 pmid:26471751
    Abstract/FREE Full Text
  26. 26.↵
    1. Filippi M,
    2. Rocca MA,
    3. Barkhof F, et al
    ; Attendees of the Correlation between Pathological MRI Findings in MS workshop. Association between pathological and MRI findings in multiple sclerosis. Lancet Neurol 2012;11:349–60 doi:10.1016/S1474-4422(12)70003-0 pmid:22441196
    CrossRefPubMed
  27. 27.↵
    1. Bagnato F,
    2. Jeffries N,
    3. Richert ND, et al
    . Evolution of T1 black holes in patients with multiple sclerosis images monthly for 4 years. Brain 2003;126:1782–89 doi:10.1093/brain/awg182 pmid:12821527
    Abstract/FREE Full Text
  28. 28.↵
    1. van Waesberghe JH,
    2. van Walderveen MA,
    3. Castelijns JA, et al
    . Patterns of lesion development in multiple sclerosis: longitudinal observations with T1-weighted spin-echo and magnetization transfer MR. AJNR Am J Neuroradiol 1998;19:675–83 pmid:9576653
    Abstract
  29. 29.↵
    1. Rovira A,
    2. Alonso J,
    3. Cucurella G, et al
    . Evolution of multiple sclerosis lesions on serial contrast-enhanced T1-weighted and magnetization-transfer MR images. AJNR Am J Neuroradiol 1999;20:1939–45 pmid:10588122
    Abstract/FREE Full Text
  30. 30.↵
    1. Raine CS,
    2. Wu E
    . Mutlitple sclerosis: remyelination in acute lesions. J Neuropathol Exp Neurol 1993;52:199–204 doi:10.1097/00005072-199305000-00003 pmid:7684075
    CrossRefPubMed
  31. 31.↵
    1. Lassmann W,
    2. Brück W,
    3. Luchinetti C, et al
    . Remyelination in multiple sclerosis. Mult Scler 1997;3:133–36 doi:10.1177/135245859700300213 pmid:9291167
    Abstract/FREE Full Text
  32. 32.↵
    1. Patrikios P,
    2. Stadelmann C,
    3. Kutzelnigg A, et al
    . Remyelination is extensive in a subset of multiple sclerosis patients. Brain 2006;129:3165–72 doi:10.1093/brain/awl217 pmid:16921173
    Abstract/FREE Full Text
  33. 33.↵
    1. Fox RJ,
    2. Cronin T,
    3. Lin J, et al
    . Measuring myelin repair and axonal loss with diffusion tensor imaging. AJNR Am J Neuroradiol 2011;32:85–91 doi:10.3174/ajnr.A2238 pmid:20947644
    Abstract/FREE Full Text
  34. 34.↵
    1. Jonkman LE,
    2. Soriano AL,
    3. Amor S, et al
    . Can MS lesion stages be distinguished with MRI? A postmortem MRI and histopathology study. J Neurol 2015;262:1074–80 doi:10.1007/s00415-015-7689-4 pmid:25761376
    CrossRefPubMed
  35. 35.↵
    1. Gold R,
    2. Kappos L,
    3. Arnold DL, et al
    ; DEFINE Study Investigators. Placebo-controlled phase 3 study of oral BG-12 for relapsing multiple sclerosis. N Engl J Med 2012;367:1098–107 doi:10.1056/NEJMoa1114287 pmid:22992073
    CrossRefPubMed
  36. 36.↵
    1. Bar-Or A,
    2. Gold R,
    3. Kappos L, et al
    . Clinical efficacy of BG-12 (dimethyl fumarate) in patients with relapsing-remitting multiple sclerosis: subgroup analyses of the DEFINE study. J Neurol 2013;260:2297–305 doi:10.1007/s00415-013-6954-7 pmid:23797999
    CrossRefPubMed
  37. 37.↵
    1. Duncan ID,
    2. Brower A,
    3. Kondo Y, et al
    . Extensive remyelination of the CNS leads to functional recovery. Proc Natl Acad Sci U S A 2009;106:6832–36 doi:10.1073/pnas.0812500106 pmid:19342494
    Abstract/FREE Full Text
  38. 38.↵
    1. Liebetanz D,
    2. Merkler D
    . Effects of commissural de- and remyelination on motor skill behaviour in the cuprizone mouse model of multiple sclerosis. Exp Neurol 2006;202:217–24 doi:10.1016/j.expneurol.2006.05.032 pmid:16857191
    CrossRefPubMed
  39. 39.↵
    1. Murray PD,
    2. McGavern DB,
    3. Sathornsumetee S, et al
    . Spontaneous remyelination following extensive demyelination is associated with improved neurological function in a viral model of multiple sclerosis. Brain 2001;124(pt 7):1403–16 doi:10.1093/brain/124.7.1403 pmid:11408335
    Abstract/FREE Full Text
  40. 40.↵
    1. Roosendaal SD,
    2. Moraal B,
    3. Pouwels PJ, et al
    . Accumulation of cortical lesions in MS: relation with cognitive impairment. Mult Scler 2009;15:708–14 doi:10.1177/1352458509102907 pmid:19435749
    Abstract/FREE Full Text
  41. 41.↵
    1. Rovaris M,
    2. Filippi M,
    3. Minicucci L, et al
    . Cortical/subcortical disease burden and cognitive impairment in patients with multiple sclerosis. AJNR Am J Neuroradiol 2000;21:402–08 pmid:10696031
    Abstract/FREE Full Text
  • Received June 16, 2016.
  • Accepted after revision September 8, 2016.
  • © 2017 by American Journal of Neuroradiology
View Abstract
PreviousNext
Back to top

In this issue

American Journal of Neuroradiology: 38 (2)
American Journal of Neuroradiology
Vol. 38, Issue 2
1 Feb 2017
  • Table of Contents
  • Index by author
  • Complete Issue (PDF)
Advertisement
Print
Download PDF
Email Article

Thank you for your interest in spreading the word on American Journal of Neuroradiology.

NOTE: We only request your email address so that the person you are recommending the page to knows that you wanted them to see it, and that it is not junk mail. We do not capture any email address.

Enter multiple addresses on separate lines or separate them with commas.
T1 Recovery Is Predominantly Found in Black Holes and Is Associated with Clinical Improvement in Patients with Multiple Sclerosis
(Your Name) has sent you a message from American Journal of Neuroradiology
(Your Name) thought you would like to see the American Journal of Neuroradiology web site.
CAPTCHA
This question is for testing whether or not you are a human visitor and to prevent automated spam submissions.
Cite this article
C. Thaler, T.D. Faizy, J. Sedlacik, B. Holst, K. Stürner, C. Heesen, J.-P. Stellmann, J. Fiehler, S. Siemonsen
T1 Recovery Is Predominantly Found in Black Holes and Is Associated with Clinical Improvement in Patients with Multiple Sclerosis
American Journal of Neuroradiology Feb 2017, 38 (2) 264-269; DOI: 10.3174/ajnr.A5004

Citation Manager Formats

  • BibTeX
  • Bookends
  • EasyBib
  • EndNote (tagged)
  • EndNote 8 (xml)
  • Medlars
  • Mendeley
  • Papers
  • RefWorks Tagged
  • Ref Manager
  • RIS
  • Zotero
0 Responses
Respond to this article
Share
Bookmark this article
T1 Recovery Is Predominantly Found in Black Holes and Is Associated with Clinical Improvement in Patients with Multiple Sclerosis
C. Thaler, T.D. Faizy, J. Sedlacik, B. Holst, K. Stürner, C. Heesen, J.-P. Stellmann, J. Fiehler, S. Siemonsen
American Journal of Neuroradiology Feb 2017, 38 (2) 264-269; DOI: 10.3174/ajnr.A5004
del.icio.us logo Twitter logo Facebook logo Mendeley logo
  • Tweet Widget
  • Facebook Like
  • Google Plus One
Purchase

Jump to section

  • Article
    • Abstract
    • ABBREVIATIONS:
    • Materials and Methods
    • Results
    • Discussion
    • Conclusions
    • Footnotes
    • References
  • Figures & Data
  • Supplemental
  • Info & Metrics
  • Responses
  • References
  • PDF

Related Articles

  • PubMed
  • Google Scholar

Cited By...

  • A multi-scale sub-voxel perfusion model to estimate diffusive capillary wall conductivity in multiple sclerosis lesions from perfusion MRI data
  • Crossref (22)
  • Google Scholar

This article has been cited by the following articles in journals that are participating in Crossref Cited-by Linking.

  • Quantitative magnetic resonance imaging towards clinical application in multiple sclerosis
    Cristina Granziera, Jens Wuerfel, Frederik Barkhof, Massimiliano Calabrese, Nicola De Stefano, Christian Enzinger, Nikos Evangelou, Massimo Filippi, Jeroen J G Geurts, Daniel S Reich, Maria A Rocca, Stefan Ropele, Àlex Rovira, Pascal Sati, Ahmed T Toosy, Hugo Vrenken, Claudia A M Gandini Wheeler-Kingshott, Ludwig Kappos, F Barkhof, N de Stefano, J Sastre-Garriga, O Ciccarelli, C Enzinger, M Filippi, Claudio Gasperini, L Kappos, J Palace, H Vrenken, À Rovira, M A Rocca, T Yousry
    Brain 2021 144 5
  • Simultaneous lesion and brain segmentation in multiple sclerosis using deep neural networks
    Richard McKinley, Rik Wepfer, Fabian Aschwanden, Lorenz Grunder, Raphaela Muri, Christian Rummel, Rajeev Verma, Christian Weisstanner, Mauricio Reyes, Anke Salmen, Andrew Chan, Franca Wagner, Roland Wiest
    Scientific Reports 2021 11 1
  • T1/T2-weighted ratio in multiple sclerosis: A longitudinal study with clinical associations
    Mateus Boaventura, Jaume Sastre-Garriga, Aran Garcia-Vidal, Angela Vidal-Jordana, Davide Quartana, René Carvajal, Cristina Auger, Manel Alberich, Mar Tintoré, Àlex Rovira, Xavier Montalban, Deborah Pareto
    NeuroImage: Clinical 2022 34
  • Using personalized prognosis in the treatment of relapsing multiple sclerosis: A practical guide
    Bart Van Wijmeersch, Hans-Peter Hartung, Patrick Vermersch, Maura Pugliatti, Carlo Pozzilli, Nikolaos Grigoriadis, Mona Alkhawajah, Laura Airas, Ralf Linker, Celia Oreja-Guevara
    Frontiers in Immunology 2022 13
  • Rim lesions are demonstrated in early relapsing–remitting multiple sclerosis using 3 T-based susceptibility-weighted imaging in a multi-institutional setting
    Koy Chong Ng Kee Kwong, Daisy Mollison, Rozanna Meijboom, Elizabeth N. York, Agniete Kampaite, Sarah-Jane Martin, David P. J. Hunt, Michael J. Thrippleton, Siddharthan Chandran, Adam D. Waldman
    Neuroradiology 2022 64 1
  • A multimodal approach to assess the validity of atrophied T2-lesion volume as an MRI marker of disease progression in multiple sclerosis
    Eleonora Tavazzi, Niels Bergsland, Jens Kuhle, Dejan Jakimovski, Murali Ramanathan, Aleksandra M. Maceski, Davorka Tomic, Jesper Hagemeier, Harald Kropshofer, David Leppert, Michael G. Dwyer, Bianca Weinstock-Guttman, Ralph H. B. Benedict, Robert Zivadinov
    Journal of Neurology 2020 267 3
  • Predictive MRI Biomarkers in MS—A Critical Review
    Vlad Eugen Tiu, Iulian Enache, Cristina Aura Panea, Cristina Tiu, Bogdan Ovidiu Popescu
    Medicina 2022 58 3
  • Gray matter atrophy in multiple sclerosis despite clinical and lesion stability during natalizumab treatment
    Fredrika Koskimäki, Jacqueline Bernard, Jeong Yong, Nancy Arndt, Timothy Carroll, Seon-Kyu Lee, Anthony T. Reder, Adil Javed, Niels Bergsland
    PLOS ONE 2018 13 12
  • The use of multiparametric quantitative magnetic resonance imaging for evaluating visually assigned lesion groups in patients with multiple sclerosis
    Christian Thaler, Tobias D. Faizy, Jan Sedlacik, Maxim Bester, Jan-Patrick Stellmann, Christoph Heesen, Jens Fiehler, Susanne Siemonsen
    Journal of Neurology 2018 265 1
  • A multiscale subvoxel perfusion model to estimate diffusive capillary wall conductivity in multiple sclerosis lesions from perfusion MRI data
    Timo Koch, Bernd Flemisch, Rainer Helmig, Roland Wiest, Dominik Obrist
    International Journal for Numerical Methods in Biomedical Engineering 2020 36 2

More in this TOC Section

  • Diagnostic Neuroradiology of Monoclonal Antibodies
  • Clinical Outcomes After Chiari I Decompression
  • Segmentation of Brain Metastases with BLAST
Show more ADULT BRAIN

Similar Articles

Advertisement

Indexed Content

  • Current Issue
  • Accepted Manuscripts
  • Article Preview
  • Past Issues
  • Editorials
  • Editor's Choice
  • Fellows' Journal Club
  • Letters to the Editor
  • Video Articles

Cases

  • Case Collection
  • Archive - Case of the Week
  • Archive - Case of the Month
  • Archive - Classic Case

More from AJNR

  • Trainee Corner
  • Imaging Protocols
  • MRI Safety Corner

Multimedia

  • AJNR Podcasts
  • AJNR Scantastics

Resources

  • Turnaround Time
  • Submit a Manuscript
  • Submit a Video Article
  • Submit an eLetter to the Editor/Response
  • Manuscript Submission Guidelines
  • Statistical Tips
  • Fast Publishing of Accepted Manuscripts
  • Graphical Abstract Preparation
  • Imaging Protocol Submission
  • Evidence-Based Medicine Level Guide
  • Publishing Checklists
  • Author Policies
  • Become a Reviewer/Academy of Reviewers
  • News and Updates

About Us

  • About AJNR
  • Editorial Board
  • Editorial Board Alumni
  • Alerts
  • Permissions
  • Not an AJNR Subscriber? Join Now
  • Advertise with Us
  • Librarian Resources
  • Feedback
  • Terms and Conditions
  • AJNR Editorial Board Alumni

American Society of Neuroradiology

  • Not an ASNR Member? Join Now

© 2025 by the American Society of Neuroradiology All rights, including for text and data mining, AI training, and similar technologies, are reserved.
Print ISSN: 0195-6108 Online ISSN: 1936-959X

Powered by HighWire