
Abstract
BACKGROUND AND PURPOSE: A number of parameters derived from dynamic contrast-enhanced MR imaging and separate histologic features have been identified as potential prognosticators in high-grade glioma. This study evaluated the relationships between dynamic contrast-enhanced MRI–derived parameters and histologic features in glioblastoma multiforme.
MATERIALS AND METHODS: Twenty-eight patients with newly presenting glioblastoma multiforme underwent preoperative imaging (conventional imaging and T1 dynamic contrast-enhanced MRI). Parametric maps of the initial area under the contrast agent concentration curve, contrast transfer coefficient, estimate of volume of the extravascular extracellular space, and estimate of blood plasma volume were generated, and the enhancing fraction was calculated. Surgical specimens were used to assess subtype and were graded (World Health Organization classification system) and were assessed for necrosis, cell density, cellular atypia, mitotic activity, and overall vascularity scores. Quantitative assessment of endothelial surface area, vascular surface area, and a vascular profile count were made by using CD34 immunostaining. The relationships between MR imaging parameters and histopathologic features were examined.
RESULTS: High values of contrast transfer coefficient were associated with the presence of frank necrosis (P = .005). High values of the estimate of volume of the extravascular extracellular space were associated with a fibrillary histologic pattern (P < .01) and with increased mitotic activity (P < .05). No relationship was found between mitotic activity and histologic pattern, suggesting that the correlation between the estimate of volume of the extravascular extracellular space and mitotic activity was independent of the histologic pattern.
CONCLUSIONS: A correlation between the estimate of volume of the extravascular extracellular space and mitotic activity is reported. Further work is warranted to establish how dynamic contrast-enhanced MRI parameters relate to more quantitative histologic measurements, including markers of proliferation and measures of vascular endothelial growth factor expression.
ABBREVIATIONS:
- DCE-MRI
- dynamic contrast-enhanced MRI
- EnF
- enhancing fraction
- GBM
- glioblastoma multiforme
- IAUC60
- initial area under the contrast agent concentration curve
- Ktrans
- contrast transfer coefficient
- ve
- volume of the extravascular extracellular space per unit tissue volume
- VEGF
- vascular endothelial growth factor
- vp
- volume of the blood plasma per unit tissue volume
Gliomas are the most common primary cerebral tumor of adulthood. They are histologically classified according to the World Health Organization criteria into tumor grade and subtype,1 which are important for determining appropriate treatment. Within given histologic subtypes and tumor grades, a number of additional descriptive histopathologic features have been identified as prognosticators, including mitotic activity,2⇓–4 microvascular density,5,6 and certain vascular patterns.7,8 Both proliferation markers, Ki-672⇓–4,7,9,10 and expression of vascular endothelial growth factor (VEGF),3,5,11⇓⇓–14 have also shown a relationship to survival.
Dynamic contrast-enhanced MR imaging (DCE-MR imaging) techniques generate a number of parameters that characterize the microvascular environment. The enhancing fraction (EnF) describes the proportion of perfused tumor tissue. CBV and CBF are commonly derived from dynamic susceptibility contrast techniques, while the volume transfer coefficient (Ktrans), fractional volume of the extravascular extracellular space (ve), and fractional blood plasma volume (vp) can be calculated from T1-weighted DCE-MR imaging.15 In glioma, Ktrans, vp, EnF, CBV, and CBF have been shown to relate to histologic grade and/or subtype of tumor.16⇓⇓⇓⇓–21 In addition, Ktrans, EnF, and CBV have been identified as potentially grade-independent prognosticators.22⇓⇓–25 The number of studies examining the relationship between DCE-MR imaging parameters and more specific histopathologic features in glioma is currently small and this research predominantly focuses on vascular metrics such as blood volume and flow; however, significant correlations have been described between CBV and microvascular density,26⇓⇓–29 VEGF expression,27,30 cell density,29 endothelial proliferation,31 and mitotic activity31 and between CBF and endothelial hyperplasia.32
More recent studies have focused on the potential of ve as an imaging biomarker. In glioma, it has shown value in discriminating histologic grades,33,34 but compared with other potential candidate biomarkers of the extravascular extracellular space volume (ADC), on a voxel by voxel basis, no correlation was seen between the 2 metrics, suggesting that these parameters provide independent information about extravascular extracellular space characteristics.35 Two separate studies of patients with gliomas of various histologic grades have both reported significant correlations between both Ktrans and ve and vascular and microvascular density,33,34 but neither study comments on the relationship with cellular density or mitotic activity. A high-field, 7T MR imaging study of rat xenografts showed an image-matched significant negative correlation between ve and tumor cellularity.36
We hypothesized the following: 1) Larger, rapidly growing tumors would show higher mitotic activity and high angiogenic activity reflected by Ktrans and EnF; and 2) more proliferative tumors would have a higher cellular density and mitotic activity associated with lower values of ve.
Materials and Methods
Patients
Ethical approval was obtained, and all patients gave informed consent. All tumors were histologically confirmed as glioblastoma multiforme (GBM) according to the World Health Organization criteria.1 All imaging was preoperative, and patients received no treatment other than corticosteroids, which were administered for a minimum of 48 hours before imaging to allow stabilization of the effects of steroids on DCE-MR imaging measures.37 Patients were excluded from the study if they had a history of renal dysfunction or low estimated glomerular filtration rate (<30 mL/min/1.73 m2).
MR Imaging Data Acquisition
Imaging was performed on a 3T Achieva system (Philips Healthcare, Best, the Netherlands) by using a sensitivity encoding head coil. DCE-MR imaging was acquired in a sagittal oblique orientation to allow improved definition of the arterial input function free from flow-related artifacts. Three precontrast T1 fast-field echo (radiofrequency spoiled gradient-echo) series (2°, 5°, 16°) were acquired for calculation of baseline T1 maps (TR, 3.5 ms; TE, 1.1 ms; section thickness, 4.2 mm; matrix, 128 × 128; FOV, 230 × 230 × 105 mm) in the same geometry. A dynamic, contrast-enhanced acquisition series (TR, 3.5 ms; TE, 1.1 ms; flip angle, 16°; section thickness, 4.2 mm; matrix, 128 × 128; FOV, 230 × 230 × 105 mm) consisting of 100 volumes with temporal spacing of approximately 3.4 seconds followed. A bolus dose of 0.1 mmol/kg (body weight) of gadolinium-based contrast agent (gadodiamide; Gd-DTPA-BMA; Omniscan; GE Healthcare, Piscataway, New Jersey) was injected at a rate of 3 mL/s, after acquisition of the fifth image volume. Pre- and postcontrast T1-weighted imaging sequences (TR, 9.3 ms; TE, 4.6 ms) were acquired in the same sagittal oblique geometry for definition of the volume of interest of the whole tumor.
MR Imaging Data Analysis
An experienced neuroradiologist (S.J.M.) manually defined VOIs for each tumor. The VOI corresponded to the enhancing tumor and all nonenhancing tissue contained within it on the postcontrast T1-weighted images. This technique of VOI definition has previously shown good interobserver agreement (intraclass correlation coefficient > 0.94).38 Pharmacokinetic analysis was performed on all pixels within the VOI that showed significant enhancement. Parametric maps of Ktrans, vp, ve, and initial area under the contrast agent concentration curve (IAUC60) were produced by using in-house software (MaDyM; Manchester Dynamic Modeling, Manchester, UK) and the extended Tofts and Kermode pharmacokinetic model.15 Automated arterial input functions were generated from an appropriately chosen section, which included the internal carotid artery.39 Summary statistics for each parameter were generated for enhancing tumor tissue.
For each tumor, EnF initial area under the contrast agent concentration curve (EnFIAUC60>0) and thresholded EnF (EnFIAUC60>2.5) were calculated by dividing the enhancing volume (volume of voxels with IAUC60 > 0 mmol/s for EnFIAUC60>0 and the volume of voxels with IAUC60 > 2.5 mmol/s for EnFIAUC60>2.5) by the total volume of the tumor VOI. The cutoff threshold of IAUC60 > 2.5 mmol/s for EnFIAUC60>2.5 was previously identified as an optimal threshold for allowing the distinction of high- from low-grade gliomas.40
Histopathologic Data Analysis
Two experienced neuropathologists (D.d.P. and P.P.) performed the histopathologic analysis. Histologic specimens were assessed for the following: necrosis (presence or absence of frank and/or geographic necrosis), cell density (3-point grading score), cell atypia (3-point grading score), mitotic activity (number of mitotic figures seen per 10 high-power-field units), infiltrates (presence or absence of lymphocytes and/or macrophages), tumor vascular pattern (presence or absence of the following features: endothelial hypertrophy and/or hyperplasia, glomeruloid structures, granulation tissue, large-vessel density, thrombosis, sclerosed vessels), an overall vascular density score (3-point grading score), and histologic pattern (fibrillar, gemistocytic, oligodendrocytes, sarcomatous, giant cells, and small cells) in conjunction with standard histopathologic subtyping and grading according to the World Health Organization classification criteria.1 Vascular and histologic features were not mutually exclusive; therefore, >1 feature could be described in a given tumor specimen.
Quantitative measurement of the endothelial surface area, the vascular surface area, and the vascular profile count per square millimeter was made by using CD34 immunostaining and dedicated image-analysis software.
Statistical Analysis
Statistical analysis was performed by using SPSS (Version 15.0; IBM, Armonk, New York) nonparametric statistical tests. While histologic parameters produce a binary classification (necrosis, infiltrates, vascular patterns, and histologic patterns), Mann-Whitney U tests were performed to test the hypothesis that MR imaging parameter values did not differ among groups. While histologic features produce categoric scores (cell density, cell atypia, and overall vascular score), multivariate analysis of variance was used to test the hypothesis that MR imaging parameter values did not differ among groups. Spearman correlation analysis was performed to assess the relationship between quantitative histologic measures (mitotic activity, endothelial surface area, vascular surface area, and vascular profile count per square millimeter) and MR imaging parameters and to identify correlations among the individual MR imaging measurements. For Mann-Whitney U and ANOVA testing, a result was considered significantly different with P < .01, given the number of variables assessed. For the Spearman correlation analysis, significance was <.05.
Results
Twenty-eight untreated newly presented GBMs were included in the study (10 women; age range, 38–76 years; mean, 60 years). Histologic specimens were obtained from 12 biopsies and 16 surgical debulkings. The results of statistical analyses for comparisons of histologic and MR imaging measures are summarized in the On-line Table.
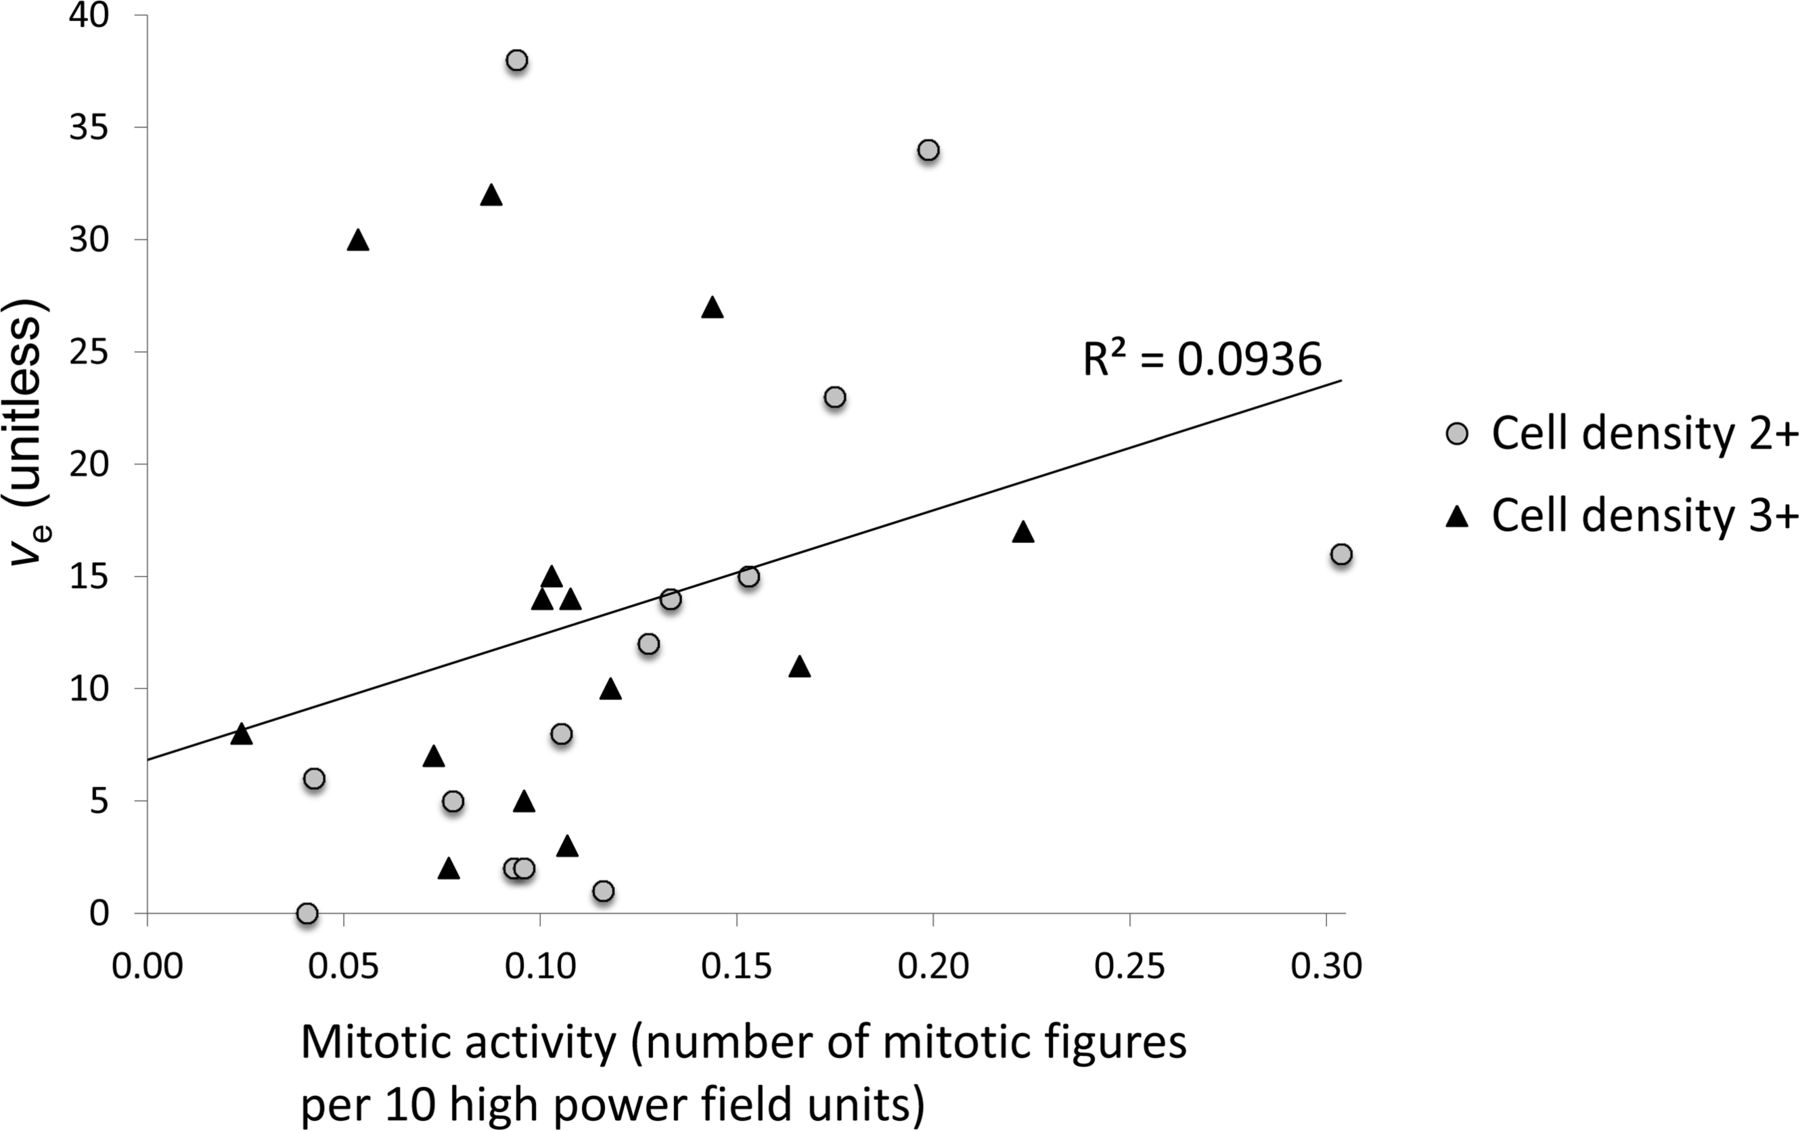
The presence of frank necrosis was associated with significantly higher values of Ktrans (P < .01, Fig 1). Significantly higher values of ve were seen in the presence of fibrillary histology (estimated P < .01, Fig 1). A positive correlation was found between ve and mitotic activity (P < .05, ρ = 0.470, Fig 2). No relationship was seen between mitotic activity and any of the descriptive or semiquantitative histology measures, suggesting that the relationship between ve and mitotic activity is independent of the relationship between ve and the presence of fibrillar histology. No correlation was observed between ve and cell density.

A, Boxplot of fibrillar histology and ve (estimated P = .007). Sample histologic specimens showing tumors without (B) and with (C) the presence of fibrils (small fibers measuring approximately 1 mm, black arrows, C). H&E stain ×40 magnification. D, Boxplot of frank necrosis and Ktrans (estimated P = .005).

Scatterplot of mitotic activity versus ve (P = .012, ρ = 0.470), marker shapes depict separate scores of cell density measures.
Cross-correlations between individual MR imaging parameters are summarized in Table 1. Positive correlations were found between Ktrans and all other MR imaging parameters. Significant correlations were present between ve and Ktrans (P < .05 and ρ = 0.450) and between vp and EnF. Mitotic activity did not correlate with any quantitative vascular measure, but cross-correlation was seen across all 3 histologic vascular metrics (Table 2). No other significant relationships were identified among histologic measures.
Cross-correlations of MRI parametersa
Cross-correlations of quantitative histologic measuresa
Discussion
While there has been considerable interest in the development of imaging biomarkers for use in clinical trials, most DCE-MR imaging studies have focused on identifying correlates of vascularity and angiogenesis.41 This study identified an unexpected positive correlation between ve, a parameter thought to reflect extravascular extracellular space volume, and mitotic activity. No relationships were identified among the previously described DCE-MR imaging prognosticators, Ktrans and vp, and mitotic activity or between vascular patterns and DCE-MR imaging measures.
The parameter ve is often overlooked in DCE-MR imaging studies. In cerebral tumors, it has the potential to distinguish intra- from extra-axial tumors42,43 and exhibits increased values with increasing tumor grade.33,34,42,44 It has also demonstrated sensitivity in identifying changes in response to treatment with corticosteroids, with decreases in ve presumably reflecting a reduction in interstitial edema.45,46 In a study of vestibular schwannomas, meningiomas, and gliomas, no direct measure of the extravascular extracellular space or cell density measure was made, but ve values in schwannoma were significantly larger than those in glioma, where cell density is higher.43 In a study comparing ve with ADC in glioma, no relationship was found between the 2 metrics, suggesting that these parameters may provide independent information about the extravascular extracellular space.35 This may reflect the existence of separate extravascular leakage compartments characterized by fast and slow contrast exchange rates, possibly reflecting the presence of slow leakage/diffusion into and out of necrotic tumor spaces.42,47,48 Previous studies have also reported correlations between microvascular density and both ve and Ktrans.33,34 We did not find this correlation in our study, but there was a cross-correlation between the DCE-MR imaging parameters ve and Ktrans, raising the possibility that the correlation reported in the previous studies reflects the relationship of ve with Ktrans rather than microvascular density. A previous rat xenograft study has reported a correlation between ve and cellular density,36 but our current study found no such relationship.
Histologic measures of cell density are often a count of the number of cell nuclei per unit area and without quantification of the amount of tissue the cells occupy; thus, an increase in histologic cell density may reflect an increase in the number of cells, but not necessarily a decrease in extravascular extracellular space if the cells are small. There are potential modeling problems associated with the calculation of ve. Clearly it can be estimated only in perfused tissue where there is significant leakage of contrast agent.35 This problem means that summary statistics presented in this and other studies reflect only perfused tissue with contrast agent leakage, in contrast to diffusion-weighted imaging, in which high ADC values are seen in association with necrosis. We have specifically excluded nonperfusing tissue from estimates of summary statistics, which could otherwise produce artificially low values of ve. In addition, the relatively low dynamic sampling duration (6 minutes) will affect ve estimates to some degree. First, model fitting errors (assuming that the model is correct) will result from undersampling, but modeling studies suggest that these fitting errors are likely to be very small.49 Second, short sampling times will lead to relative under-representation of slow tissue exchange compartments, which would tend to reduce the impact of necrotic tissue on ve estimations as described in several studies.42,47,48 These potential model fitting errors and short sampling times imply that tumors with greater necrosis would have shown higher ve values if sampling had continued for a longer time and that the measured values of ve in this study are more likely to reflect the extravascular extracellular space fraction in viable tissue.
The positive correlation between ve and mitotic activity is surprising. Tumors with larger ve values exhibited more mitotic activity, the inverse of what one might expect (and the inverse of our initial hypothesis), whereby more proliferative tumors would be more densely packed with cells. Neither mitotic activity nor ve related to the presence of necrosis, though the lack of a relationship between ve and necrosis may, in part, reflect the relatively low dynamic collection period (see above). These observations suggest that the size of the extravascular extracellular space in perfused enhancing tumor tissue is truly related to mitotic rate and not simply a reflection of elevated measures of ve due to increased necrosis in rapidly proliferating tumors.
This suggestion is initially counterintuitive. In normally developing tissues, mitotic activity is higher in areas of low cell packing due to the inhibition of proliferation in response to cell-to-cell contact, a process known as contact inhibition of proliferation in developing normal tissue.50 No similar relationship has been described in malignant tissues, and loss of contact inhibition of mitosis is one of the hallmarks of the cancer cell.51 This finding leads to the hypothesis, stated in the introduction, that rapidly proliferating tumors will continue to proliferate, leading to increased cell density and a decreased size of the extravascular extracellular space and consequently of ve. We have no evidence to explain why the observed relationship should exist. One possible explanation may be that tumors with high cellular density still have impaired responses to tumoral growth factors despite loss of contact inhibition of proliferation.52 Another possible explanation is that tumors with short mitotic cycles are characterized by a reduced time for cellular maturation, resulting in smaller cells and reduced cell packing. Whatever the underlying biologic mechanism, this finding appears particularly interesting and requires further study.
The ability to obtain an MR imaging–based biomarker of mitotic activity and/or tumor cell proliferation is highly desirable. The findings presented here may be tumor-specific or reflect an unrecognized phenotype, but the possibility that ve may be a potential marker of mitotic activity merits further evaluation.
The data also demonstrated a positive relationship between the presence of tumor cell fibrils within the histologic specimens and higher ve, though the numbers were very small (n = 4). Fibrillar cell processes are cell extensions containing cytoplasm, which are surrounded by cell membranes. These are visible through a microscope and allow tumor astrocytes to be recognized as “fibrillar.” A less cell-dense arrangement due to such cell extensions and/or intercellular edema facilitate its recognition via light microscopy. Thus, the ability to identify fibrillar cell processes suggests that the tumor cells are more loosely packed or that there is localized extracellular edema. No relationship was identified between fibrillar histology and mitotic activity, indicating that the relationships between ve and these measures are independent.
Most previous work evaluating the relationship between specific histologic features and DCE-MR imaging has focused predominantly on CBV derived from DSC techniques with significant relationships seen among CBV and microvascular density,26⇓⇓–29 VEGF expression,27,30 cell density,29 endothelial proliferation,31 and mitotic activity.31 No such relationships were identified between these latter 3 measures and vp in this study. A study by Lüdemann et al53 compared a variety of MR imaging techniques with H2[150]-PET for measuring perfusion and found that while both DSC and T1-weighted DCE-MR imaging techniques correlated with the criterion standard H2[150]-PET measure, only borderline correlation was seen between the DSC techniques and the T1-weighted technique, whereby DSC-derived blood volumes were generally lower than those derived from the T1-weighted DCE-MR imaging technique. This finding may account for the failure of vp to relate to any of the histologic measures in this study.
The major limitation of the present work is the lack of stereotactic image–matched histologic specimens; therefore, correlation between the histology and the DCE-MR imaging measurements at a local level cannot be made. GBMs are notoriously heterogeneous tumors, and histologic analysis of small tumor specimens may lead to undergrading of a tumor if the sample is not a true reflection of the tumor as a whole. At the time of the study, image-matched histologic samples were not obtained and there was no concurrent postoperative imaging performed, which could have helped to identify the site of the histologic sample. All histologic specimens in this study did confirm the diagnosis of GBM and therefore are considered representative samples. Previous nonimage-registered studies comparing ve with histopathologic vascular measures have been reported, but these have been performed with a selection of 3–4 small ROIs, taking the maximal value of ve and Ktrans,33,34 which is unlikely to provide a representation of the tumor as a whole. In our current study, for the DCE-MR imaging measures Ktrans, ve, and vp, median values from whole-tumor VOIs were used. Studies using whole-tumor VOIs have previously identified significant differences in DCE-MR imaging parameters among tumor grades17 and have been shown to convey important potential prognostic information.25 Thus, a comparison between small histologic samples and DCE-MR imaging parameters from whole-tumor VOIs seems reasonable. Further work is required to confirm that the correlations identified in the current study hold true for image-matched stereotactic samples. In addition, some histologic features such as Ki-67 and VEGF expression, which have previously shown correlation with DSC-MR imaging–derived CBV,20,26⇓⇓⇓–30 were not available.
Conclusions
The DCE-MR imaging–derived measure ve has been identified as a potential correlate of mitotic activity in GBM. While this is an interesting result, our understanding of the biologic mechanisms responsible for this possible relationship is limited. Further work with the correlation of ve to more precise measures of cell density, additional markers of cellular and vascular proliferation, and measures of VEGF expression is warranted.
Footnotes
Disclosures: Samantha J. Mills—RELATED: Grant: C21247/A7473 Cancer Research UK/RCR clinical training fellowship, September 2006 to March 2010.* Giovanni Buonacorrsi—RELATED: Grant: Cancer Research UK, Comments: salary paid by Cancer Research UK Programme grant via the University of Manchester; UNRELATED: Employment: Bioxydyn commenced since the completion of this work. Geoffrey J.M. Parker—UNRELATED: Board Membership: Bioxydyn, Comments: founder and CEO of Bioxydyn, a company with an interest in imaging biomarkers, including DCE-MRI, and their application to cancer and other conditions; Consultancy: GlaxoSmithKline, Comments: consultancy on advanced imaging methods for clinical trials; Employment: Bioxydyn, Comments: part-time employment as CEO of Bioxydyn, a company with an interest in imaging biomarkers, including DCE-MRI, and their application to cancer and other conditions; Grants/Grants Pending: Cancer Research UK,* Engineering and Physical Sciences Research Council,* Comments: Programme Grant and project grants to develop DCE-MRI and other MRI methods for use in cancer and neurologic conditions; Royalties: for DCE-MRI software, licensed via the University of Manchester; royalties shared between staff and the University; Stock/Stock Options: Bioxydyn, Comments: Bioxydyn is a company with an interest in imaging biomarkers, including DCE-MRI, and their application to cancer and other conditions. Alan Jackson—RELATED: Grant: Cancer Research UK.* *Money paid to the institution.
This work was funded as part of a Cancer Research UK Clinical Research Training Fellowship, reference C21247/A7473.
Indicates open access to non-subscribers at www.ajnr.org
References
- Received July 6, 2015.
- Accepted after revision October 6, 2015.
- © 2016 by American Journal of Neuroradiology


Jump to section
Related Articles
Cited By...
- No citing articles found.