
Abstract
BACKGROUND AND PURPOSE: The pathogenesis of leukoaraiosis has long been debated. This work addresses a less well-studied mechanism, cerebrovascular reactivity, which could play a leading role in the pathogenesis of this disease. Our aim was to evaluate blood flow dysregulation and its relation to leukoaraiosis.
MATERIALS AND METHODS: Cerebrovascular reactivity, the change in the blood oxygen level–dependent 3T MR imaging signal in response to a consistently applied step change in the arterial partial pressure of carbon dioxide, was measured in white matter hyperintensities and their contralateral spatially homologous normal-appearing white matter in 75 older subjects (age range, 50–91 years; 40 men) with leukoaraiosis. Additional quantitative evaluation of regions of leukoaraiosis was performed by using diffusion (n = 75), quantitative T2 (n = 54), and DSC perfusion MRI metrics (n = 25).
RESULTS: When we compared white matter hyperintensities with contralateral normal-appearing white matter, cerebrovascular reactivity was lower by a mean of 61.2% ± 22.6%, fractional anisotropy was lower by 44.9 % ± 6.9%, and CBF was lower by 10.9% ± 11.9%. T2 was higher by 61.7% ± 13.5%, mean diffusivity was higher by 59.0% ± 11.7%, time-to-maximum was higher by 44.4% ± 30.4%, and TTP was higher by 6.8% ± 5.8% (all P < .01). Cerebral blood volume was lower in white matter hyperintensities compared with contralateral normal-appearing white matter by 10.2% ± 15.0% (P = .03).
CONCLUSIONS: Not only were resting blood flow metrics abnormal in leukoaraiosis but there is also evidence of reduced cerebrovascular reactivity in these areas. Studies have shown that reduced cerebrovascular reactivity is more sensitive than resting blood flow parameters for assessing vascular insufficiency. Future work is needed to examine the sensitivity of resting-versus-dynamic blood flow measures for investigating the pathogenesis of leukoaraiosis.
ABBREVIATIONS:
- BOLD
- blood oxygen level–dependent
- CVR
- cerebrovascular reactivity
- MD
- mean diffusivity
- NAWM
- normal-appearing white matter
- PETCO2
- end-tidal partial pressure of carbon dioxide
- PETO2
- end-tidal partial pressure of oxygen
- WMH
- white matter hyperintensities
Age-related changes in the cerebral white matter are apparent on MR imaging. They appear as bright regions on T2-weighted images and are called white matter hyperintensities (WMH) if they are presumed to be of vascular origin. These areas are characterized by myelin pallor, reactive astrogliosis, and loss of oligodendrocytes, axons, and myelin fibers.1 This rarefaction of white matter tissue is the origin of the term “leukoaraiosis,” derived from the Greek words “leuko-” for white and “araios” for rarefied.2 As many as 95% of individuals older than 50 years of age demonstrate these white matter changes, particularly in the periventricular and deep white matter.3,4 Once thought to represent benign age-related changes, studies during the past 25 years have shown that WMH are associated with morbidity, including cognitive impairment5 and disability.6⇓–8
Substantial evidence indicates that age-related vascular changes may lead to WMH, including increased vessel tortuosity,9 increased stringed vessels (remnants of capillaries with no endothelial cells), and vessel basement membrane thickening.10 Histopathologic analysis of abnormal white matter shows venular intramural collagen deposition leading to wall-thickening stenosis.11 The vascular anatomy of the white matter provides an intrinsically higher vascular resistance compared with the cortex.12 Interestingly, white matter areas with excellent collateral blood supply, such as the subcortical U-fibers, do not usually show age-related WMH.13 Collectively, these findings suggest an association between vascular dysfunction and leukoaraiosis.
In the present study, we sought to further characterize the vascular pathophysiology of WMH by evaluating cerebrovascular reactivity (CVR). CVR is defined as the change in cerebral blood flow induced by a vasoactive stimulus. Reduced CVR, normally found in the white matter of young healthy individuals,14 has been shown to spatially correspond with predilection maps of age-related leukoaraiosis development.15 CVR reductions are associated with cortical thinning,16 the risk of future ischemic stroke,17 cognitive decline,18 and abnormal diffusion tensor imaging metrics.19 WMH are associated with increased mean diffusivity (MD) and decreased fractional anisotropy, likely representing axonal destruction and glial proliferation.20 Previous studies have found a relationship between impaired CVR and abnormal diffusion metrics in the white matter of patients with Moyamoya disease19 and steno-occlusive carotid disease,21 suggesting that chronic hypoperfusion is associated with pathologic changes to white matter microstructure. Moreover, vascular dysfunction in the form of blood-brain barrier leakage in WMH is also associated with increased MD.22
We evaluated CVR in regions of WMH and normal-appearing white matter (NAWM) by measuring the change in blood oxygen level–dependent (BOLD) MR imaging in response to a standard CO2 challenge. To characterize the hemodynamic properties and microstructure of WMH, we obtained additional MR images and performed DTI and DSC perfusion MR imaging. We hypothesized that both CVR and these additional MR imaging metrics would differ between leukoaraiosis and NAWM.
Materials and Methods
Subject Recruitment
Seventy-five older adults with age-related leukoaraiosis (age range, 50–91 years; 40 men) were recruited from outpatient neurology clinics at the Toronto Western Hospital and Sunnybrook Health Sciences Centre. Reasons for clinical referral included the following: chronic imbalance, gait disturbances, transient episodes of paresthesia, syncopal episodes, headaches, cognitive decline, or memory impairment. Informed consent and institutional research ethics board approval were obtained. All patients had undergone prior MRA or CTA and T2-weighted FLAIR imaging, which were screened by experienced neuroradiologists (D.M.M. and D.J.M.) before inclusion in the study.
Because no direct histologic confirmation could be obtained, the diagnosis of leukoaraiosis was based on the exclusion of other diseases that can generate MR imaging T2-weighted hyperintensities (subsequently listed). Clinical and imaging-based inclusion criteria were as follows: 1) a previous neurologic event involving the white matter >3 months from presentation; 2) older than 50 years of age; 3) MRI white matter disease burden greater than Fazekas grade 223; 4) no hemodynamically significant (ie, >50%) stenosis of the ICAs, vertebral arteries, or basilar artery on CTA or MRA; 5) no evidence of dissection; 6) no evidence of pulmonary or cardioembolic disease; and 7) no known history of CADASIL, multiple sclerosis, primary malignancy, previous CNS infection, or head trauma. Subjects with significant motion artifacts on BOLD images were excluded.
Forty-three patients from the Toronto Western Hospital (age range, 50–87 years; 23 men and 20 women), and 32 patients from Sunnybrook Health Sciences Centre (age range, 51–91 years; 17 men and 15 women) met the inclusion criteria and were considered in subsequent analysis. Age, Montreal Cognitive Assessment score,24 gray matter volume, and white matter volume were collected as continuous variables. History of stroke, TIA, coronary artery disease, smoking, hypertension, diabetes mellitus, dyslipidemia, hypercholesterolemia, and obstructive sleep apnea were collected as binary variables.
MR Imaging Acquisition
Subjects underwent MR imaging on a 3T system (Signa HDx platform; GE Healthcare, Milwaukee, Wisconsin) at the Toronto Western Hospital and a 3T Achieva system (Philips Healthcare, Best, the Netherlands) at Sunnybrook Health Sciences Centre by using an 8-channel phased array head coil. Subjects were asked to refrain from heavy exercise and drinking alcohol on the day of each scan. The imaging acquisition parameters were as follows:
T1-weighted 3D spoiled gradient-echo sequence: section thickness = 1.2–1.5 mm, matrix size = 256 × 256, FOV = 22 × 22 cm, flip angle = 8° to 20°, TE = 2.3–3 ms, TR = 7.8–9.5 ms; BOLD sequence was a T2*-weighted echo-planar imaging gradient-echo sequence: section thickness = 3.0–5.0 mm, FOV = 24 × 24 cm, matrix size = 64 × 64, flip angle = 85° to 90°, TE = 30 ms, TR = 2000 ms; conventional FLAIR images: section thickness = 3 mm, 36 to 52 sections per volume, no intersection gap, matrix size = 256 × 224 to 240 × 240, FOV = 22 × 22 cm, flip angle = 90°, TE = 125 to 165 ms, TR = 9000 to 9145 ms, TI = 2200 to 2800 ms; diffusion tensor imaging with an echo-planar imaging spin-echo sequence: section thickness = 3 mm, matrix size = 76 × 62 to 128 × 128, FOV = 22 × 22 cm, b=1000 s/mm2, 23 diffusion-encoding gradients, 2 non-diffusion-weighted B0 images, TE = 55–80 ms, TR = 9150–14,500 ms; proton-density/T2-weighted images using fast spin-echo: section thickness = 3 mm, matrix size = 128 × 128 to 256 × 209, FOV = 22 × 22 cm, flip angle = 90°, TE = 11.1/90–11/102 ms, TR = 2500–7200 ms; multiecho T2 mapping using a fast spin-echo: section thickness = 3 mm, no intersection gap, matrix size = 256 × 192, FOV = 230 × 184 to 22 × 22 cm, TE = 13, 26, 39, 52, 65, 78, 91, 104, 117, 130, 143, 156 ms, TR = 5000–6000 ms; and DSC perfusion imaging using a gradient-multiphase-echo echo-planar imaging sequence: section thickness = 5 mm, matrix size = 128 × 128, FOV = 27 × 27 cm, flip angle = 90°, TE = 31.5 ms, TR = 1725 ms, 50 sections per location, during which a single bolus of 0.1 mmol/kg of gadolinium contrast agent was injected at a rate of 5 mL/s.
Vasodilatory Stimulus
CVR was assessed by measuring the change in BOLD MR imaging in response to a standardized change in end-tidal (ie, end-expiratory) partial pressure of carbon dioxide (PETCO2) as the vasodilatory stimulus.25 PETCO2 and end-tidal partial pressure of oxygen (PETO2) were targeted independently of each other and of the subjects' minute ventilation and breathing pattern by using an automated gas blender and sequential gas delivery breathing circuit (RespirAct; Thornhill Research, Toronto, Canada). Targeting PETCO2 and PETO2 was achieved by administering blends of gases according to previously described algorithms.26 The targeting sequence used in this study was the following: 1) baseline PETCO2 of 40 mm Hg for 60 seconds (normocapnia); 2) hypercapnic step change to PETCO2 of 50 mm Hg for 90 seconds; 3) return to baseline for 90 seconds; and 4) a second hypercapnic step for 120 seconds with a final return to baseline.27 All steps were implemented while maintaining normoxia (PETO2 ∼ 110 mm Hg). CVR was calculated as Δ% BOLD/PETCO2. CVR maps were displayed on a blue-to-red color scale, with regions of negative CVR (representative of steal physiology) in blue.
Image Reconstruction
The acquired BOLD MR imaging and PETCO2 data were imported to a freeware program for analysis, Analysis of Functional Neuro Images (AFNI; http://afni.nimh.nih.gov/afni).28 The BOLD time-series at each voxel was orthogonalized to 6 translational and rotational rigid body motion estimates by using the AFNI volume registration procedure to minimize any influence of hypercapnia-related head motion. BOLD images were section time-corrected and aligned to axial anatomic T1-weighted images. T1- and T2-weighted images were reviewed to identify regions of parenchymal infarction and prior hemorrhage. Masks of each parenchymal lesion were manually traced in AFNI and excluded from the CVR maps, which were calculated according to previously validated methods.29 T1-weighted anatomic images were segmented into CSF, gray matter, and white matter by using SPM8 software (http://www.fil.ion.ucl.ac.uk/spm/). CSF was masked from the CVR maps.
Maps of the traverse relaxation time (T2) were calculated to confirm tissue dysfunction in the cerebral white matter. T2 reflects white matter water content and myelination and was calculated in AFNI by using methods previously described.30 To calculate fractional anisotropy and MD maps, we imported diffusion-weighted images into FSL 4.1.8 (http://www.fmrib.ox.ac.uk/fsl).31 Preprocessing included eddy current and motion artifact correction by using the FMRIB Diffusion Toolbox (http://fsl.fmrib.ox.ac.uk/fsl/fslwiki/FDT).32 Individual brain masks were created by using the FSL Brain Extraction Tool (http://fsl.fmrib.ox.ac.uk/fsl/fslwiki/BET).33 The preprocessed images were then fitted with a diffusion tensor model by using DTIFit (http://fsl.fmrib.ox.ac.uk/fsl/fsl-4.1.9/fdt/fdt_dtifit.html),31 and parametric maps of fractional anisotropy and MD were calculated for each subject.
The time-signal attenuation curves obtained from perfusion-weighted T2* images were converted to time-concentration curves by using PerfTool,34 which uses a delay-insensitive reformulated singular value decomposition approach to deconvolution of the time-concentration curves.35 The arterial input function was selected from an ROI placed on the middle cerebral artery. These preprocessed perfusion-weighted images were used to generate maps of cerebral blood flow, relative cerebral blood volume, mean transit time, time-to-maximum, and time-to-peak by using PerfTool.34
Generating CVR Maps
PETCO2 data were first synchronized to the whole-brain average BOLD signal by using Matlab software (MathWorks, Natick, Massachusetts) to compensate for delays in breath sample analysis and the transit delay of blood flow from the pulmonary to cerebral circulation. A voxel-by-voxel linear least-squares fit of the BOLD signal time-series to the PETCO2 was performed, and the slope of the regression was taken as the CVR. CVR values are expressed as the percentage MR signal change per millimeter of mercury of PETCO2.
Generating ROIs of WMH and NAWM
The Lesion Explorer processing pipeline (available for download at http://sabre.brainlab.ca) was used to segment WMH and obtain measures of supratentorial total intracranial volume (total brain tissue and CSF).36,37 All T1-weighted images were transformed into Montreal Neurological Institute space by using SPM8. The transformation matrix was applied to all quantitative MR imaging maps to perform the transformation to standard space while retaining the native structure. AFNI was used to identify NAWM contralateral to WMH. In brief, a diamond-shaped structuring element was used to erode the white matter in 5 iterations at the resolution of the T1-weighted image to prevent partial voluming effects. The WMHs were subtracted after erosion to give rise to a NAWM mask contralateral to the WMH ROI.
Accounting for the Confounding Factor of Spatial Location
One important confounding factor that may produce differences between WMH and NAWM is spatial location. For example, WMH tend to develop in the periventricular white matter, and CVR may be lower in these areas. Therefore, CVR measurements in NAWM may be overestimated because CVR values in these regions tend to be higher. To account for this possibility, a second NAWM ROI was generated, including only those NAWM regions that are contralateral and spatially homologous to the regions of WMH (Fig 1).

Calculation of ROIs used to control for differences in the spatial location of MR imaging metrics. A, Representative FLAIR image of a patient with periventricular and deep white matter hyperintensities. B, WMH are highlighted in yellow and overlaid on the FLAIR image. C, WMH (yellow) with the underlying FLAIR image removed. D, The WMH are left-right flipped about the y-axis (pink). This transformation is in Montreal Neurological Institute coordinates but retains the native structure (no warping of the brain). E, WMH (C) is subtracted from contralateral NAWM (pink). This is the final NAWM mask used in the statistical comparison between WMH and contralateral NAWM. F, Contralateral NAWM is left-right flipped and combined with the initial WMH ROI (C) by using a logical “and” operation; the resulting WMH mask includes only those voxels that have homologous NAWM in the contralateral hemisphere. This is the final WMH mask used in statistical comparisons between WMHs and contralateral NAWM. G, Final masks (E and F) overlaid on a FLAIR image.
Statistical Analyses
Statistical analysis was performed with SPSS 21.0 (IBM, Armonk, New York). To assess the relationship between CVR and cognitive function, we performed a univariate general linear regression between CVR (within NAWM or WMH) and Montreal Cognitive Assessment scores, while controlling for age, sex, vascular risk factors, and total gray and white matter volume.
The relationship between each vascular risk factor and CVR was assessed with univariate regression analyses by using the CVR within each ROI (namely, WMH or NAWM, Fig 1G) as the dependent variable and either age, sex, Montreal Cognitive Assessment score, vascular risk factors (listed in Table 1), total gray matter volume, WMH volume, or NAWM volume as the independent variable. Partial η2 effect sizes were calculated for significant between-group results (ie, the presence-versus-absence of each vascular risk factor).
Baseline characteristics of subjects
To assess the relationship between CVR, diffusion, and perfusion metrics, we calculated the Pearson linear correlation coefficient for each comparison between metrics, by using the difference in each parameter value between WMH and NAWM.
Statistical comparisons of CVR, DTI, and perfusion parameter differences between WMH and NAWM were performed by using a paired Student t test. Results were considered significant at α = .05.
Results
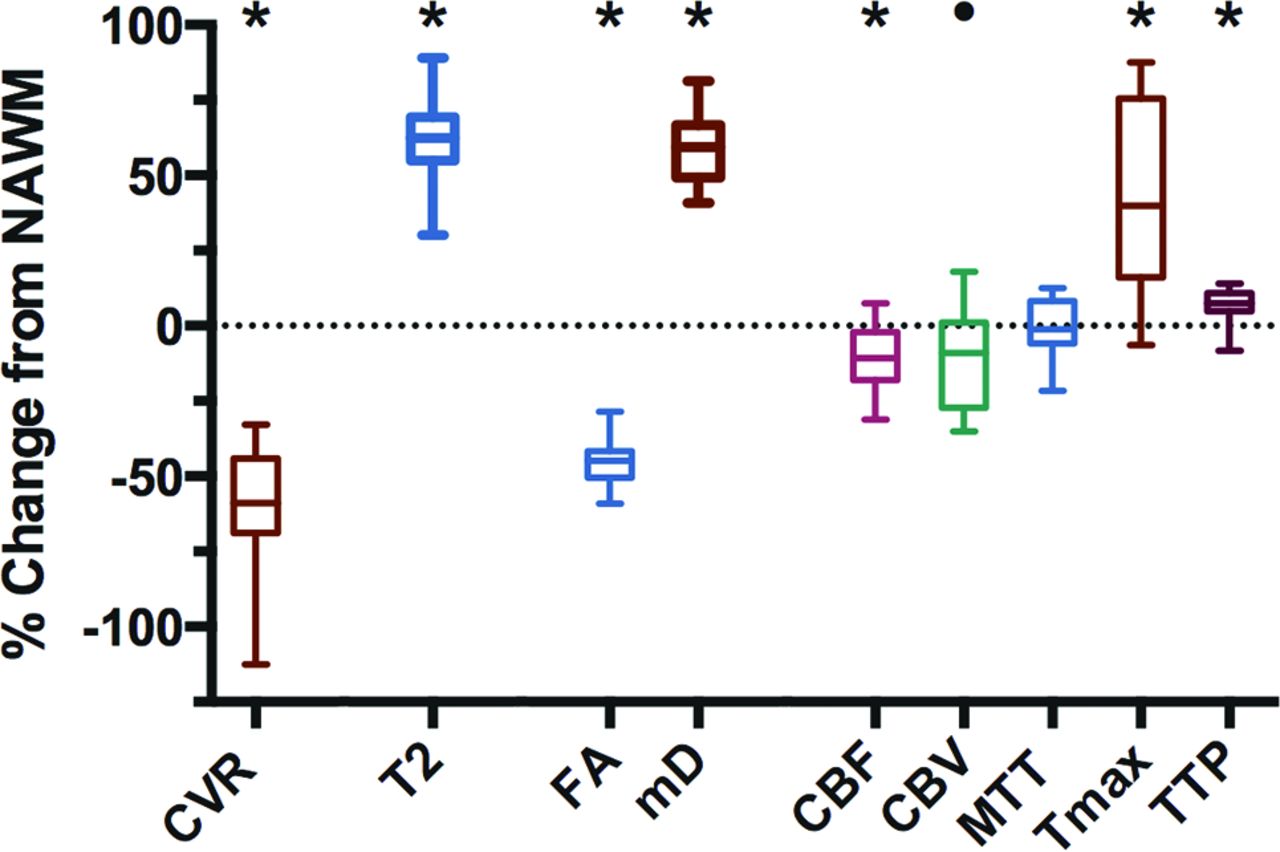
The 75 subjects had a mean WMH volume of 26.7 ± 23.5 mL per subject (range, 0.3–93.9 mL). Table 1 provides their demographics. Table 2 shows comparisons between WMH and the contralateral NAWM. Comparisons between these 2 ROIs for each metric are provided in Fig 2.
Measurements of CVR, FA, MD, T2, and perfusion metrics in WMH and contralateral homologous NAWM

Relative values of MR imaging metrics in WMH compared with contralateral NAWM. The values of each MR imaging metric are given as a percentage change from NAWM. The ROIs used for these measurements are taken from Fig 1G. CVR, fractional anisotropy, CBF, and relative CBV values are significantly lower in WMH compared with NAWM, while MD, T2, MTT, time-to-maximum, and TTP are significantly higher in WMH compared with NAWM (asterisk, P < .01, compared with NAWM, and circle, P < .05, compared with NAWM). Bars indicate minimum and maximum; boxes, the interquartile range; and the line within each box, the median. FA indicates fractional anisotropy; Tmax, time-to-maximum; mD, mean diffusivity.
CVR, fractional anisotropy, and CBF were reduced in WMH compared with NAWM, while T2, MD, and time-to-maximum were increased in WMH compared with NAWM (all, P < .01). CBV was reduced in WMH compared with NAWM (P = .03). MTT values were not significantly different between WMH and NAWM. There was no correlation between CVR and the other diffusion and perfusion metrics for any of the ROIs considered (WMH, NAWM, and total white matter); and there was no relationship between CVR and Montreal Cognitive Assessment scores (mean, 24/30 ± 4.8). Previous stroke was associated with lower CVR in WMH (P < .05; η2 = 0.07 moderate effect size). There was no significant association between CVR and the remaining vascular risk factors listed in Table 1.
Discussion
Our results provide evidence for vascular dysfunction in regions of leukoaraiosis, characterized by quantitative changes in multiple MR imaging parameters. Compared with the contralateral NAWM, the increased MD and decreased fractional anisotropy in leukoaraiosis are consistent with the findings in previous studies38,39 and indicate that white matter structural integrity has been compromised and water is able to diffuse more freely through areas of demyelination and axonal degeneration.40 Quantitative T2 values were higher in leukoaraiosis, which is to be expected because this indicates increased water content due to loss in tissue structure.41 CBF was reduced; this change indicated a reduction in blood supply,22 CBV was also reduced; this change suggested decreased density of the local microvasculature.42 Finally, time-dependent MR imaging metrics such as time-to-maximum and TTP were prolonged in leukoaraiosis; this finding demonstrates a delay in the blood supply to areas of leukoaraiosis. Collectively, these abnormal MR imaging metrics provide evidence for vascular dysfunction in areas of leukoaraiosis in our cohort of patients.
We also found that CVR in regions of leukoaraiosis was significantly lower than in NAWM. These results are similar to findings from a previous study by Uh et al22 reporting lower CVR values in leukoaraiosis. However, the approach to CVR quantification in the present study is more accurate. Inhalation of 5% CO2 (as performed by Uh et al) produces a variable PaCO2 stimulus that depends on the subject's minute ventilation and breathing pattern, which can lead to inaccurate CVR quantitation.43 Our ability to maintain a standardized extended period of hypercapnia (independent of minute ventilation) provides greater confidence in the accuracy of our CVR measurements.
Reduced CVR suggests a role for endothelial dysfunction in the development of leukoaraiosis and is consistent with the findings of Hassan et al,44 who demonstrated upregulated markers of endothelial activation and damage in leukoaraiosis. By accounting for spatial location, we point out that the areas with diminished CVR were colocalized with diffusion and perfusion abnormalities, which were seen only in WMH and not in the contralateral NAWM. Furthermore, the subjects who presented with strokes had a decreased CVR in WMH. Together, these findings support our hypothesis that vascular dysfunction, with loss in blood flow control, exacerbates white matter damage in areas of WMH.
Our results are consistent with those in other studies reporting CBF reductions in leukoaraiosis compared with NAWM,22,45⇓–47 but they are not in agreement for CBV. We found a reduction in CBV, possibly due to a loss of vascular density, whereas another study showed no difference in CBV between leukoaraiosis and NAWM.46 These observations of reduced perfusion metrics and CVR in leukoaraiosis are also in agreement with predilection maps demonstrating that regions of white matter with lower perfusion have a higher frequency of leukoaraiosis.45,48 Finally, we found prolonged time-dependent perfusion measures in leukoaraiosis. Prolonged TTP and time-to-maximum values have also been reported in the infarct core of patients with acute stroke, by using CT perfusion.49
CVR may be more sensitive than resting blood flow metrics for the following reasons: CBF measures can be normal due to the action of vascular autoregulation, CBV is difficult to quantitate accurately, and transit time measures can be increased but with normal CVR, with collaterals that maintain normal resting blood flow.50
Our study is limited in several respects. First, our measure of CVR is based on the percentage BOLD change per millimeter of mercury PETCO2. The BOLD signal does not measure blood flow directly but represents an interaction of arterial partial pressure of oxygen, cerebral blood flow, cerebral blood volume, hematocrit, and cerebral metabolic rate of oxygen.51 However, we have previously shown that the BOLD MR imaging signal response to hypercapnia is well-correlated with CBF measurements obtained by using arterial spin-labeling in patients with steno-occlusive disease.52 Second, only a subset of subjects underwent quantitative T2 measurements (54 of 75 subjects) and perfusion measurements (25 of 75 subjects). Third, we report only limited cognitive measures; only the Montreal Cognitive Assessment score was collected, which did not provide a detailed profile of each subject's cognitive status. In this respect, our study was not designed to assess the relationship between impaired CVR and cognitive function. An extensive neuropsychological battery would have been needed for this purpose. Finally, we acknowledge that the criterion standard of histopathologic diagnosis was not obtained in our patient cohort.
Conclusions
WMH demonstrate abnormal hemodynamic parameters in a pattern consistent with diminished blood flow regulation and increased vulnerability to transient ischemia compared with NAWM. It remains to be determined whether impaired CVR is a causative and/or predictive factor in the pathogenesis of leukoaraiosis versus a secondary response to the reduced metabolic activity of leukoaraiotic tissue. Whether the impaired reactivity in white matter precedes white matter tissue injury or vice versa remains unclear, and a 1-year follow-up study in this cohort of patients is planned to better address this question. Nevertheless, our findings support the hypothesis that vascular dysfunction in cerebrovascular regulation is an important factor in the pathophysiology of white matter disease.
Acknowledgments
We are grateful to the Toronto Western Hospital and Sunnybrook Health Sciences Centre RespirAct technologists, Anne Battisti-Charbonney and Diem Pham, and the MR imaging technologists, Keith Ta and Eugen Hlasny. We also thank David Crane (MacIntosh laboratory manager) and Anoop Ganda (psychometrist/research coordinator) for enabling the Sunnybrook data acquisition, which required availability after hours and on weekends. Last, we greatly appreciate the assistance of Alicia McNeely and Courtney Berezuk, Sunnybrook BrainLab imaging analysts, for identifying areas of white matter hyperintensities and lacunes for the Sunnybrook dataset, and to Christopher Scott, Sunnybrook BrainLab manager, for facilitating training and analysis by using the Lesion Explorer pipeline.
Footnotes
Disclosures: Kevin Sam—RELATED: Grant: Research funding was provided by the Canadian Stroke Network from 2010 to 2014.* Olivia Sobczyk—UNRELATED: Consultancy: Thornhill Research Inc, Comments: for the RespirAct device, but not in relation to the submitted work. James Duffin—UNRELATED: Employment: I am the senior scientist at Thornhill Research. Joseph A. Fisher—UNRELATED: Other: I am one of the inventors of the RespirAct used in the study. I also have shares in and sit on the board of the company. Thornhill Research is a spinoff from the University Health Network, part of the University of Toronto. The RespirAct is a research tool and not a commercial product. Should it ever become one, I would stand to profit*; OTHER: coinventor of the RespirAct, a device used in this study. I also hold shares and serve as a director of Thornhill Research Inc, a University of Toronto/University Health Network–related company, which retains an ownership position and will receive royalties should the RespirAct become a commercial product. Sandra E. Black—RELATED: Grant: Canadian Stroke Network (2010–2014)*; UNRELATED: Grants/Grants Pending: Elan,* Roche,* GE Healthcare,* Eli Lilly,* Pfizer,* Lundbeck,* GlaxoSmithKline,* Transition Therapeutics,* Biogen Idec,* Comments: contract research to the institution; Payment for Lectures (including service on Speakers Bureaus): Continuing Medical Education lectures for Novartis, Eisai, Pfizer; OTHER: received compensation in the past 2 years for ad hoc consulting with Boehringer Ingelheim and Novartis and honoraria from the Rehabilitation Institute of Chicago, the Heart and Stroke/Richard Lewar Centre of Excellence in Cardiovascular Research, Esisai Korea, and Novartis. My research unit is receiving research funding from Roche, GE Healthcare, Lilly Avid, Pfizer, Lundbeck, and Transition Therapeutics. I also receive research funding from the Canadian Institutes of Health Research, National Institutes of Health, Heart and Stroke Foundation of Canada, Alzheimer Drug Discovery Foundation, Weston Foundation, Brain Canada, University of Toronto Department of Medicine, and the Ontario Brain Institute. David J. Mikulis—RELATED: Grant: Canadian Institutes of Health Research*; UNRELATED: Canadian Institutes of Health Research,* GE Healthcare,* Physician's Services Incorporated Foundation; Stock/Stock Options: stock (<2% equity in Thornhill Research Inc, the vendor of the RespirAct); OTHER: I am coinventor of the RespirAct, a device used in this study and hold a minor equity position in Thornhill Research Inc and have received research support from GE Healthcare, Siemens, Toshiba, and the Ontario Research Fund. *Money paid to the institution.
This work was supported by the Canadian Stroke Network and the Ontario Research Fund (RE 02-002) for Kevin Sam, Adrian P. Crawley, Julien Poublanc, John Conklin, Olivia Sobczyk, James Duffin, Daniel M. Mandell. Joseph A. Fisher, Sandra E. Black, and David J. Mikulis. This study was also supported by the Alternative Funding Plan for the Academic Health Sciences Centres of Ontario Innovation fund. Dr Black also acknowledges support for the Sunnybrook BrainLab from the Heart and Stroke Foundation Canadian Partnership for Stroke Recovery and the LC Campbell Foundation.
Indicates open access to non-subscribers at www.ajnr.org
References
- Received November 20, 2015.
- Accepted after revision June 7, 2016.
- © 2016 by American Journal of Neuroradiology


Jump to section
Related Articles
Cited By...
- The Relationship between Cerebrovascular Reactivity and Cerebral Oxygenation during Hemodialysis
- Intracranial hemodynamic relationships in patients with cerebral small vessel disease
- White Matter Lesion Penumbra Shows Abnormalities on Structural and Physiologic MRIs in the Coronary Artery Risk Development in Young Adults Cohort
- Intracranial functional haemodynamic relationships in patients with cerebral small vessel disease
- Leukoaraiosis severity and outcomes after mechanical thrombectomy with stent-retriever devices in acute ischemic stroke
- Pathogenesis of white matter changes in cerebral small vessel diseases: beyond vessel-intrinsic mechanisms