
Abstract
BACKGROUND AND PURPOSE: Quantitative CBF usage as a biomarker for cognitive impairment and disease progression in MS is potentially a powerful tool for longitudinal patient monitoring. Dynamic susceptibility contrast perfusion with bookend T1-calibration (bookend technique) and pseudocontinuous arterial spin-labeling have recently been used for CBF quantification in relapsing-remitting MS. The noninvasive nature of pseudocontinuous arterial spin-labeling is advantageous over gadolinium-based techniques, but correlation between the techniques is not well-established in the context of MS.
MATERIALS AND METHODS: We compared pseudocontinuous arterial spin-labeling CBF with the bookend technique in a prospective cohort of 19 healthy controls, 19 subjects with relapsing-remitting MS without cognitive impairment, and 20 subjects with relapsing-remitting MS with cognitive impairment on a voxelwise and Brodmann region basis. The linear Pearson correlation, SNR, and coefficient of variation were quantified.
RESULTS: Voxelwise paired t tests revealed no significant CBF differences between techniques after normalization of global mean intensities. The highest Pearson correlations were observed in deep GM structures (average r = 0.71 for the basal ganglia and r = 0.65 for the thalamus) but remained robust for cortical GM, WM, and white matter lesions (average r = 0.51, 0.53, 0.54, respectively). Lower Pearson correlations were observed for cortical lesions (average r = 0.23). Brodmann region correlations were significant for all groups. All correlations were maintained in healthy controls and in patients with relapsing-remitting multiple sclerosis. The highest SNR was present in bookend perfusion, while the highest coefficient of variation was present in white matter lesions.
CONCLUSIONS: Agreement between pseudocontinuous arterial spin-labeling and bookend technique CBF measurements is demonstrated in healthy controls and patients with relapsing-remitting MS.
ABBREVIATIONS:
- BG
- basal ganglia
- CL
- cortical lesion
- CV
- coefficient of variation
- HC
- healthy controls
- pCASL
- pseudocontinuous arterial spin-labeling
- RRMS
- relapsing-remitting MS
- RRMS-I
- RRMS with cognitive impairment cohort
- RRMS-NI
- RRMS not cognitively impaired cohort
- TH
- thalamus
- WML
- white matter lesion
Multiple sclerosis is the most common nontraumatic cause of neurologic disability in young and middle-aged adults.1 In addition to physical disability, cognitive impairment is an important contributor to functional disability in patients with MS and increasingly recognized as an important contributor to quality of life.2 Cerebral hypoperfusion has been well-described in MS, initially with PET and recently with MR imaging.3⇓⇓–6 The etiology is likely multifactorial7; primary and secondary hypoperfusion, metabolic dysfunction, and primary cerebrovascular abnormality are all posited.8
Few studies have evaluated the role of deep gray matter or cortical perfusion in cognition. Recently, quantitative CBF perfusion imaging has been shown to correlate strongly with cognitive impairment in relapsing-remitting multiple sclerosis.9⇓–11 A pseudocontinuous arterial spin-labeling (pCASL) study demonstrated a 7% reduction in cortical CBF in early relapsing-remitting MS (RRMS) compared with healthy controls (HC), with cortical CBF reduction associated with lower memory scores in the RRMS group.9 Another pCASL study demonstrated focal cerebral hypoperfusion in functionally important areas in cognitively impaired RRMS groups compared with HC and cognitively preserved RRMS groups.10 Similar results were shown by using the bookend perfusion technique in RRMS and patients with secondary-progressive MS, in which hypoperfusion explained ∼7%–20% of cognitive impairment, respectively, after correction for confounding factors.11,12 Most important, hypoperfusion was present in the patients with cognitive impairment compared those without impairment in RRMS in the absence of structural differences. Cortical CBV reduction in MS was independently associated with overall cognitive impairment and correlated highly with individual cognitive tests.13 Data are also available from studies evaluating deep gray matter perfusion. Inglese et al14 reported a significant CBV reduction in deep GM perfusion in primary-progressive MS compared with relapsing-remitting MS. Deep GM CBV correlated with the Color-Word Interference Test (Delis-Kaplan Executive Function System).14 These results demonstrate the apparently independent role that cortical hypoperfusion plays in cognition in MS, suggesting utility as a biomarker of cortical disease severity.
The bookend perfusion technique, which uses unique “bookend” calibration scans on either side of a conventional DSC sequence, is validated against H2 [15O] PET and demonstrates high test-retest repeatability.15 Most important, the technique demonstrates reproducible CBF measurements in both HC and disease states, providing both GM and WM perfusion metrics and demonstrating high signal to noise by exploiting the T2* effects of gadolinium.16,17 The acquisition and processing are vendor-neutral and can be implemented by using sequences already available on most MR imaging scanners. Disadvantages include the need for gadolinium administration, with a potential for increased adverse events, stimulating a growing interest in noncontrast-based perfusion sequences such as pCASL.18 pCASL exploits magnetically polarized protons in water molecules in arterial blood as an endogenous tracer and, therefore, does not require contrast administration.19,20 Quantitative CBF is achieved with good success, especially in the GM of healthy individuals.21⇓–23 Disadvantages include the inherently low SNR and longer transit times associated with WM, rendering WM CBF signal unreliable.24 Last, pCASL is mostly limited to larger research centers, with limited routine clinical use compared with DSC sequences.
Given the options available for quantitative imaging and the potential role for longitudinal cognitive impairment monitoring in MS via perfusion measurements, we sought to compare the pCASL and bookend perfusion techniques in HC and an RRMS not cognitively impaired cohort (RRMS-NI) and an RRMS with cognitive impairment cohort (RRMS-I) to assess their correlation coefficient of variation (CV) and SNR in the healthy and disease states. We hypothesized that good correlation would be seen between the 2 techniques in the context of an RRMS study cohort but that the SNR would be higher in bookend CBF measurements.
Materials and Methods
Patient Cohorts
This study was approved by the Sunnybrook Ethics Review Board, and informed consent was obtained for all patients. Patients with RRMS were prospectively recruited during 1 year from 2 tertiary referral MS clinics by a senior neurologist with specialist practice in MS (20 years' experience). The Montreal Cognitive Assessment screening25 was initially used to identify 20 patients with RRMS-I followed by 19 age- and sex-matched patients with RRMS-NI and 19 HC. Exclusion criteria were a history of drug/alcohol abuse, MS disease activity or steroid use within the past 3 months, premorbid (ie, pre-MS) psychiatric history, head injury with loss of consciousness, concurrent medical diseases (eg, cerebrovascular disease), and contraindications to MR imaging/gadolinium (eg, impaired renal function).
Cognitive Testing
Briefly, cognitive testing was performed by using a comprehensive test validated for use in MS (the Minimal Assessment of Cognitive Function In Multiple Sclerosis), testing processing speed, working and visuospatial memory (Paced Auditory Serial Addition Test, Symbol Digit Modalities Test), executive function (Delis-Kaplan Executive Function System), verbal fluency (California Verbal Learning Test-Second Edition, Brief Visuospatial Test-Revised), visuospatial perception and spatial processing (Judgment of Line Orientation Test), and verbal fluency (Controlled Oral Word Association Test).26 Consistent with convention, patients scoring >1.5 SDs below normative data on ≥2 tests were defined as being cognitively impaired.12 The Expanded Disability Status Scale and Hospital Anxiety and Depression Scales were evaluated for each patient.
Image Acquisition
MR images were obtained by using a 3T scanner (Achieva; Philips Healthcare, Best, the Netherlands) by using an 8-channel phased array head coil receiver. Acquisitions included a volumetric T1 turbo field echo (TR/TE/flip angle = 9.5 ms/2.3 ms/12°, matrix size = 256 × 219, FOV = 24 cm, section thickness = 1.2 mm) and a proton-density/T2 sequence (TR/TE/flip angle= 2500 ms/10.7 ms/90°, matrix size = 256 × 263, FOV= 23 cm, section thickness = 3 mm). Bookend perfusion included an echo-planar DSC sequence: TR/TE/flip angle = 1633 ms/30 ms/60°, matrix size = 96 × 93, FOV = 22 cm, in-plane voxel size = 2.3 × 2.4 mm, no gap, bandwidth= 1260 Hz/pixel, sections = 24, section thickness = 4 mm following 10 mL of gadobutrol (1 mmol/mL) (Gadovist; Bayer Schering Pharma, Berlin, Germany) injected at a rate of 5 mL/s (Medrad-Spectris Solaris; Bayer) immediately followed by a 25-mL bolus of saline at 5 mL/s. Sixty acquisitions were performed at 1.6-second intervals, with gadobutrol administration on the fifth sequence. A segmented inversion recovery Look-Locker EPI sequence was performed immediately before and after the DSC sequence: TR/TE/flip angle = 29 ms/14 ms/20°, matrix size = 128 × 126, FOV= 22 cm, 15 lines in k-space per acquisition, section thickness = 4 mm, scan time = 73 seconds, 60 time points. To facilitate longitudinal magnetization recovery, we used a 3-second delay after the last imaging time point.20 pCASL images were acquired similar to the manner of Shirzadi et al,27 with the following parameters: TR/TE = 4000/9.7 ms, matrix size = 64 × 64 × 18, voxel size = 3 × 3 × 5 mm3, label offset = 80 mm, first section postlabel delay = 1600 ms, label duration (middle section) = 1800 ms, scan duration = 248 seconds (30-tag control pair). Reference arterial spin-labeling images for absolute quantification of CBF were acquired (TR/TE = 10,000/9.7 ms, matrix = 64 × 64 × 18, resolution = 3 × 3 × 5 mm3, scan duration = 40 seconds).28
Perfusion Processing
Bookend perfusion uses pre- and postgadolinium WM T1 values relative to T1 changes in the blood pool to carefully model the effects of intravascular-to-extravascular water exchange and quantify quantitative cerebral blood volume, in WM, independent of an arterial input function.17 CBV and CBF quantification account for compartmentalization effects, average brain density, and hematocrit differences between large arteries and capillaries.29 Deconvolution of tissue concentration–time curves by the arterial input function with singular value decomposition is used to calculate rCBF, while the ratio of area under the curve of the tissue concentration–time curve and arterial input function represents the relative CBV. Finally, CBF is calculated as the product of relative CBF, quantitative cerebral blood volume, and relative CBV.30
pCASL quantitative CBF calculations are completed by using the image-processing pipeline developed by Shirzadi et al.27 Briefly, masks are created by automatic segmentation of GM voxels from the T1 image by using the FAST tool (FMRIB Automated Segmentation Tool; http://poc.vl-e.nl/distribution/manual/fsl-3.2/fast/index.html).31 T1 images with tissue masks are then registered to arterial spin-labeling coordinate space. CBF calculations are then optimized by determining the point of maximum GM detectability with only differences in control and labeled images contributing to this peak level, included by using an aligning/sorting/discarding/refining pipeline.27 Finally CBF is defined by using the following equation:
 where ΔM represents the mean signal in the difference (reference tag) image, M0 represents the equilibrium magnetization signal extracted from the reference scan, α = 0.85 represents labeling efficiency, T1,b = 1.68 seconds represents the longitudinal recovery time of arterial blood, postlabeling delay (PLD) is 1.6 seconds, Δtz is the acquisition time for each axial section, TE represents the TE of the reference scan, and T*2,t = 0.06 seconds represents the transverse tissue relaxation time.27
Image Processing
The reference pCASL control and pregadolinium DSC image acquisitions were normalized to Montreal Neurological Institute 152 space in SPM8 software (http://www.fil.ion.ucl.ac.uk/spm), creating 2 study-specific Montreal Neurological Institute 152 templates. Each individual's averaged pCASL control and pregadolinium DSC images were then registered to their study-specific Montreal Neurological Institute template by using a linear registration tool (FMRIB Linear Image Registration Tool, FLIRT; http://www.fmrib.ox.ac.uk/) followed by nonlinear intensity modulation and multiresolution nonlinear registration with 4 subsampling levels (FMRIB Nonlinear Registration Tool, FNIRT; http://fsl.fmrib.ox.ac.uk/fsl/fslwiki/FNIRT). To better guide the alignment at each resolution level, we smoothed the images by using a full width at half maximum Gaussian kernel. Basal ganglia (BG) and thalamus (TH) regions were manually traced for each subject by an experienced neuroradiologist (10 years' experience) from T1-weighted images in native space. Similarly, WM, cortical lesions, and T1 black holes were manually traced with Analyze 8.0 (Biomedical Imaging Resource, Mayo Clinic, Rochester, Minnesota) on proton-density/T2 and volumetric T1, respectively. These ROIs were coregistered to Montreal Neurological Institute space as above and were removed from GM and WM regions but were independently analyzed. The resulting Montreal Neurological Institute images were 91 × 109 × 91 voxels, with each voxel measuring 2 × 2 × 2 mm.
pCASL and bookend modalities were correlated on a voxelwise basis blinded to patient group, after constructing mean images by averaging the CBF intensity of each corresponding voxel over subjects within each cohort. A 7 × 7 voxel grid was created for each axial section of the CBF maps, and the mean CBF value within each grid section was calculated; this process yielded a wide range of CBF values.29 To account for anatomic ROI variations occurring during average image construction, we included only nonzero CBF values in average calculations, thereby ensuring that only overlapping voxels from each subject were considered. ROIs were subsegmented into GM and WM by using subject-specific masks generated by using the “Segment” function in SPM8. GM was thresholded to have a minimum probability of 80% to reduce GM/WM overlap and partial volume effects. GM CBF intensities were also correlated on a Brodmann region basis. Brodmann areas were selected individually from average CBF maps for each subject group by using a standard mask template in Montreal Neurological Institute 152 space. GM CBF values were averaged over voxels contained within each Brodmann region, and average values were plotted.
Statistical Analysis
Baseline demographic data were compared between patients with and without impairment and HC by using univariate general linear regression for age and logistic regression for sex. Age and sex were expressed as mean ± SD and proportions, respectively. Paired t tests were performed between pCASL and bookend mean CBF intensities for both whole-brain CBF maps to evaluate statistically significant spatial intensity differences between sequences for each of GM, WM, BG, and TH. To account for global overestimation of bookend CBF,29 we normalized mean intensities before paired t test analysis. The T value maps were thresholded at a false discovery rate corrected to P < .05, with a minimum cluster size of 20 voxels.32
Voxel-by-voxel linear correlation was performed with the Pearson coefficient method by using mean CBF intensity masked as WM, GM, BG, TH, white matter lesion (WML), and cortical lesion (CL) ROIs. To allow comparison of subject groups and ROIs, accounting for differences in voxel number, we calculated Fischer Z scores and converted them to standard z scores by dividing by the standard error ( ) where ν = number of voxels. Last, the Brodmann region rather than voxelwise linear correlation was conducted by using the Pearson correlation for each hemisphere. P < .05 was considered significant.
Dispersion between CBF imaging techniques was assessed by using Bland-Altman techniques.33 The coefficient of variation, a standard measure of dispersion [CV = (SD/μ) × 100], in which μ is the mean CBF value across both modalities and SD represents the SD of the difference of voxelwise CBF values between imaging modalities, was calculated for mean CBF images in all subject groups. Noise was estimated as the mean of 100 randomly selected voxels outside the brain parenchyma from unsmoothed images. These voxels were plotted as a histogram of signal intensities and fitted with a Gaussian distribution. To ensure that the noise estimation had not been affected by processing, we compared the SD with the mean of the noise distribution.34 SNR was then defined as the ratio between the mean noise estimation to the mean GM CBF. All statistical analyses were completed by using Matlab software (MathWorks, Natick, Massachusetts).
Results
A summary of clinical data is presented in Table 1. There were no significant differences in age or sex between group cohorts (all P > .05). Average ages were 49.0 ± 7.1, 46.4 ± 7.2, and 48.1 ± 4.7 years for the HC, RRMS-NI, and RRMS-I groups, respectively. Similarly, the percentages of female sex were 73.7% (14/19), 79% (15/19), and 60% (12/20), respectively.
Demographic and clinical characteristics of HC and patients with RRMSa
Paired T Test Comparison
CBF measurements demonstrated greater global intensity by using the pCASL technique compared with the bookend technique. No significant difference in regional voxel-by-voxel CBF signal intensities for any of the WM, GM, BG, and TH regions was present in paired t tests between pCASL and bookend perfusion for HC, RRMS-I, and RRMS-NI groups after normalization of global mean intensities. Representative axial sections of both sequences are demonstrated in Fig 1.

Average CBF maps for 19 HC registered to a standard Montreal Neurological Institute template for pCASL (A) and bookend (B) techniques. Images are presented in sequential axial sections from the skull base to vertex.
Voxelwise Correlation
Results of the mean CBF linear correlation are summarized in Table 2 and illustrated for HC in Fig 2A. There was no significant difference in correlation strengths among any groups. Although there was proportionally large scatter in voxelwise intensities, correlation r values were strong for HC, RRMS-NI, and RRMS-I (average over ROIs, r = 0.62, 0.64, and 0.59 respectively). Correlations were stronger for deep GM ROIs (average r = 0.71 for the BG, and r = 0.65 for the TH) compared with cortical GM, WM, and WML regions (average r = 0.51, 0.53, 0.54, respectively). Correlation was weakest in CL regions (average r = 0.21). Slope values were all <1 (average = 0.51), indicating that in general, pCASL-derived CBF values were of overall higher magnitude compared with bookend CBF values.
Voxelwise Pearson correlationa

A, Upper Row: voxelwise comparison of ROIs of pCASL versus bookend techniques by using Pearson correlations for mean HC CBF. Red lines indicate linear Pearson correlation fits. B, Lower row: Bland-Altman plots for each ROI. Horizontal axis shows the means of pCASL and bookend measurements in milliliters per 100 g per minute, and pCASL CBF minus bookend CBF is shown on the vertical axis in milliliters per 100 g per minute. The blue horizontal solid line represents the mean difference. The red horizontal lines represent the mean difference ± 2 SDs.
Coefficient of Variation and Signal-to-Noise Ratio
CV calculations demonstrate that on average, WML, CL followed by WM show greatest dispersion between bookend and pCASL modalities (average CV = 38.0%, 37.4%, and 30.1%, respectively), whereas the lowest dispersion was seen within the GM (average CV = 25.9%). Bland-Altman plots (Fig 2B) demonstrated good agreement of mean voxelwise CBF values among perfusion imaging modalities. Bland-Altman plots of WM showed mean differences significantly greater than zero in WM (13.7 mL/100 g/min for HC). The estimated SNR was higher for bookend measurements (mean SNR = 6.6) compared with pCASL CBF measurements (mean SNR = 4.3). SDs of noise distributions were the same order of magnitude as the mean (mean noise pCASL ≈ 3.2 × SD; mean noise bookend ≈ 2.0 × SD). CV and SNR values are presented in Table 3.
Coefficient of variation and SNRa
GM Brodmann Region–Based Correlation
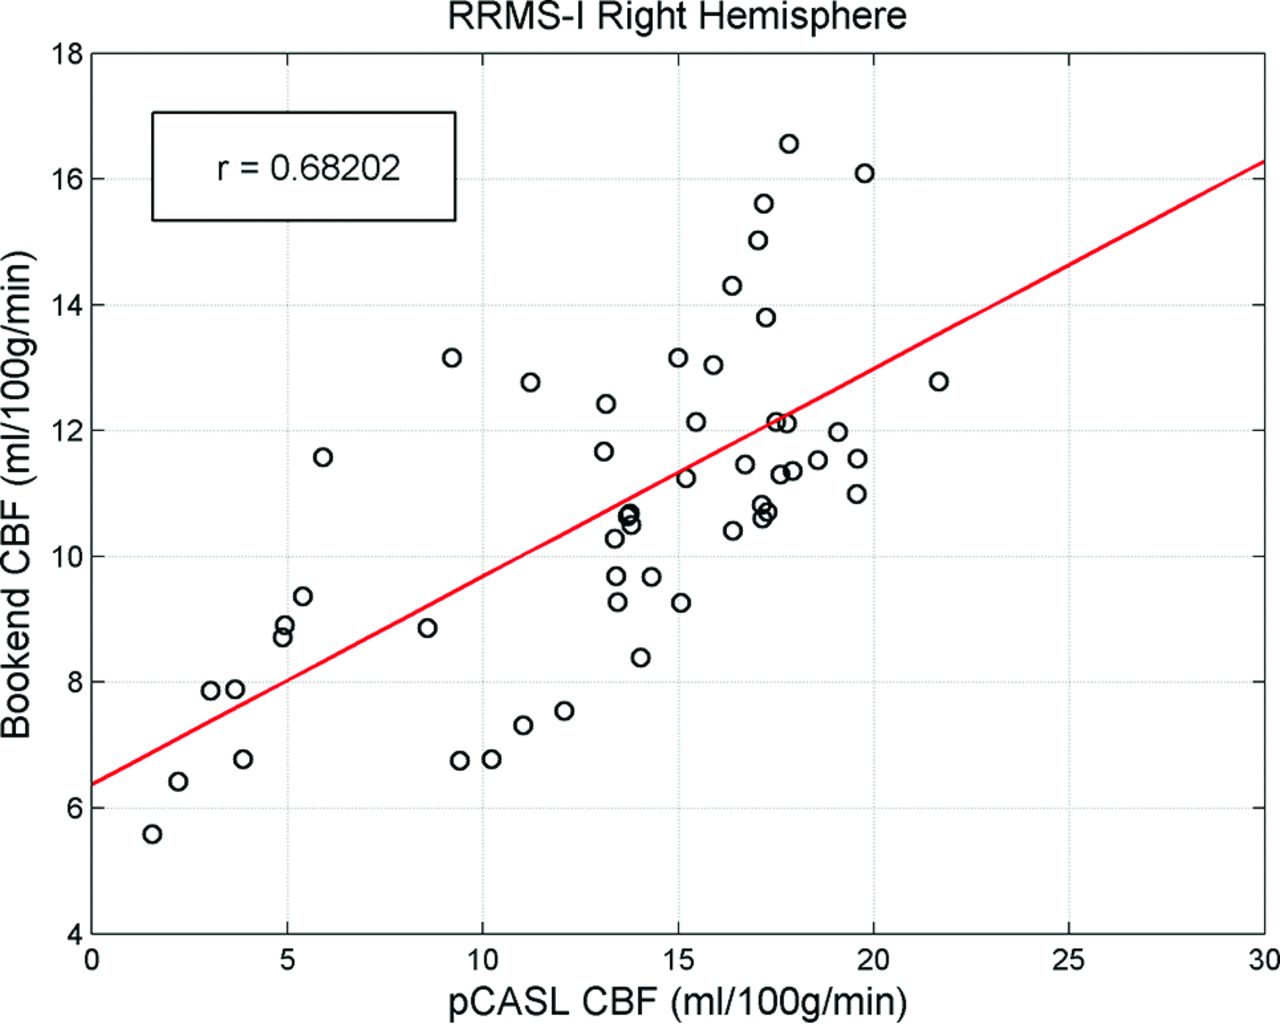
The results of the Brodmann correlation are detailed in Table 4. Figure 3 shows a scatterplot of Brodmann region-wise analysis for the right hemisphere of the RRMS-I group. Each data point represented the average CBF within 1 Brodmann area. CBF intensities showed significant correlation for all test groups (at P < .05, Table 4), with a maximum correlation of r = 0.68 in the right hemisphere of the RRMS-I group between pCASL and bookend modalities. No Brodmann area fell beyond 2 SDs of the linear fit, indicating regional consistency among perfusion modalities. Slope values were <1 for all subject groups (average slope = 0.36).
Brodmann area Pearson correlationa

An example of a Brodmann area Pearson correlation for the right hemisphere of the RRMS-NI subject group. Each data point represents the average CBF intensity within 1 Brodmann area.
Discussion
We have demonstrated moderate correlation between bookend perfusion and pCASL on a voxelwise and Brodmann region basis. The highest correlation was seen within the deep GM structures, but a strong cortical GM, WM, and WML correlation was also demonstrated. CL demonstrated a low correlation and a higher coefficient of variation. Correlation was maintained both in HC and in patients with RRMS. pCASL CBF values were consistently higher than bookend values with absolute difference maps showing the largest deviations within CLs, WMLs, and WM. SNR estimations were expectedly better in bookend perfusion than in pCASL. The SD of the noise distribution was confirmed to be the same order of magnitude as the mean noise value for both modalities, indicating that noise estimations were not greatly affected by image processing.34
It is estimated that ∼44% of patients with RRMS have cognitive impairment, an important factor in quality of life.35 Cerebral hypoperfusion associated with MS is widely documented, yet the pathophysiologic mechanisms are not well-understood.7 Contributing factors such as neuronal loss, primary vascular abnormality, and metabolic dysregulation have been implicated.4,5,7,12 Perfusion imaging provides insight into the pathophysiology and disease severity of MS13 and correlates with cognitive impairment in patients with secondary-progressive MS.12 The finding of hypoperfused, structurally normal GM in MS demonstrates the shortcomings of current clinical MR imaging methods.9,36 The potential for CBF imaging to be used as a clinical biomarker for disease severity in MS could improve monitoring of disease progression and the detection of early disease activity.
Regional variations in the rate of arterial blood flow, brain function, and tissue health play an important role in perfusion signal intensity of all types.7 Thus, WM differences between perfusion techniques (mean differences in Table 2), though not statistically significant in our study, are clinically important, requiring further consideration. pCASL is an inherently low SNR technique that shows good reliability in healthy adults10,11 but is particularly susceptible to slower flow rates present in normal WM and the disease state.37 Indeed, CL, WML, and WM regions showed marginally greater dispersion (CV in Table 2) than other ROIs, consistent with previous literature,37,38 though most voxels fell within 2 SDs of the mean difference. Similarly, the low correlation for cortical lesions is likely due to the summative effect of a small ROI size and low cortical lesion blood flow as previously demonstrated.39 Despite the known confounding effect of arterial transit time changes in disease, especially for pCASL,40 excluding CL, a moderate-to-strong overall correlation between the pCASL and bookend technique was seen. We did not find significant reduction in correlation between the 2 techniques within HC or patients with RRMS with and without impairment. These results indicate that both modalities will give quantitatively comparable estimates of CBF for all patient cohorts, especially on a regional basis. The strongest correlation and lowest dispersion were seen in the deep GM structures. This finding may be attributed to higher pCASL SNR in GM and a lower likelihood of GM voxel contamination by WM tissue from partial volume effects, despite minimizing partial volume effects in cortical GM by applying an 80% probability threshold to the GM masks. The moderate but relatively weaker voxelwise correlations for GM and WM suggest that these techniques may not optimally correlate in studies requiring voxelwise analyses, similar to a recent voxel-based morphometric study.39
Brodmann regions correlated strongly without outlying areas, indicating high regional consistency between pCASL and bookend perfusion techniques. This finding is clinically important in the context of prior studies demonstrating localization of perfusion reduction to common regions in secondary-progressive MS. In particular, patients with secondary-progressive MS with cognitive impairment demonstrated localized reduction in the superior medial frontal cortex and bilateral superior frontal gyri corresponding to Brodmann regions 6, 8, and 9.12 Perfusion correlations, though imperfect, therefore appear sufficiently robust to support using either perfusion technique when studying regional/Brodmann hypoperfusion in RRMS. The study therefore extends the findings of Carroll et al17 by demonstrating meaningful regional correlations for both GM and WM between pCASL and bookend perfusion in HC and patients with RRMS.
While providing quantitative CBF measurements, bookend and pCASL rely on very different methods requiring either gadolinium injection or endogenous tagged blood water, respectively. Pearson correlation slope values for both voxelwise and Brodmann region analysis were both significantly <1, consistent with previous studies showing that the bookend and pCASL technique under-29 and overestimate41 CBF compared with H2 [15O] PET, respectively. We observed generally the smallest slopes in Pearson correlations for WM (Table 2) regions, which is consistent with our observation of mean differences (Table 3) being largest in WM. Recent work by Lindgren et al42 comparing bookend and pCASL techniques in healthy controls demonstrated similar ROI CBF values after sequence calibration, but lower Pearson correlation coefficients despite achieving similar results on Bland-Altman analysis. The correlation difference may be due to postprocessing techniques because we included an automatic rejection of intermediate CBF images affected by patient head motion, which was shown to increase SNR relative to other techniques.27 In addition, Lindgren et al suggested that their pCASL measurements may have been compromised by poor radiolabeling, which was not an issue encountered in the present study.
Limitations of the study include the statistical method of generating average CBF images for each subject group. All voxelwise correlations are likely underestimations of true values because only overlapping parts of each ROI were considered. Because all zero CBF values were excluded from voxelwise averaging, the greater the anatomic variation between subjects or imperfect anatomic registration (resulting in less voxelwise overlap of ROIs), the further the correlation values will be decreased. This method of zero exclusion ensures that average CBF map intensities are not diluted by background voxels, which would result in erroneous overestimation of Pearson correlations. Our correlation values were moderate to strong; this result might be interpreted as insufficient to recommend pCASL as a reasonable technique to longitudinally monitor CBF changes in comparison with bookend DSC. However, moderate correlation strengths are partially due to the exclusion of nonzero values, which would otherwise artificially elevate the correlation coefficient without accurately reflecting meaningful CBF comparisons. Repeatability is a known problem with all perfusion techniques, including pCASL.43 The repeatability of H2 [15O] PET CBF has been recorded at 8% in WM and 10% in GM during a 2-day interval between measurements.44 Such variations are unlikely to have accounted for correlation differences, given that the pCASL and bookend image acquisitions were performed minutes apart. Variability can be mitigated to some extent for pCASL by using postprocessing techniques that eliminate spurious voxels caused by small amounts of head motion.27 Ideally, we would perform perfusion techniques in random order; however, pCASL was acquired, by necessity, before the bookend technique for every subject because of deleterious gadolinium effects on the pCASL signal. We did not use background suppression for the pCASL sequence primarily because of our interest in identifying outlier volume as judged by the raw arterial spin-labeling images.27 Finally, the relatively small sample size of this study (total 58 subjects) may limit the correlation strength of average CBF images between pCASL and bookend techniques.
Conclusions
We have demonstrated that pCASL correlates with bookend perfusion in HC and RRMS diseased states, strongest in deep GM structures and on a Brodmann basis. pCASL shows promise as a noninvasive tool for CBF measurement both in healthy and diseased states such as RRMS.
Footnotes
R.M. D'Ortenzio and S.P. Hojjat contributed equally to this work.
Disclosures: Liesly Lee—UNRELATED: Consultancy: Genzyme Canada, Novartis Canada, Biogen Canada, Roche Canada, Comments: Advisory Board member; Grants/Grants Pending: Genzyme Canada, Novartis Canada, Biogen Canada, Comments: clinical trial participation; Payment for Development of Educational Presentations: Biogen Canada, Comments: review article publication. Anthony Feinstein—UNRELATED: Expert Testimony: MS Society of Canada*; Payment for Lectures (including service on Speakers Bureaus): Teva Neuroscience, Merck-Serono, Novartis, Biogen Idec. Timothy Carroll—UNRELATED: Grants/Grants Pending: National Institutes of Health,* Comments: I have research grants, not directly related to the subject matter of this work; Patents (planned, pending or issued): I have a number of US patents not related to this work.* Richard I. Aviv—RELATED: Grant: Canadian Institute of Health Research,* Comments: peer-reviewed grant held by research institute. *Money paid to the institution.
Robert D'Ortenzio was supported by the Comprehensive Research Experience for Medical Students program at University of Toronto. Dr Aviv was supported by a Canadian Institute of Health Research operating grant. Drs Aviv and Hojjat are supported by a Biogen fellowship funding award. Charles Cantrell is supported by the American Heart Association (14PRE20380310). Dr Carroll is supported by a National Institutes of Health grant (1R21EB017928–01A1).
Indicates open access to non-subscribers at www.ajnr.org
References
- Received May 14, 2016.
- Accepted after revision June 23, 2016.
- © 2016 by American Journal of Neuroradiology


Jump to section
Related Articles
Cited By...
- No citing articles found.