
Abstract
BACKGROUND AND PURPOSE: Brain atrophy is a manifestation of tissue damage in MS. Reduction in brain parenchymal fraction is an accepted marker of brain atrophy. In this study, the approach of synthetic tissue mapping was applied, in which brain parenchymal fraction was automatically calculated based on absolute quantification of the tissue relaxation rates R1 and R2 and the proton attenuation.
MATERIALS AND METHODS: The BPF values of 99 patients with MS and 35 control subjects were determined by using SyMap and tested in relationship to clinical variables. A subset of 5 patients with MS and 5 control subjects were also analyzed with a manual segmentation technique as a reference. Reproducibility of SyMap was assessed in a separate group of 6 healthy subjects, each scanned 6 consecutive times.
RESULTS: Patients with MS had significantly lower BPF (0.852 ± 0.0041, mean ± SE) compared with control subjects (0.890 ± 0.0040). Significant linear relationships between BPF and age, disease duration, and Expanded Disability Status Scale scores were observed (P < .001). A strong correlation existed between SyMap and the reference method (r = 0.96; P < .001) with no significant difference in mean BPF. Coefficient of variation of repeated SyMap BPF measurements was 0.45%. Scan time was <6 minutes, and postprocessing time was <2 minutes.
CONCLUSIONS: SyMap is a valid and reproducible method for determining BPF in MS within a clinically acceptable scan time and postprocessing time. Results are highly congruent with those described using other methods and show high agreement with the manual reference method.
ABBREVIATIONS:
- BPF
- brain parenchymal fraction
- ICV
- intracranial volume
- QRAPMASTER
- quantification of relaxation times and proton attenuation by multiecho acquisition of a saturation-recovery using turbo spin-echo readout
- SyMap
- synthetic tissue mapping
Multiple sclerosis is a chronic neurologic disease characterized by inflammation and degeneration of the CNS. MR imaging is a crucial tool in the diagnosis and follow-up of patients with MS, and quantitative measurements, such as whole and regional brain atrophy and loss of specific tissue types, have gained increasing attention as important clinical markers for determining prognosis and disease severity. A commonly accepted measurement of whole-brain atrophy is calculation of the BPF as brain parenchymal volume divided by ICV.1,2 Several methodologically different studies have shown that patients with MS exhibit a significantly lower BPF compared with healthy control subjects.2⇓⇓⇓–6 Calculation of BPF requires differentiation between brain parenchyma and CSF. Several different techniques based on MR imaging, manual as well as semiautomatic and automatic, can be used to accomplish this.1,7,8 Manual techniques require postprocessing labor that may limit the feasibility of clinical use and may introduce operator-dependent errors, making automated techniques a preferable alternative. Automated methods generally use image intensity histograms of conventional MR image acquisitions, either to separate tissue types directly by setting intensity thresholds or for comparison with brain templates or a priori tissue maps. The signal intensities generated by conventional MR imaging lack an absolute scaling; ie, volume measurements may be influenced by factors such as scanner brand.9 In addition, the time required for the automated postprocessing may make incorporation into the clinical workflow difficult. Another concern is the possible error introduced by partial volume effects,8 when an acquisition voxel consisting of multiple tissue types is assigned to a single type. The presence of many such voxels can cause significant error in the volume estimation.
In this study, we investigated the validity of using SyMap to analyze brain atrophy in MS. This is a further development of synthetic MR imaging, where conventional MR images are synthesized based on MR imaging quantification of the longitudinal R1 relaxation rate, the transverse R2 relaxation rate (defined as 1/T1 relaxation time and 1/T2 relaxation time, respectively), and the proton attenuation PD.10⇓–12 Rather than using images, this new technique defines the tissue types of the brain as specific combinations of these 3 parameters and can thereby synthesize tissue maps,13 similar to the Alfano method.14⇓–16 In this way, the major components of the ICV (gray matter, WM, and CSF) can be defined by physical properties rather than by relative image characteristics. The use of such tissue maps makes it possible to perform fully automated calculation of BPF without the need for manual postprocessing. This method includes calculation of tissue fractions in each voxel, decreasing errors caused by partial volume effect.13 This method is relatively fast, with a postprocessing time that makes it feasible for use in the clinical setting.
The goal of this study was to evaluate the use of SyMap for determination of BPF in patients with MS. We therefore performed a cross-sectional BPF determination for a group of patients with MS and healthy control subjects and compared the group differences with literature values. We also assessed the validity of the technique by comparing it with an established manual segmentation method as well as by investigating the scan-rescan variability.
Materials and Methods
The SyMap Method
Quantitative MR imaging data were acquired by the MR imaging sequence QRAPMASTER,17 which was applied as a patch to the MR imaging scanner. The sequence is a multisection, multiecho, and multisaturation delay acquisition. Five echoes were acquired at multiples of 17.5 ms. Four saturation delays were acquired at 150, 570, 1550, and 3370 ms. This results in 5 × 4 = 20 axial images per section at different echo times and saturation delays, enabling quantification of R1, R2, and PD. The TR was 3.5 seconds for 25 sections of 6-mm section thickness, the FOV was 230 mm, and the in-plane resolution was 1 mm. The scan time was 5 minutes and 45 seconds.
The software SyMRI Brain Studio 0.1.0 (SyntheticMR, Linköping, Sweden) was used to quantify R1, R2, and PD on the basis of the acquisition data, used as an extension of PACS. For some of the scans in this study, the quantification step had already been performed with earlier software versions, but in these patients, no relevant differences relating to BPF calculation had since been introduced. Retrieving data from PACS and calculating the parameters, including BPF, took <2 minutes with the use of a standard 64-bit workstation.
The same software was used to calculate the BPF by using an approach that is shown schematically in Fig 1. The tissue classes segmented by the software (ie, CSF, gray matter, WM, and NON [tissue not belonging to any of the first 3 types, eg, blood vessels]), are recognized as specific combinations of R1, R2, and PD and are thus fixed positions in an R1-R2-PD space. Voxels containing 2 or more tissue types display values in an area between these positions, enabling estimation of partial volume values.13 All voxels containing CSF, gray matter, or WM were included in an ICV mask, followed by a region growing algorithm to ensure that the ICV was represented as a continuous volume and thus also including NON. Special care was taken to ensure that the ICV edge lies at a PD of 50%, under the assumption that it is the interface between CSF (with visible PD = 100%) and bone (with visible PD = 0%). The ICV measurement has been demonstrated to correlate highly (r = 0.99) with a manual reference method.18 CSF partial volume was estimated within the ICV mask. The brain parenchymal volume was calculated as the ICV minus the total CSF volume. Finally, the BPF was calculated as the ratio of brain parenchymal volume and ICV.

Overview of synthetic tissue mapping. A, MR quantification scan of an axial section of the brain results in a pixel-wise measurement of the R1 and R2 relaxation rates and PD. Data of the ROI (gray box) is plotted on the R1-R2 projection of this space in B. CSF, gray matter, and WM have unique combinations of R1, R2, and PD and thus a fixed position in R1-R2-PD space (circles), containing 100% of the indicated tissue types. Partial volume data are located between these identified positions. For CSF, the partial volume values are shown as the white gradient. All voxels containing CSF, gray matter, or WM are included in the ICV mask, followed by a region growing algorithm to ensure that the ICV is represented as a continuous volume (C). D, Within the ICV mask, the partial volume CSF is calculated. The brain parenchymal volume corresponds to the ICV minus the total CSF volume. Finally, the BPF is found as the ratio between brain parenchymal volume and ICV.
In patients with MS, it could be observed that MS lesions were segmented by the software as a mixture of CSF, gray matter, WM, and NON in various ratios. Lesions visually recognized as distinct T1 black holes were generally attributed a larger fraction of CSF compared with lesions that were recognized as predominantly T2-hyperintense lesions, which in many patients were assigned no CSF. In accordance with the BPF calculation described above, the fraction of the lesions that were segmented as CSF was not included in the brain parenchymal volume.
The use of the QRAPMASTER acquisition in conjunction with the SyMRI Brain Studio software constitutes the SyMap method.
Manual Reference Method
Manual segmentation was performed by an experienced operator (K.A.) by using the image analysis software QBrain (Version 2.0; Medis Medical Imaging Systems BV, Leiden, the Netherlands). Using axial acquisitions, each section was manually segmented for the tissue(s) of interest by local thresholding and freehand adjustment where needed. The software calculated the total volume as the number of selected pixels multiplied by the voxel size. This method has been validated by using phantoms of known volume19 and has previously been used to determine both ICV and brain parenchymal volume.18,20 Conventional T2-weighted images were used to determine the ICV, and FLAIR images were used to determine the brain parenchymal volume. All acquisitions had section thicknesses of 2 or 3 mm and an in-plane resolution of 0.43 × 0.43, 0.45 × 0.45, or 0.47 × 0.47 mm. Total time for calculation of BPF exceeded 60 minutes for each subject.
Study Design
Synthetic tissue mapping was performed on patients receiving brain MR imaging scans at Umeå University Hospital in conjunction with conventional MR imaging. It was performed for a variety of diagnoses and systematically on all patients with MS submitted to MR imaging. In this cross-sectional study, all patients 18 years of age or older who had undergone SyMap of the brain between May 2009 and October 2010 were considered for inclusion. Patients with MS as defined by the revised McDonald criteria21 were included in the MS group. Patients who had undergone examination as part of clinical investigation but without signs of neuroinflammatory or structural CNS disease and without having received a diagnosis associated with such changes were included in the control group. The most common diagnoses in the control group were nonspecific paresthesias, headache, or vertigo. Only the chronologically first scan was included for patients who had undergone more than 1 MR imaging during the stated time period. Inclusion criteria were met by 168 examinations. Of these, 33 were excluded because of data lost from the server or data corruption and 1 because of severe MR imaging artifacts. All MS scans were performed with gadolinium contrast, whereas, for the control group, 23 scans were performed with gadolinium contrast and 12 without.
Study Population
The MS group consisted of 68 women and 31 men (99 total). Median (range) age and disease duration (range), defined as time from first symptom, were 43 (18–64) and 9 (0–45) years, respectively. Median (range) Expanded Disability Status Scale score was 2.5 (0–8). Clinical subtypes were 63 relapsing-remitting MS, 27 secondary-progressive MS, and 9 primary-progressive MS. Two patients, previously classified as progressive-relapsing MS, were here included in the primary-progressive MS group. The control group consisted of 19 women and 16 men (35 total). At the SyMap scan, the median (range) age of the group was 35 years (19–65). No statistically significant difference in mean age or percentage of men to women existed between the groups. A subset of 5 patients with MS and 5 control subjects was analyzed with Qbrain as well as with SyMap. A separate group of 6 healthy subjects with median (range) age of 31 (26–45) years was scanned with the QRAPMASTER sequence 6 times; between each scan, the patients exited the MR imaging scanner and walked around the room. This group was used previously to determine reproducibility of SyMap ICV measurements.18
All clinical data were extracted from the Swedish MS register or medical records. The median difference between the MR imaging scan and the Expanded Disability Status Scale evaluation was 29 days. When the difference was larger than 30 days, the medical records were checked, and all had been clinically stable regarding MS in areas relevant to Expanded Disability Status Scale at the time of the MR imaging. Ten patients with relapsing-remitting MS and 1 with secondary-progressive MS had a reported relapse at the time of Expanded Disability Status Scale assessment. Five patients with relapsing-remitting MS had a reported relapse within 30 days before MR imaging; of these, 1 had a reported treatment with corticosteroids at that time (time from corticosteroids to MR imaging was 19 days). Several disease-modifying treatment strategies including absence of such treatment were represented in the MS group. This study was approved by the regional ethical review board in Umeå.
Statistics
Statistical analysis was performed by using SPSS 18 (SPSS, Chicago, Illinois). The Shapiro-Wilks normality test was used to test for normality of distribution. Independent t tests were used for comparison of means for variables with normal distribution, Mann-Whitney U tests were used for variables that did not have a normal distribution. Pearson r was used for correlation testing. Linear regression was performed by using the linear regression tool in SPSS. An α-level of .05 was selected for determining statistical significance. Coefficient of variation was defined as SD/mean × 100%. A Bland-Altman plot22 was used in visualizing the comparison between SyMap and the reference method.
Results
Mean BPF
The mean BPF for patients with MS was 0.852 (SE = 0.0041), which was 0.038 (relative difference, 4.3%) lower than for the control group (0.890, SE = 0.0040; P < .001). Each clinical subtype (relapsing-remitting MS, 0.871, SE = 0.0040; secondary-progressive MS, 0.813, SE = 0.0091; and primary-progressive MS, 0.834, SE = 0.011) had significantly lower mean BPF compared with the control group (P < .001). The BPF was significantly higher for patients with relapsing-remitting MS than for those with secondary-progressive MS (P < .001) or primary-progressive MS (P = .006). No significant difference was observed between patients with secondary-progressive MS and those with primary-progressive MS.
Age, Disease Duration, and Expanded Disability Status Scale in Relation to BPF
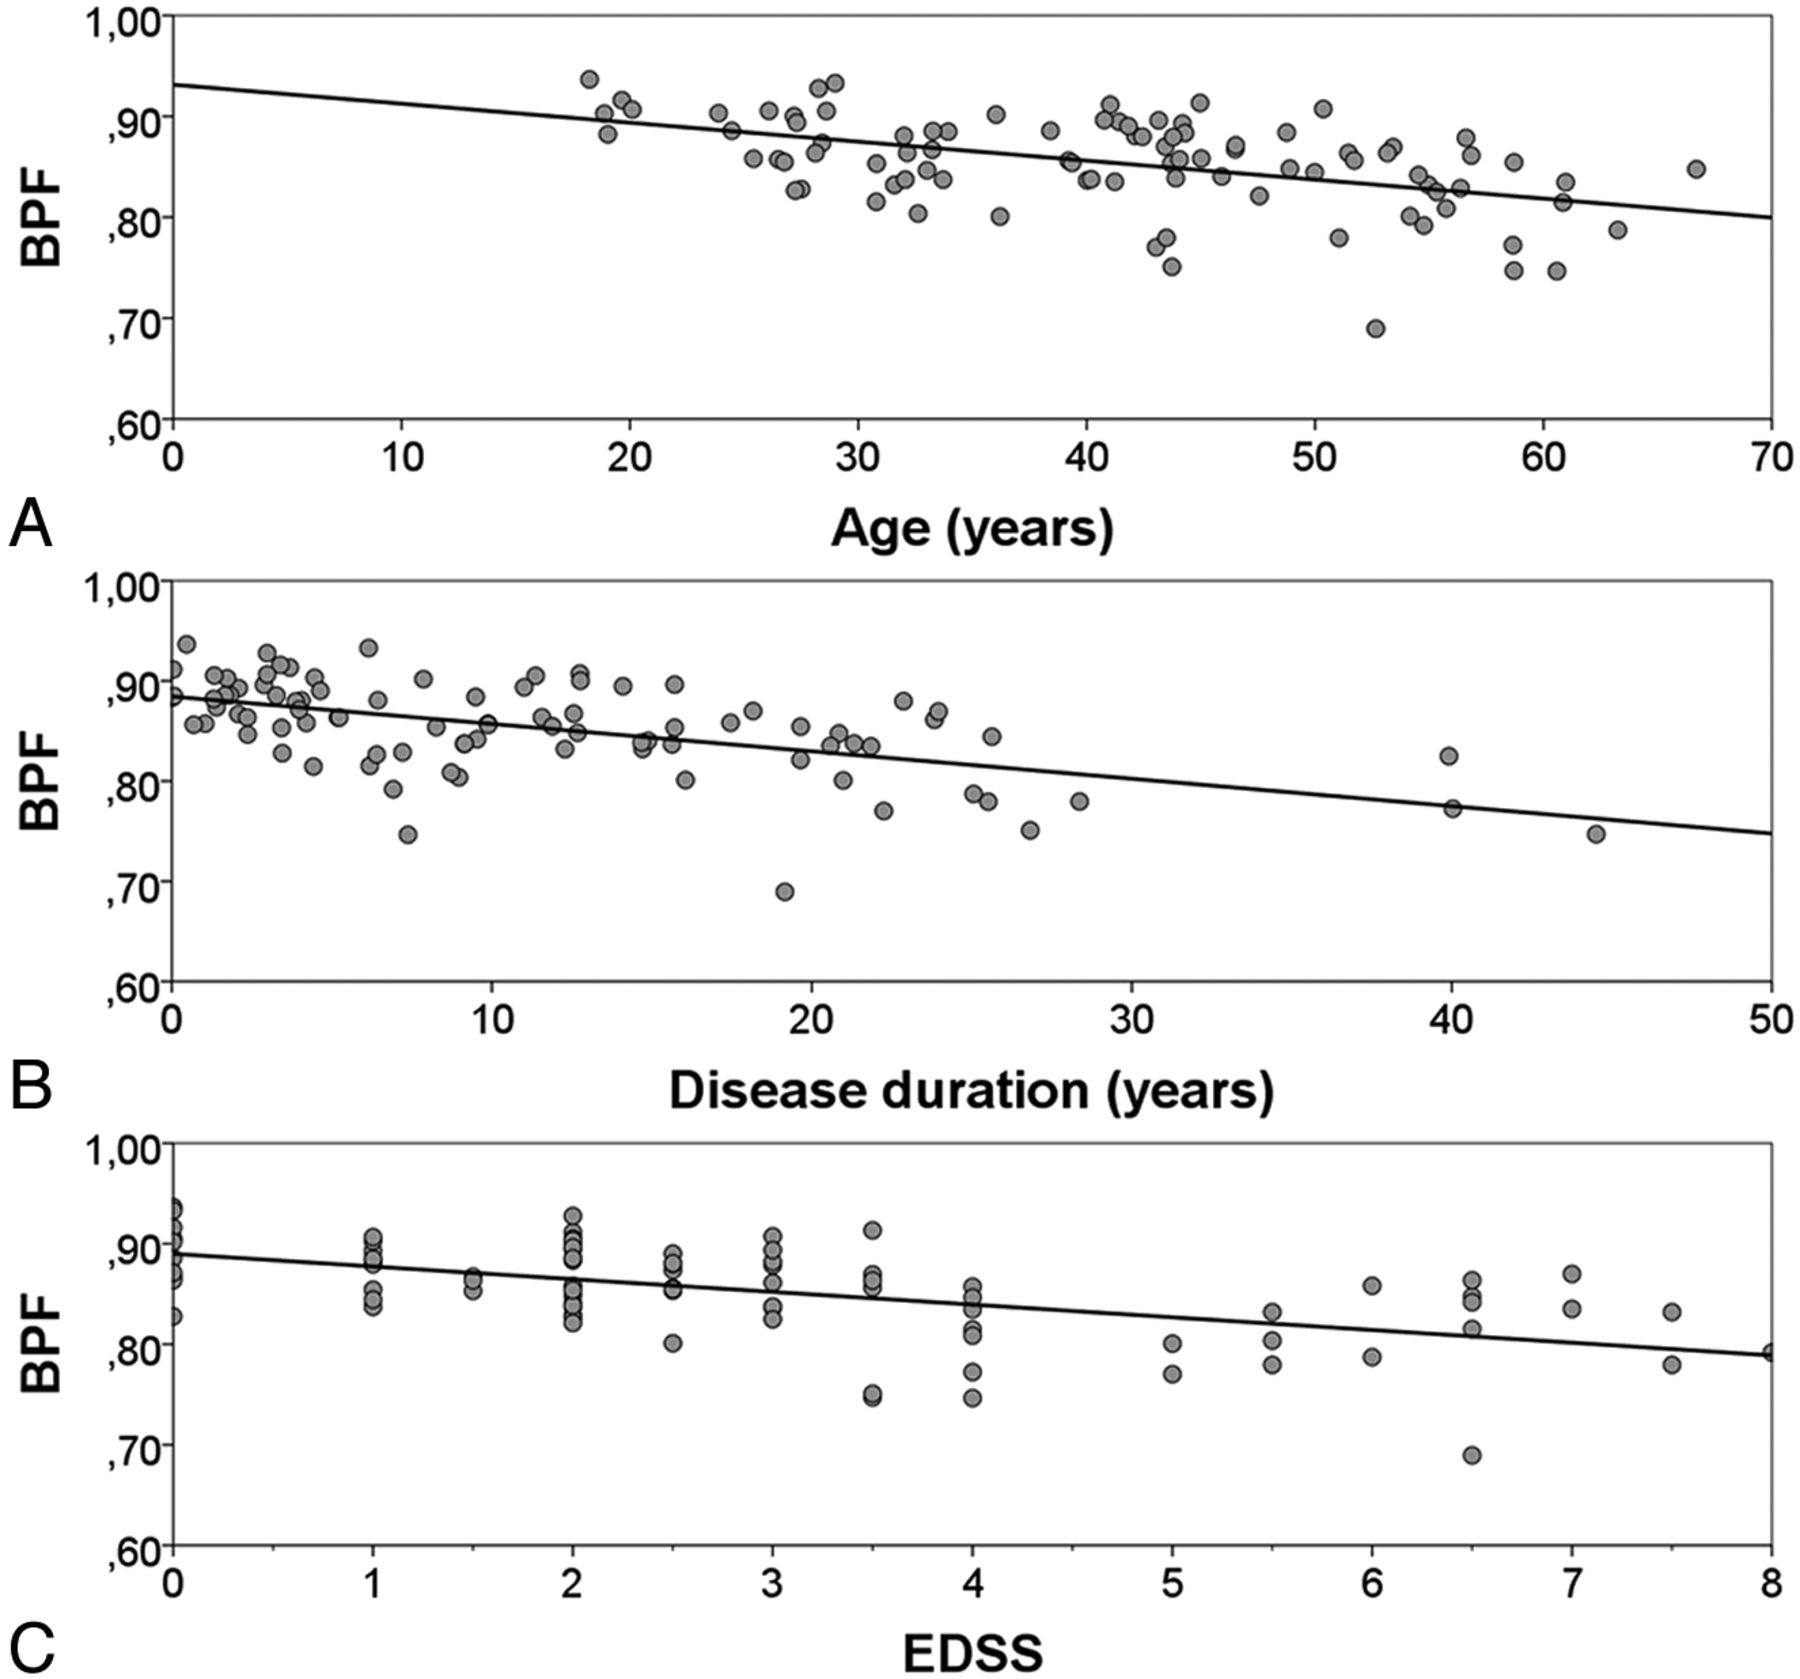
A linear relationship existed between age and BPF in the control group (r2 = 0.36; P < .001). Patients with relapsing onset (relapsing-remitting MS and secondary-progressive MS) had linear relationships between BPF and age, disease duration, and Expanded Disability Status Scale (Fig 2). These relationships retained their significance when adjusted with respect to each other by inclusion in a multiple linear regression model (r2 for the multivariate model was 0.49; P < .001.) These relationships also retained their significance if tested for the whole MS group as well (data not shown). The coefficient for BPF change in relation to age was not significantly different for patients with MS compared with control subjects.

BPF in relation to age, disease duration, and functional impairment. BPF of the patients with relapsing onset MS (relapsing-remitting MS and secondary-progressive MS) plotted as a function of (A) age (r2 = 0.24; P < .001), (B) disease duration (r2 = 0.33; P < .001), and (C) Expanded Disability Status Scale (r2 = 0.32; P < .001).
Comparison between SyMap and the Reference Method
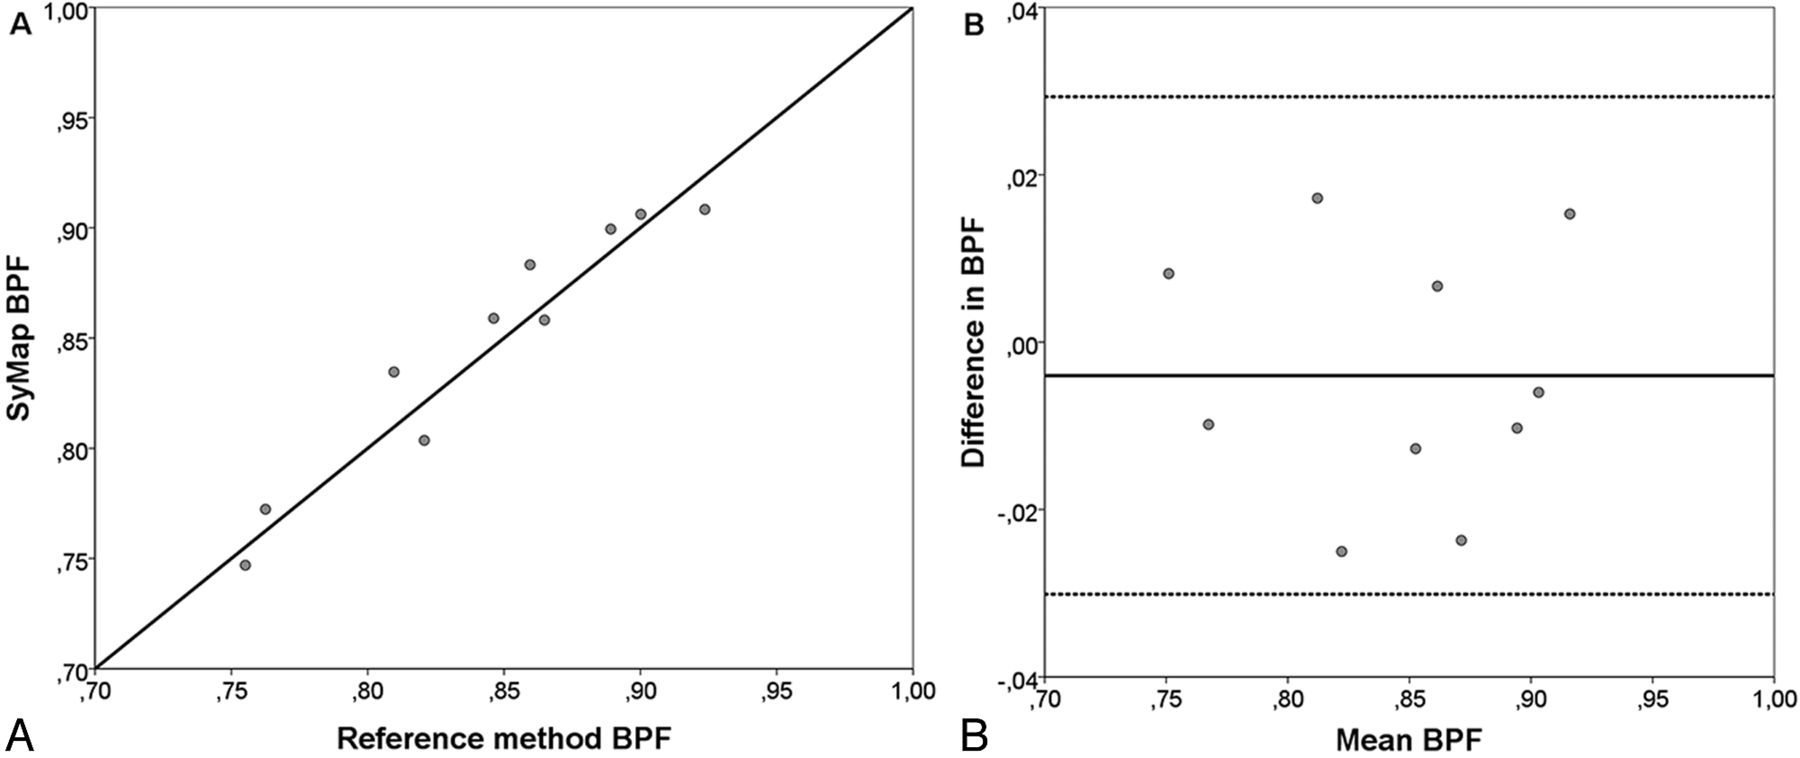
The BPF results from SyMap and the reference method were strongly correlated (r = 0.96, P < .001). There was no significant difference in mean BPF between the methods (P = .88). Mean difference was −0.0040 (SE = 0.025). The comparison between SyMap and the reference method is visualized in Fig 3.

Comparison between SyMap and QBrain. A, BPF values calculated with the SyMap method plotted against the value calculated with the manual reference method for the same subject. B, Difference in BPF between the methods plotted for each subject against the mean BPF for each subject as a Bland-Altman plot. Mean difference (solid line), limits of agreement (dotted lines, mean difference ± 1.96 SD).
Repeated SyMap BPF Measurements
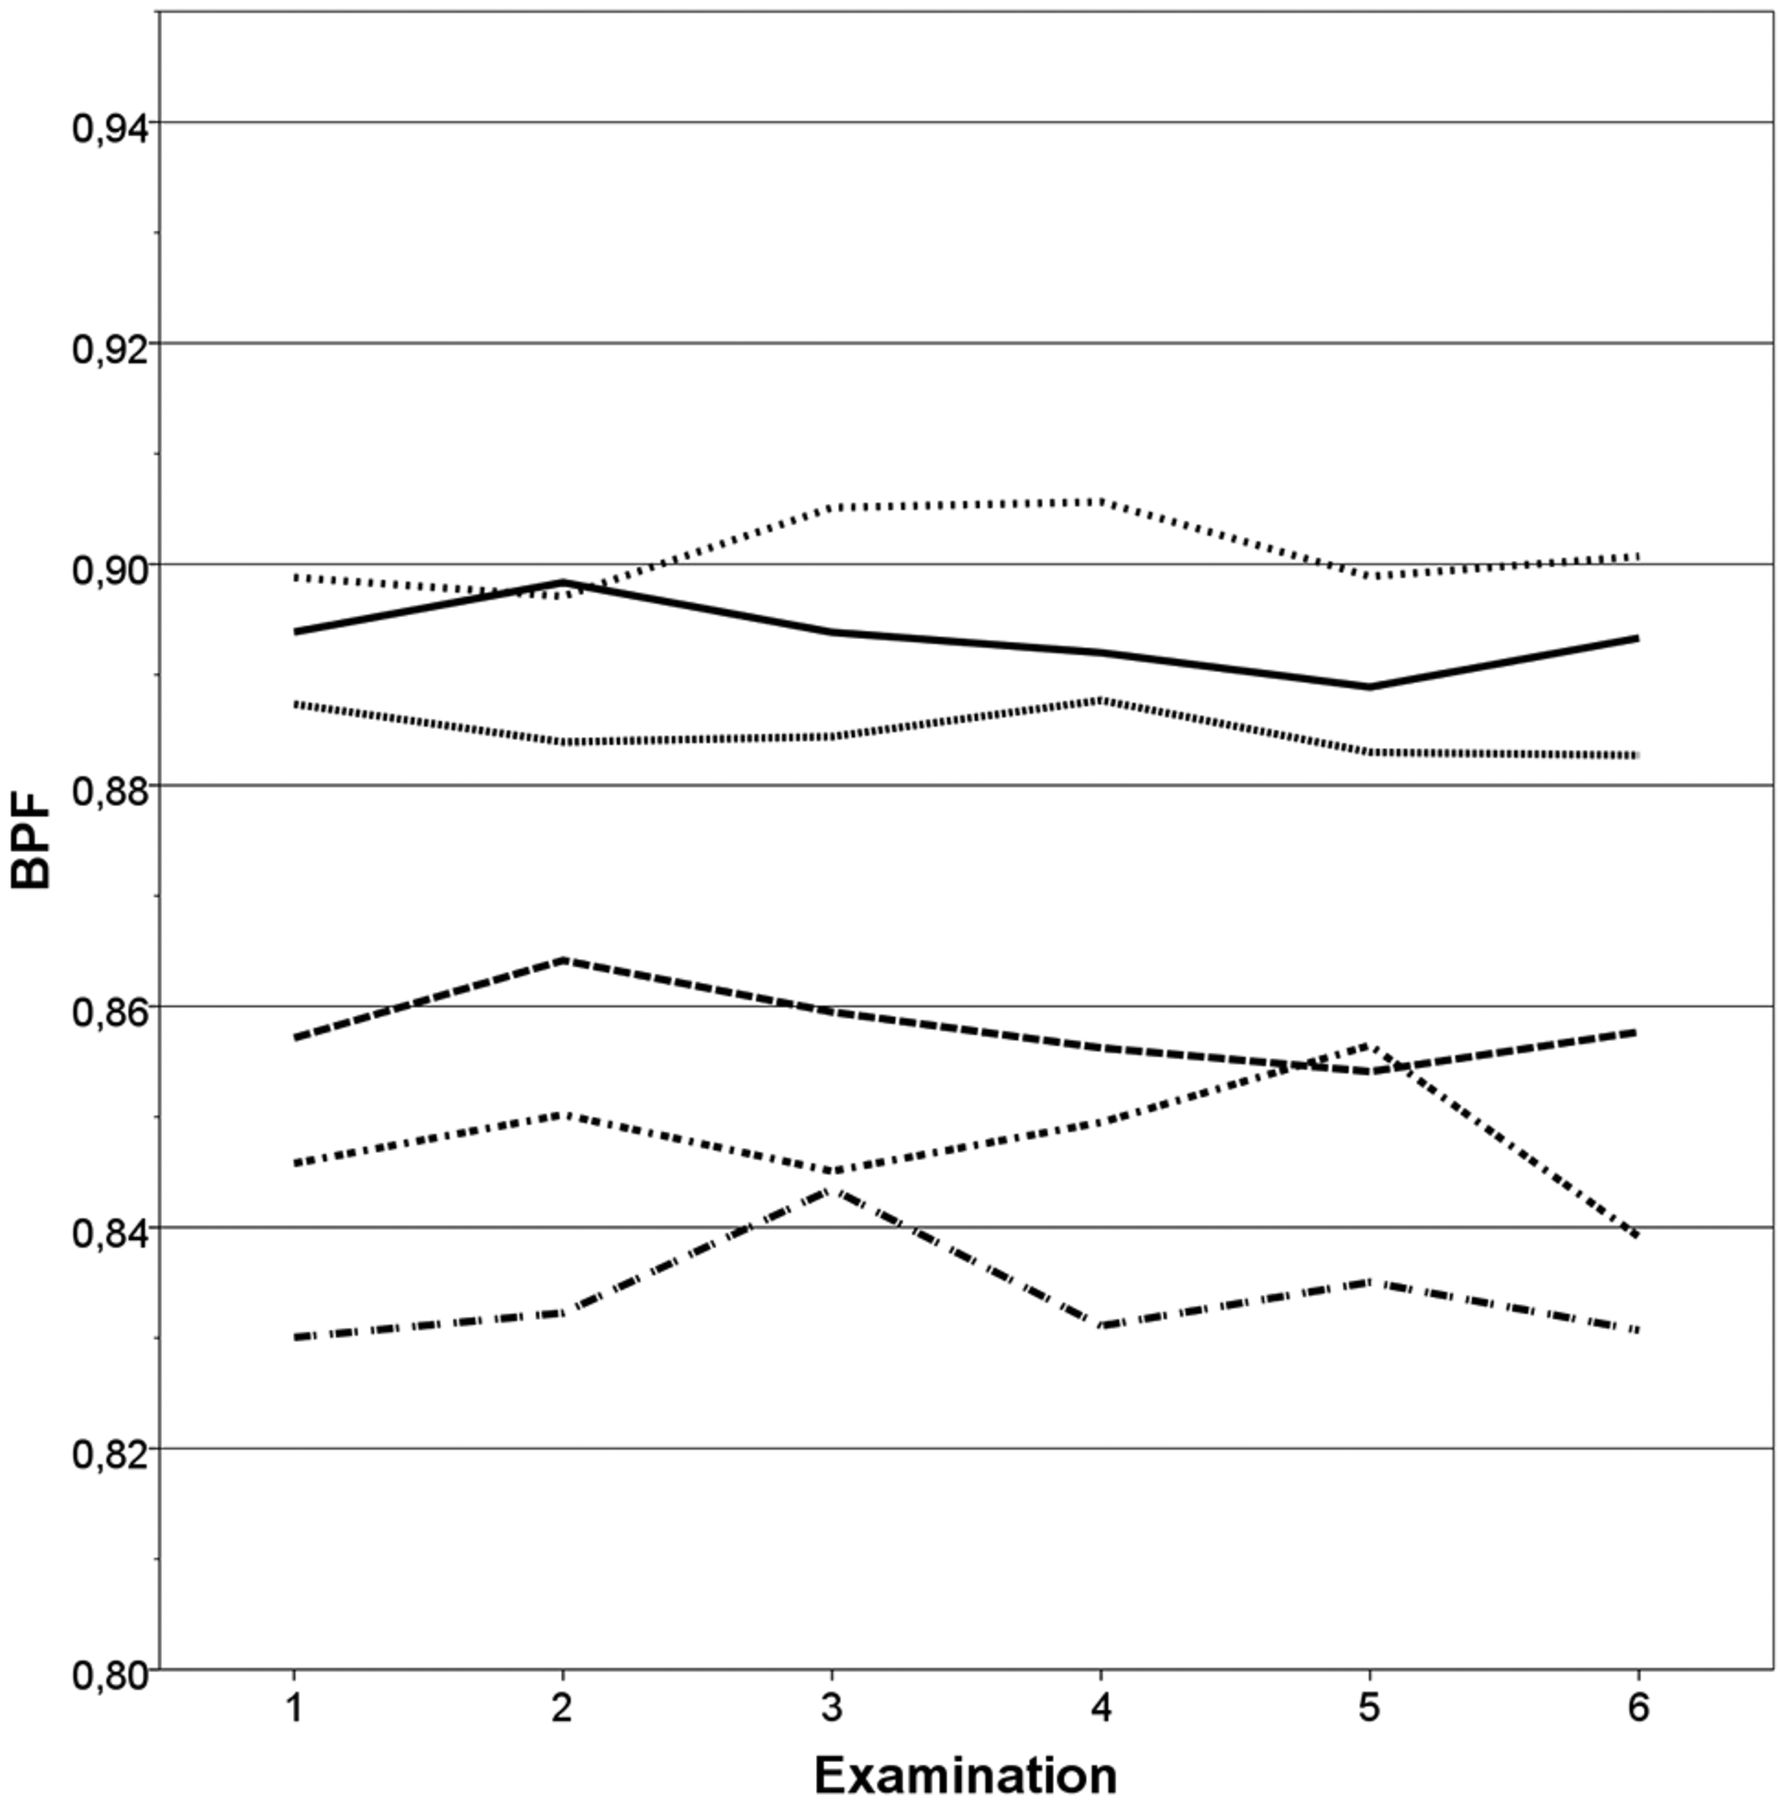
The repeated SyMap BPF measurements are shown for each examination of each subject in Fig 4. The mean coefficient of variation was 0.45% (SE = 0.068%).

Reproducibility of SyMap. BPF of each of the repeated scans plotted for each of the 6 subjects. Coefficient of variation = 0.45% (SE = 0.068%).
Discussion
We investigated the approach of synthetic tissue mapping for fully automated measurement of BPF in patients with MS. A significant difference in mean BPF between patients with MS and control subjects was observed as well as significant linear relationships between BPF and age, disease duration, and Expanded Disability Status Scale. The SyMap method was compared with a manual reference method. We found a strong correlation between the approaches with no significant difference in mean BPF. Repeated SyMap examinations in the same subject yielded consistent BPF measurements.
Comparison with BPF Values from Previous Studies
Individuals with relapsing-remitting MS had a higher BPF (interpretable as a lower degree of atrophy) compared with patients with either secondary-progressive MS or primary-progressive MS. Similar results have been reported previously.23,24 Higher Expanded Disability Status Scale scores and longer disease duration both correlated with a higher degree of atrophy, which has also been reported in earlier studies.3,4 Although caution should be taken in comparing BPF measurements between studies that used different methods,25,26 it is our interpretation that the strong agreement with literature values indicates the validity of using SyMap for determination of BPF.
Comparison with the Manual Reference Method
There is no single generally accepted reference method for measuring BPF, which causes difficulties when validating a new method. In the absence of such a reference standard, it is our opinion that a manual segmentation technique is the best choice of reference method because it provides full visual control over the segmentation process. The method we chose as reference, QBrain, has previously been validated by using phantoms of known volume19 and has been used for determination of both ICV and brain parenchymal volume.18,20 The SyMap results correlated strongly with the manual segmentation results, and the correlation seemed consistent even at lower BPF values. Previous studies indicate that a high degree of atrophy can present a potential problem in automated BPF determination.25,26
Reproducibility of SyMap Measurements
The coefficient of variation found in the repeated SyMap measurements, 0.45%, is comparable with that of other automated methods for measuring BPF. A study from 200525 reports coefficient of variation for 2 semiautomated methods and 1 automated method (structural image evaluation, with normalization of atrophy, cross-sectional27) to be 0.41%, 0.44%, and 0.32%, respectively. A study from 200326 reports coefficient of variation of between 0.31% and 1.07% for an automated method with various pulse sequences.
A review from 20067 reports annual brain volume loss of 0.6%–1.35% in relapsing-remitting MS, 0.6%–0.8% in secondary-progressive MS, and 0.74%–1.30% in primary-progressive MS. Based on the above SyMap coefficient of variation, by using a method described previously,28 it can be calculated that a difference in BPF of at least 1.26% is required to discern a true change in BPF from method variation with 95% certainty. Based on the above literature atrophy rates, this means that a follow-up of at least 1 year is required to detect atrophy in MS when using the SyMap technique.
Limitations and Sources of Error
A potential source of error in the measurements is the signal from subcutaneous fatty tissue near the vertex of the skull. It could potentially influence the edge definition of the ICV in this area where the fat is oriented diagonally through the transverse sections. We also noticed that the SyMap segmentation on rare occasions included the eye in the ICV. It is unlikely that this would affect the results of this study, however, given the minor volume of the eye compared with the complete ICV. No manual adjustment has been performed in this study, because the aim was to evaluate the fully automatic BPF calculation. With minor manual adjustments to the segmentation or further development of the automatic segmentation process, the accuracy of the technique may be enhanced further.
Previous studies have shown that the lesion load affects the segmentation of brain tissue types in patients with MS, especially affecting the ratio of WM to gray matter.29,30 For global brain volume measurements such as normalized brain volume (structural image evaluation, with normalization of atrophy, cross-sectional), it seems that the measurement is only affected in the presence of very high lesion load with signal intensities similar to those of CSF.29 In this study, the lesion load has not been taken into account when determining BPF. It is probable, however, that a very high lesion load with lesion signal intensities similar to those of CSF would affect the BPF measurement when using SyMap in a similar way. As stated in “Materials and Methods,” lesion volume classified as CSF was treated as global CSF, thus lowering the BPF. In the presence of high lesion load, the lesions could be manually reclassified to avoid this potential effect on BPF. Lesioned tissue with relaxometric characteristics similar to CSF, however, consisted predominantly of centers of distinct T1 black holes. It could be argued that these areas do not represent functional brain tissue, and it is, thus, in our opinion, more correct not to regard such tissue as a component of the brain parenchymal volume.
The resolution of the SyMap acquisition is lower than that of standard diagnostic MR imaging, which might lead to a partial volume effect on the calculation of BPF. A model for calculating partial volume is incorporated into the method, however, and thus its influence should be minimized.13 This assumption is supported by the previously observed minor difference between the calculated ICV when using SyMap acquisition compared with manual segmentation when using high-resolution data.18 It cannot be ruled out, however, that the accuracy could be further enhanced, and perhaps the scan-rescan coefficient of variation decreased, if scans of higher resolution and thinner section thickness were to be used.
The MR imaging acquisition was performed with gadolinium contrast for all of the patients with MS and for 23 of the control subjects. The SyMap method is based on tissue characteristics, and segmentation results could be different in the absence of gadolinium. Because the dose and delay between administration and image acquisition was similar for all subjects, this was not included in the analysis. In addition, because gadolinium is restricted to the blood vessels as long as the BBB is intact, the amount of gadolinium present in the partial volume voxels on the border between CSF and brain parenchyma will be low. It is anticipated, therefore, that the possible effect of gadolinium contrast on the differentiation between CSF and brain parenchyma (and thus the BPF measurement) would be very minor.
Usefulness and Importance of this Study
Brain atrophy in MS has been shown to have a clear correlation to clinically important factors in several studies.1,2 At present, the most commonly used radiologic markers for disease activity and progression are the number of new T2 lesions and gadolinium-enhancing T1 lesions. Brain atrophy is generally afforded a subordinate role in follow-up in clinical practice and is often estimated only by visual inspection. In our opinion, it would be rational to implement quantitative volumetric measurements, such as brain atrophy and total lesion load, as factors to be followed alongside the commonly assessed clinical variables.
Most existing methods for MR brain volume determination rely on conventional MR image acquisition, in which volume assessment may be influenced by the MR imaging hardware used.9 Existing methods for volumetric MR measurements also require long postprocessing times that may make implementation difficult in the clinical setting. In contrast, SyMap performs tissue differentiation based on relaxometric characterization of the tissue types. This type of approach has the advantage of an absolute parameter scaling of R1, R2, and PD, which are physical properties independent of the MR imaging scanner itself and, therefore, directly representative of the acquired tissue. Furthermore, this method is relatively fast, with an acquisition time under 6 minutes and a postprocessing time under 2 minutes, making clinical usage highly feasible. We have therefore introduced the technique into the clinical routine follow-up at our MS center. It is our opinion that the quantitative MR imaging data are useful in the clinical management of individual patients and enable longitudinal follow-up of atrophy on a large population-based scale.
Conclusions
SyMap provides a fully automatic way of estimating BPF within an acquisition time of <6 minutes and a postprocessing time of <2 minutes. Results were congruent with literature values and with the manual reference method used. Reproducibility testing showed a coefficient of variation comparable with that of other automated methods. Based on this, SyMap presents itself as a valid, reproducible, and fast method for determining BPF. This method is of high interest, because brain atrophy is an acknowledged and important factor in the prognosis and evaluation of treatment effect in MS. Although refinements of the technique could serve to further enhance its accuracy, the advantages previously discussed make this method very interesting for MS management and research.
Acknowledgments
We thank Erika Peterson of Synthetic MR AB for technical support and assistance with the SyMRI Brain Studio software and the QRAPMASTER sequence, the staff at the Radiology and Neurology departments at Umeå University Hospital for their support and assistance, and Jonathan Gilthorpe for critical reading of the manuscript.
Footnotes
Disclosures: M. Vågberg has received a research grant from BiogenIdec AB and travel grants from BiogenIdec AB and Baxter Medical AB. A. Svenningsson has received research grants from BiogenIdec AB, Bayer-Schering A/G and Baxter Medcal AB as well as travel grants and consulting fees from BiogenIdec AB, SanofiAventis, MerckSerono and Baxter Medical AB. P. Sundström has received travel grants from BiogenIdec AB and consulting fees from Novartis. J.B.M. Warntjes is employed part-time by SyntheticMR AB. ICMJE Disclosures: M. Vågberg—RELATED: Grant: BiogenIdec AB and The Swedish Association of Persons with Neurological Disabilities; Support for Travel to Meetings for the Study or Other Purposes: BiogenIdec AB,* Comments: Travel grant to present part of the study at the 2012 annual meeting of the American Academy of Neurology in New Orleans; UNRELATED: Grants/Grants Pending: BiogenIdec AB; Travel/Accommodations/Meeting Expenses Unrelated to Activities Listed: BiogenIdec AB,* Novartis,* Baxter Medical AB,* Comments: Travel grants to scientific meetings. J.B.M. Warntjes—UNRELATED: Employment: Part-time employment at SyntheticMR AB. P. Sundström—UNRELATED: Board Membership: Novartis, Comments: Advisory Board; Travel/Accommodations/Meeting Expenses Unrelated to Activities Listed: Travel expenses,* Comments: 50% of travel expenses to conference paid by Biogen to my department. A. Svenningsson—RELATED: Grant: BiogenIdec Sweden AB,* Comments: Unconditional research grant. *Money paid to institution.
This study was partially funded by an unrestricted grant from BiogenIdec AB. Financial support was also received from The Swedish Association of Persons with Neurologic Disabilities, through regional agreement between Umeå University and Västerbotten County Council on cooperation in the field of Medicine, Odontology and Health (ALF) and by the Objective 2 Norra Norrland-EU Structural Fund.
Previously presented in poster form at: Annual Meeting of the American Academy of Neurology, April 21–28, 2012; New Orleans, Louisiana.
References
- Received May 1, 2012.
- Accepted after revision June 14, 2012.
- © 2013 by American Journal of Neuroradiology
In this issue


Jump to section
Related Articles
Cited By...
- Synthetic MRI in Progressive MS: Associations with Disability
- Aging and the Brain: A Quantitative Study of Clinical CT Images
- Gadolinium Retention in the Brain: An MRI Relaxometry Study of Linear and Macrocyclic Gadolinium-Based Contrast Agents in Multiple Sclerosis
- Normal Values of Magnetic Relaxation Parameters of Spine Components with the Synthetic MRI Sequence
- Improved Precision of Automatic Brain Volume Measurements in Patients with Clinically Isolated Syndrome and Multiple Sclerosis Using Edema Correction
- Loss of corticospinal tract integrity in early MS disease stages
- Rituximab in multiple sclerosis: A retrospective observational study on safety and efficacy
- Clinical Feasibility of Synthetic MRI in Multiple Sclerosis: A Diagnostic and Volumetric Validation Study
- Quantitative MRI for Rapid and User-Independent Monitoring of Intracranial CSF Volume in Hydrocephalus
- Quantitative MRI for Analysis of Active Multiple Sclerosis Lesions without Gadolinium-Based Contrast Agent
- Effects of Gadolinium Contrast Agent Administration on Automatic Brain Tissue Classification of Patients with Multiple Sclerosis