
Abstract
BACKGROUND AND PURPOSE: Quantitative susceptibility mapping allows overcoming several nonlocal restrictions of susceptibility-weighted and phase imaging and enables quantification of magnetic susceptibility. We compared the diagnostic accuracy of quantitative susceptibility mapping and R2* (1/T2*) mapping to discriminate between patients with Parkinson disease and controls.
MATERIALS AND METHODS: For 21 patients with Parkinson disease and 21 age- and sex-matched controls, 2 radiologists measured the quantitative susceptibility mapping values and R2* values in 6 brain structures (the thalamus, putamen, caudate nucleus, pallidum, substantia nigra, and red nucleus).
RESULTS: The quantitative susceptibility mapping values and R2* values of the substantia nigra were significantly higher in patients with Parkinson disease (P < .01); measurements in other brain regions did not differ significantly between patients and controls. For the discrimination of patients with Parkinson disease from controls, receiver operating characteristic analysis suggested that the optimal cutoff values for the substantia nigra, based on the Youden Index, were >0.210 for quantitative susceptibility mapping and >28.8 for R2*. The sensitivity, specificity, and accuracy of quantitative susceptibility mapping were 90% (19 of 21), 86% (18 of 21), and 88% (37 of 42), respectively; for R2* mapping, they were 81% (17 of 21), 52% (11 of 21), and 67% (28 of 42). Pair-wise comparisons showed that the areas under the receiver operating characteristic curves were significantly larger for quantitative susceptibility mapping than for R2* mapping (0.91 versus 0.69, P < .05).
CONCLUSIONS: Quantitative susceptibility mapping showed higher diagnostic performance than R2* mapping for the discrimination between patients with Parkinson disease and controls.
ABBREVIATIONS:
- Az
- area under the receiver operating characteristic curve
- PD
- Parkinson disease
- QSM
- quantitative susceptibility mapping
- ROC
- receiver operating characteristic
The diagnosis of Parkinson disease (PD), a movement disorder with varying combinations of rest tremors, bradykinesia, rigidity, and postural instability, is based mainly on clinical assessments that do not yield great accuracy. One objective of noninvasive neuroimaging techniques in PD is to find markers that aid in the diagnosis, disease-progression monitoring, and long-term drug-impact evaluation.1 MR imaging with rich tissue contrasts and high spatial resolution offers a unique value for probing PD brain structure and function.
Particularly, there has been substantial interest in in vivo MR imaging of increased nigral iron content,2,3 a pathophysiologic feature involved in the selective dopaminergic neurodegeneration of the substantia nigra in patients with PD.4 Iron likely stored in ferritin5 is highly paramagnetic and can be sensitized in MR imaging by using relaxation contrast (such as T2-weighted imaging) and susceptibility contrasts (such as T2*-weighted imaging and R2* [1/T2*] mapping).6 For quantitative study of brain iron, R2* mapping has been used,7,8 demonstrating increased iron in the substantia nigra in patients with PD,9⇓–11 and a recent postmortem correlation study has demonstrated that the relationship with R2* can be linear in regions of more uniform iron deposition.12 However, R2* mapping depends on field strength,13 contains substantial blooming artifacts that increase with TE,14 and generally relates to iron concentration in a complex way, varying from linear to quadratic.15⇓–17
Recently, quantitative susceptibility mapping (QSM) has been developed to determine tissue magnetic susceptibility from gradient-echo data.18⇓–20 Because ferritin susceptibility is much stronger than other tissues in brains free of hemorrhages and aggregates of other metals, QSM can be used to quantify brain iron distribution.21,22 Clinical data from patients with multiple sclerosis suggest that QSM is more sensitive than R2* mapping in detecting changes in multiple sclerosis brains.23
According to a previously published study using QSM, a significant difference was not found between patients with PD and healthy control subjects for the susceptibility value of the substantia nigra.24 However, because only 9 patients were available for the previous study, the clinical potential of QSM has not been fully elucidated. Furthermore, the difference between QSM and the standard method for studying iron change, including R2* mapping, has not been evaluated in patients with PD. In this study, we tested the hypothesis that QSM is more sensitive than R2* mapping to pathologies in PD brains by comparing QSM and R2* values in 6 brain structures (the thalamus, putamen, caudate nucleus, pallidum, substantia nigra, and red nucleus) in patients with PD and healthy controls.
Materials and Methods
MR Imaging
All subjects underwent brain MR imaging with QSM. All studies were performed on a 3T MR imaging system (Signa Excite 3T; GE Healthcare, Milwaukee, Wisconsin) by using a dedicated 8-channel phased array coil (Invivo, Gainesville, Florida). QSM was obtained with a 3D flow-compensated multiecho spoiled gradient echo sequence.25 The imaging parameters included the following: coronal planes covering the brain; number of TEs, 11; first TE, 4.5 ms; TE spacing, 5 ms; TR, 58.4 ms; flip angle, 15°; bandwidth per pixel, ±62.5 Hz; FOV, 22 × 16.5 cm; acquisition matrices, 320 × 416; section thickness, 1.5 mm; imaging time, 7 minutes 1 second. A parallel imaging method (the array spatial sensitivity encoding technique) was used with a reduction factor of 2. In this study, 56 coronal sections were used to capture the center of the brain that contains the deep gray nuclei structures. QSM was reconstructed from the complex data obtained during the gradient-echo sequence by using the morphology enabled dipole inversion technique.19 After the complex multiecho MR images were saved, a nonlinear fitting was performed to estimate the magnetic field inhomogeneity, followed by a magnitude-guided phase unwrapping.20 The background field was further removed by applying the projection to the dipole fields method.26 Finally, the remaining tissue field was inverted to generate a susceptibility map by using the morphology enabled dipole inversion method.20 An empirically determined regularization parameter of 1000 was consistently applied to all cases. All 11 echoes were used with weightings proportional to their signal-to-noise ratios for reconstructing QSM and R2*.27,28 R2* mapping was reconstructed from the magnitude gradient-echo data with a monoexponential fit by using the log-linear method.
In addition, all patients underwent our standard brain MR imaging protocol, including T2-weighted imaging, FLAIR imaging, and T1-weighted imaging (spin-echo or 3D fast spoiled gradient-echo imaging). The imaging parameters (TR, ms/TE, ms/TI, ms/NEX/imaging time) were 4500/85/not applicable/1 time/2 minutes 10 seconds for T2-weighted imaging; 12,000/140/2600/2 times/3 minutes 20 seconds for FLAIR imaging; and 400/4/not applicable /2 times/2 minutes 40 seconds for spin-echo T1-weighted images. T2 and T1-weighted images and FLAIR images were acquired at a section thickness of 5 mm, an intersection gap of 2.5 mm, an FOV of 22 cm, and a matrix of 256 × 192. The following parameters were used for spoiled gradient-echo imaging: TR, ms/TE, ms, 10/4; flip angle, 10°; bandwidth, 42 kHz; section thickness, 1.2 mm; matrix, 256 × 256; FOV, 24 × 24 cm; imaging time, 3 minutes 56 seconds. Parallel imaging technique (a reduction factor of 2) was used for only T2-weighted imaging and spoiled gradient-echo imaging.
Patients and Controls
Our institutional review board approved this retrospective study analyzing existing patient data with patient information de-identified and waived informed consent. At our institution, the 3D flow-compensated multiecho spoiled gradient-echo sequence is part of routine brain MR imaging for indications including the following: 1) screening of minor hemorrhage; and 2) evaluation of vascular disease, movement disorder, or degenerative disease. From the patients who underwent brain MR imaging examinations, including the 3D flow-compensated multiecho spoiled gradient-echo sequence between May 2012 and December 2012, the study included 21 patients whose PD was diagnosed by 2 of the authors (K.O. and T.U. with 18 and 30 years of experience, respectively, in movement disorders). All fulfilled the UK Parkinson's Disease Brain Bank criteria for the diagnosis of idiopathic PD. At the time of testing, 19 patients were on antiparkinsonian medication. From this data base, we also selected the 21 age- and sex-matched subjects as controls, who had no history of neurologic or psychiatric diseases. Indications for their examination included headache, anterior communicating and middle cerebral artery aneurysms, bilateral upper extremity numbness, benign positional vertigo, and hemifacial spasm. In all patients with PD and controls, conventional imaging results were normal. Demographic and clinical data on all study subjects are shown in Table 1.
Demographic and clinical data of subjects studied
Image Analysis
Two neuroradiologists (S.K. and J.M. with 16 and 11 years of experience, respectively) who were blinded to the subject data manually traced ROIs by using Image J software (National Institutes of Health, Bethesda, Maryland). For the ROI measurements by the neuroradiologists, each image technique (QSM and R2* mapping) was analyzed separately, and only 1 technique was shown at a time. ROIs of the nuclei were drawn on the basis of the anatomic structures on the 3D QSM and R2* maps. The ROIs included the bilateral substantia nigra, red nuclei, globus pallidus, head of the caudate nuclei, putamina, and thalami (Fig 1). Data on each structure were obtained from all visible sections. We calculated the mean QSM and R2* values for each bilateral structure using all echoes according to their signal-to-noise ratio.27,28 To analyze the QSM and R2* values, we calculated the average of the value in the bilateral regions. For each subject (patients with PD and controls), we then used the mean QSM and R2* values obtained by 2 neuroradiologists as the final values and evaluated all the statistical analyses by using the final value. Data were used to calculate the sensitivity, specificity, and the area under the receiver operating characteristic (ROC) curve (Az) of each method for discriminating patients with PD from controls.

QSM images (A and B) and selected regions of interest (C and D). CA indicates caudate nucleus; GP, globus pallidus; PU, putamen; RN, red nucleus; SN, substantia nigra; TH, thalamus.
In addition, 1 radiologist (Y.M. with 8 years of experience) measured the volume of the structures on QSM images. The volume was calculated by tracing the boundary of the structure manually from the head to its tail and then summing the cross-sectional areas of the entire structure and multiplying the sum by the section thickness.
Statistical Analysis
We used statistical software (StatView 5.0; SAS Institute, Cary, North Carolina). Differences of P < .05 were considered statistically significant. Differences in the sex- and age distribution of the patients with PD and controls were compared with the Fisher exact test for sex and the 2-tailed Student t test for age. Differences in the QSM and R2* values of the patients with PD and controls were analyzed with the Mann-Whitney U test. A computer program (ROC-kit, 1.1B2 β Version; Charles E. Metz, University of Chicago, Chicago, Illinois) was used to compare the diagnostic performance of the different MR images and to compute the ROC curve and the Az. To discriminate between patients with PD and controls, we established a cutoff value for the signal-intensity ratio based on the highest Youden Index (eg, QSM value of >0.210).29 Sensitivity, specificity, and accuracy for discriminating patients with PD from the controls were calculated by using these cutoff values. Accuracies were compared with the Fisher exact test. To measure interobserver agreement with respect to the QSM and R2* values recorded by the radiologists, we used the Kendall W test, in which W < 0.20 = poor, 0.21–0.40 = fair, 0.41–0.60 = moderate, 0.61–0.80 = good, and 0.80–1.00 = excellent agreement.
Results
As shown in Table 1, there were no statistically significant differences in the sex and age distribution of the patients with PD and controls. The median Hoehn and Yahr stage of patients with PD was 2, and 20 of 21 patients with PD had lateralized motor symptoms.
The QSM and R2* values for the substantia nigra were significantly higher in patients with PD than in controls (QSM value 0.224 versus 0.199, P < .01; Table 2 and Fig 2). The QSM and R2* values of all other brain regions measured (the red nucleus, globus pallidus, head of caudate, putamina, and thalami) did not differ significantly between patients with PD and the controls. For the 20 patients with PD who had lateralized motor symptoms, we compared the QSM values of both sides (contralateral and ipsilateral to the clinically more affected side) and found that there was no significant difference between them (0.222 versus 0.225, P = .13).
Regional QSM and R2* values

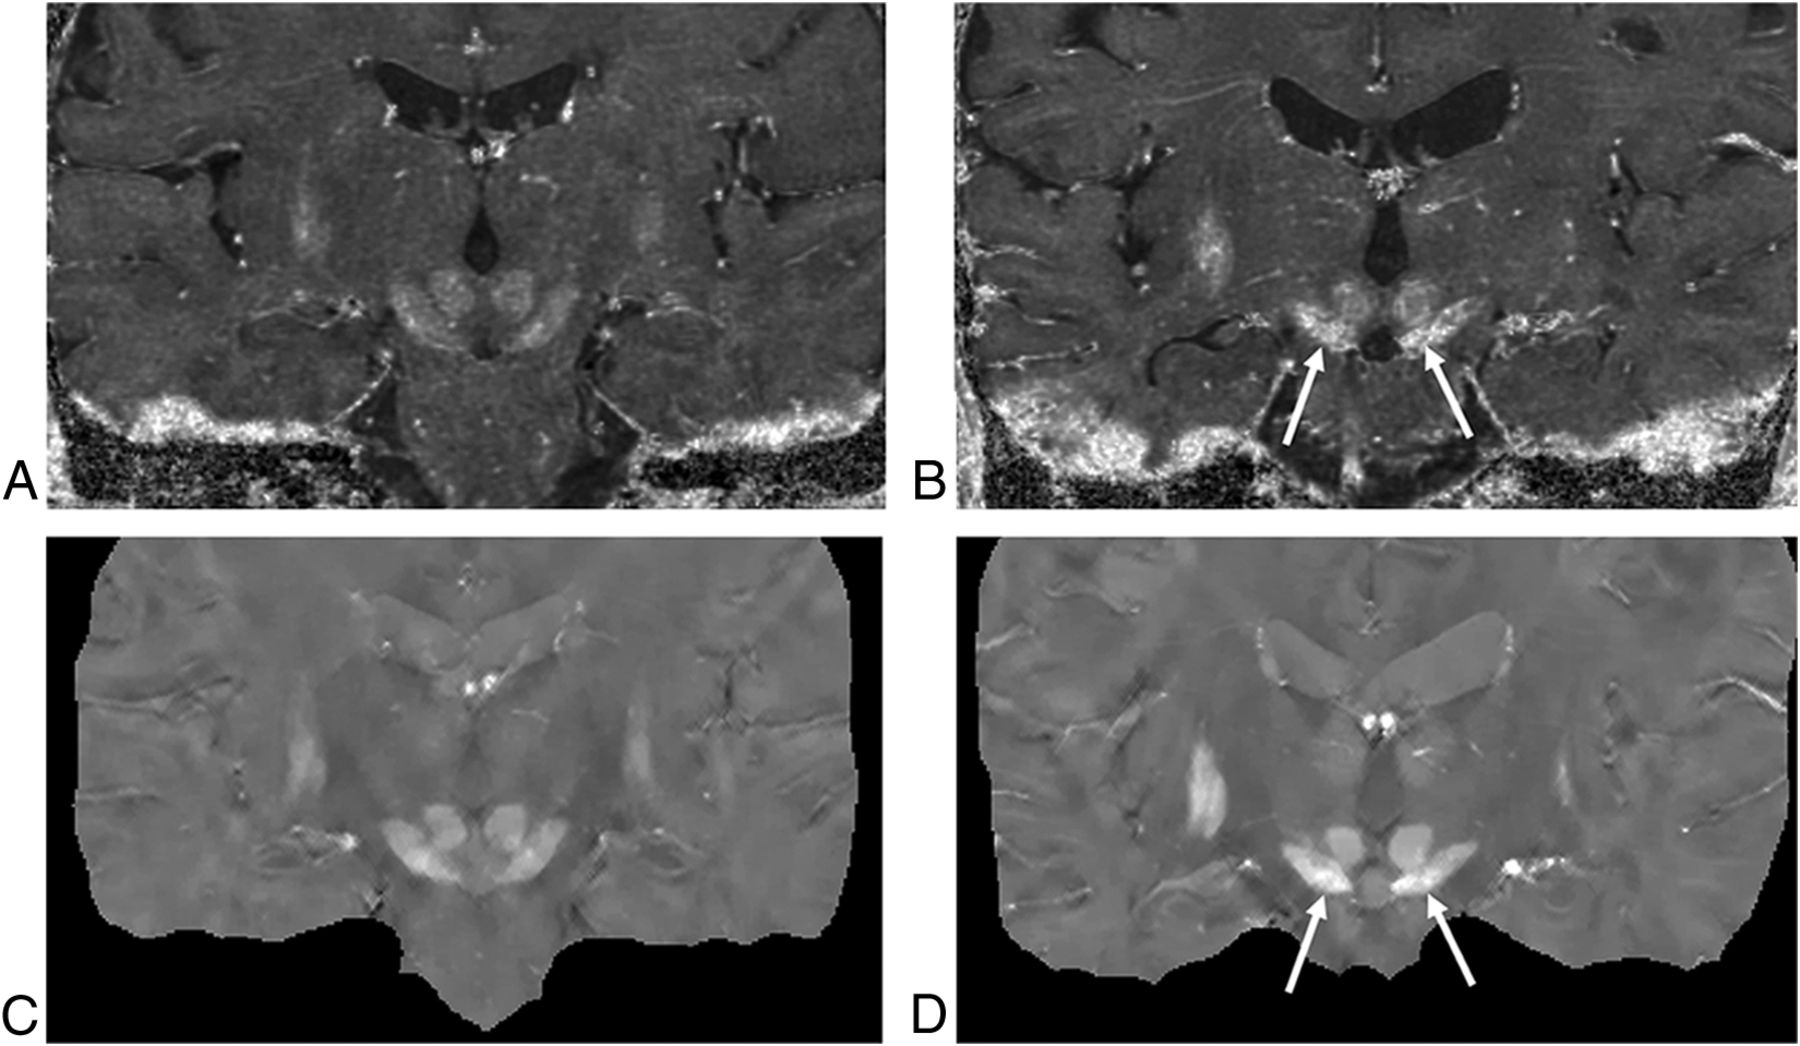
R2* (top row) and QSM maps (bottom row) of 2 subjects, a 68-year-old control subject (A and C) and a 66-year-old patient with PD (B and D). Both the R2* and the QSM maps show higher paramagnetic susceptibility in the substantia nigra of the patient with PD than in the control (arrows).
For the mean total number of sections and the mean volume, there were no significant differences between the patients with PD and the controls (Table 3).
Mean number of sections and mean volume for the ROI measurements
Specific Changes in the Bilateral Nigral Average Phase Values in Patients with PD
For the discrimination between patients with PD and controls, ROC analysis suggested optimal cutoff values of >0.210 for the QSM value and of >28.8 for the R2* value; these values were based on the Youden Index. The sensitivity, specificity, and accuracy of QSM and R2* are shown in Table 4. The accuracy was significantly higher for QSM than for R2* (P < .05).
Sensitivity, specificity, accuracy, and Az value of analyses of data in patients with PD and control subjectsa
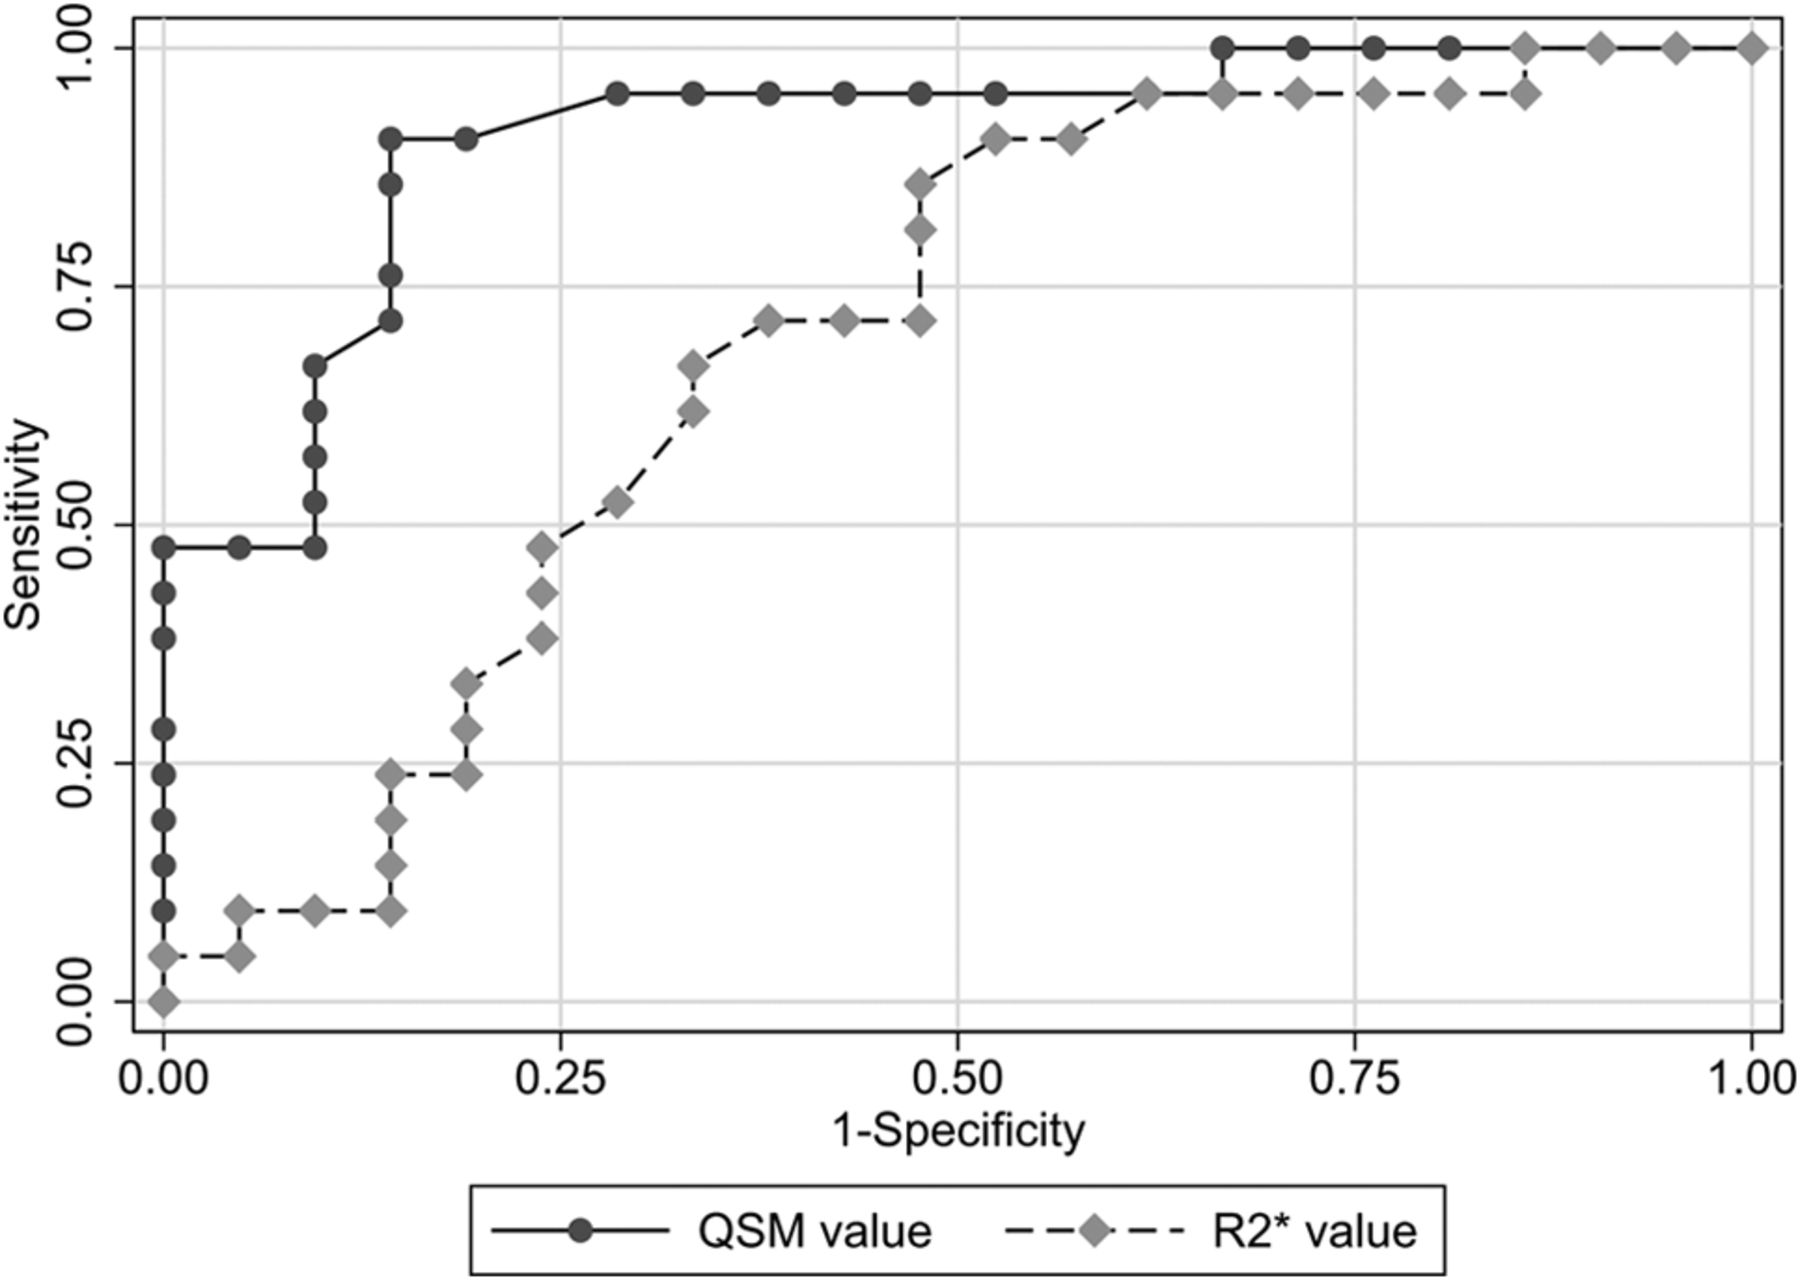
The ROC curves are plotted in Fig 3. The Az value was 0.91 for QSM and 0.69 for R2*. Pair-wise comparisons showed that the Az for QSM was significantly larger than that for R2* (P < .05).

Graphs of the ROC curves for discriminating patients with PD and the controls. The Az value was 0.91 for QSMaverage, 0.90 for QSMmaximum, 0.69 for R2*average, and 0.71 for R2*maximum. Pair-wise comparisons showed that the Az for QSMaverage and QSMmaximum was significantly larger than that for R2*average and R2*maximum (P < .05).
Interobserver Agreement
For evaluating QSM data, interobserver agreement was good and the Kendall W value was 0.685. For the R2* mapping, interobserver agreement was moderate and the Kendall W value was 0.415.
Discussion
Our MR imaging data on quantifying brain changes in patients with idiopathic PD demonstrated that the QSM values were increased in the substantia nigra, but not in the red nucleus, globus pallidus, head of caudate, putamina, and thalami. The QSM value more accurately discriminated patients with PD and the controls than the R2* value for measuring the pathologic change in the substantia nigra. Moreover, for the assessment of interobserver agreement, the QSM measurement was also superior to the R2* measurement.
Identifying a sensitive MR imaging technique for studying substantia nigra change in patients with PD is highly valuable for a PD study because the substantia nigra is the location of dopaminergic cell death in PD. Although, in this study, the QSM values and R2* values of the substantia nigra were significantly higher in patients with PD, the analyses of the volume of the substantia nigra showed no significant difference between the patients with PD and controls. The susceptibility may therefore be a more sensitive marker for the detection of abnormalities of the substantia nigra. Highly paramagnetic iron can affect both relaxation and susceptibility contrasts in MR imaging. Accordingly, a wide range of MR imaging techniques has been used to study substantia nigra change in PD, including R2 (1/T2), R2*, and susceptibility-weighted imaging.30 Previously, R2* mapping was identified as being more sensitive than R2 mapping for measuring substantia nigra change in PD.9 As a result, R2* mapping has become the standard method for studying PD iron change.11,31⇓⇓–34 Our ROC and interobserver agreement results here show that QSM is more accurate than R2* mapping for measuring substantia nigra change in PD; this finding is consistent with that in a recent study showing that QSM is more accurate than R2* mapping in measuring basal ganglia change in multiple sclerosis.23 Therefore, QSM may replace R2* mapping for MR imaging measurement of iron-associated change in the brain.
The physics of magnetic susceptibility may explain why QSM is more accurate than R2* mapping. According to the MR imaging signal equation, the exponential R2* decay rate reflecting the static dephasing by the inhomogeneous field plus the thermal random dephasing (R2) is, in general, not well-defined or, at most, is related to iron concentration in a geometry-dependent manner.17 Physics theory and experimental data12 demonstrated that a good linear relationship between R2* and iron concentration may only be expected in regions of uniform iron deposition. On the other hand, the inhomogeneous field estimated from the MR imaging signal is the tissue susceptibility linearly convolving with the dipole kernel.28,35 Deconvolution of the field generates QSM,18⇓–20 which, divided by iron molar susceptibility, is the iron concentration map. Therefore, QSM is more accurate than R2* mapping for measuring iron content.
MR imaging phase has also been used to measure the increased nigral iron content in patients with PD.36 It should be cautioned that in general, the phase depends on iron concentration in a convoluted way according to the Maxwell Equation, the law of magnetism. The phase value at a location reflects not the local tissue susceptibility property but the sum of effects (dipole field contributions) from all magnetic sources surrounding the observation point, resulting in no simple relation between phase in a voxel and its iron content as confirmed experimentally.13
In FDG-PET studies, 100% of patients with clinically moderate PD were identified,37 and 85% of patients with early PD were differentiated from the controls.38 However, PET is limited by its rigid technical requirements and high cost.39 In contrast, MR imaging is relatively noninvasive and does not require the use of radioactive tracers, suggesting that it may be more practical for longitudinal follow-up studies and repeat assessments.40 A previous study reported that the measurement derived from diffusion tensor imaging has been significantly correlated with the number of dopaminergic neurons lost in the substantia nigra in patients with PD.41 The DTI is known to reflect local diffusion characteristics of water molecules, while the MR imaging parameters by QSM or R2* mapping are sensitive to iron deposits. The previous investigators have reported that R2* and fractional anisotropy values of the substantia nigra in patients with PD were not correlated,42 though it is known that iron deposition affects the measurement from DTI.43 Consequently, these MR imaging parameters yield different but complementary information. According to Péran et al,33 a combination of 3 MR imaging parameters (the R2* value, mean diffusivity, and fractional anisotropy) can yield 95% global accuracy (Az value) for discriminating patients with PD from controls. To their observation, we add that the combination of MR imaging parameters, including QSM, whose discrimination power is superior to R2* mapping, discriminates accurately between patients with PD and controls.
Some patients with early-stage PD manifest asymmetric signs and symptoms, while the late stages of PD are characterized by a similar degree of bilateral symptoms. Therefore, we compared the QSM values of both sides (contralateral and ipsilateral to the clinically more affected side). However, our results demonstrated that there was no significant difference between them. Others33 found that the ratio of the smaller-to-larger median values (symmetry ratio) for ROIs in the left and right deep gray matter regions was similar in patients with PD and controls. Their findings coincide with our observation that with respect to discriminating between patients with PD and controls, there was no significant difference between average and maximum values.
In the current study, the QSM and R2* values of all other brain regions measured did not differ significantly between patients with PD and the controls. Regarding the iron levels of the putamen in patients with PD, there seem to be inconsistent results among previous studies. For example, 1 postmortem study found no difference in putamen iron in PD tissue relative to controls,44 which was consistent with the current findings. In contrast, another study that used the R2 parameter (R2*–R2) demonstrated higher levels of iron not only in the substantia nigra but also in the putamen in the PD group relative to the controls45; this discrepancy with the present study may be due to the difference in the severity of the disease (the median Hoehn and Yahr stage: 3 in the previous study, 2 in the current study). In addition, in a previous study, significant variation of R2* was longitudinally observed in the caudal putamen of patients with PD evolving during a 3-year period.46 Therefore, additional longitudinal studies are needed to evaluate the relationship between the iron levels of the putamen and the severity of PD more comprehensively.
Our retrospective study has some limitations. First, this study was limited by a small sample size, which prevented us from exploring potential subgroup analyses such as a correlation between the average phase values of the bilateral substantia nigra and disease severity. Second, in this study, we used the clinical criteria for the diagnosis of PD because of difficulty in obtaining a histopathologic confirmation in patients with PD, which may impair the validity of our analyses, including sensitivity, specificity, and accuracy. Third, many patients had a long disease duration in this study. The detection of minimal nigral lesions is particularly challenging in that clinical signs at the early stage of disease are often subtle or ambiguous. Therefore, prospective studies on a larger number of patients with early-stage PD and unconfirmed PD are underway to determine whether QSM can accurately identify patients with PD. Fourth, the controls in this study were not healthy volunteers. Although they had no history of neurologic or psychiatric diseases, we could not exclude the possibility of existing pathology in the controls. Fifth, the reduced interobserver agreement for the R2* measures probably reflects reduced stability of R2* compared with QSM, affecting the results of the sensitivity, specificity, and accuracy of R2* values and thereby reducing the utility of R2* compared with QSM. Sixth, for the ROI measurements, we analyzed the QSM and R2* mapping separately to compare the diagnostic accuracy between them more precisely. Therefore, the exact same ROIs were not used in this study; this difference could affect the results of the accuracy of QSM and R2* values. Seventh, we did not evaluate DTI scans, which can provide an indirect measure of dopaminergic degeneration within the substantia nigra. Studies comparing DTI and QSM findings may help to identify underlying pathologic conditions in patients with PD. Eighth, in our assessments, we did not subdivide the substantia nigra into the pars compacta and pars reticulata.
Although others47 evaluated the nigral subdivisions in controls on the basis of signal intensity and comparisons with the known anatomy, it is not clear that the nigral subdivisions can be evaluated separately in patients with PD. In our study, we evaluated the substantia nigra as a whole. Last, the FOV of QSM cannot cover the whole brain; it was set to cover the deep gray nuclei structures in this study. Therefore, we could not evaluate other important regions such as the dentate nuclei.
CONCLUSIONS
The sensitivity of QSM is superior to R2* mapping for the detection of pathologic changes in the substantia nigra of patients with PD. QSM can identify the nigrostriatal signature of PD, and its discrimination between patients with PD and controls is highly accurate. Thus, the increased susceptibility due to the higher iron content in the substantia nigra of patients with PD can be quantified more accurately with QSM. Our findings suggest that QSM may be valuable for the diagnosis and assessment of PD.
Footnotes
Disclosures: Tian Liu—UNRELATED: Employment: MedimageMetric; Patents (planned, pending or issued): Cornell University,* Comments: Tian Liu is listed as an inventor of the QSM technology. *Money paid to the institution.
References
- Received August 8, 2014.
- Accepted after revision November 24, 2014.
- © 2015 by American Journal of Neuroradiology


Jump to section
Related Articles
Cited By...
- Magnetic susceptibility is predictive of future clinical severity in Parkinsons disease
- DeepQSM - Using Deep Learning to Solve the Dipole Inversion for MRI Susceptibility Mapping
- Lateral Asymmetry and Spatial Difference of Iron Deposition in the Substantia Nigra of Patients with Parkinson Disease Measured with Quantitative Susceptibility Mapping