
Abstract
BACKGROUND AND PURPOSE: Our aim was to quantitate the range of error in measurement of percent diameter carotid stenosis using conventional angiography in order to estimate the misclassification rate in selecting patients for carotid endarterectomy.
METHODS: A secondary or meta-analysis of published data regarding carotid stenosis measurement error associated with angiography yielded a narrow range of standard deviation across several studies using different measurement protocols. A simulation of the measurement process was developed to model this error and allow estimation of misclassification rates compared with true values for stenosis.
RESULTS: A standard deviation of 8% describes the average error observed at 60% diameter stenosis across a number of studies. Using the measurement model, for a population with 30% prevalence of 60% stenosis, this finding implies a misclassification rate of approximately 4% overall for conventional angiography.
CONCLUSION: Like all diagnostic tests, angiography is associated with measurement error. This does not affect the results of carotid stenosis therapy trials using angiography but does need to be taken into account when evaluating noninvasive alternative tests for carotid stenosis.
Conventional angiography represents the reference standard for selection of patients for carotid endarterectomy, on the basis of its use in multiple efficacy trials comparing medical management and surgical therapy for carotid stenosis (1). Despite this fact, many patients are selected using noninvasive evaluations (2). The underlying assumption favoring angiography before surgery is that the very high accuracy of the invasive procedure offsets the risk of procedure-related stroke, resulting in better outcomes through better patient selection. However, every diagnostic test, including carotid angiography, is subject to variability and thus is associated with some misclassification. The work presented here is a secondary or meta-analysis of published data regarding the repeatability and reproducibility of measurements of percent diameter stenosis on conventional angiograms to establish the base rate of misclassification using angiography.
Methods
Overview
Published measurements of carotid stenosis from carotid angiograms were reanalyzed to obtain a mean value for standard deviation as an index of measurement error. A simulation of carotid stenosis measurement was developed that models the behavior of the published data and allows the comparison of simulated measurements to true values of stenosis. From this, an estimate of the misclassification rate for selection of patients for carotid endarterectomy based on a diameter stenosis of 60% was obtained.
Data Selection
A systematic search for publications related to measurement error of carotid stenosis depicted on conventional angiography was begun with a literature search of the PubMed database for the time period from January 1980 to May 2004. Multiple search criteria were used. From this list, articles were selected that contained data for repeated (either inter- or intraobserver) internal carotid percent diameter stenosis measurements. Reference lists for the resulting articles were examined for additional studies. This process resulted in 18 relevant articles (3–20).
Studies containing tabular or graphical data of repeated measurements to the nearest percentage were identified. Graphical data were digitized, and a dataset was included if greater than 90% of stenosis measurements (excluding occlusions) could be quantified. In one case, a dataset was included because a partial analysis was available in a separate publication (14), even though the graphical source data in the original paper (8) could not be completely resolved. The resulting collection of 4 studies (6, 8, 12, 15) consisting of 8 qualified datasets composes the source of data used in this secondary analysis. Summary data for each of these studies are included in Table 1.
Summary data for the studies included in the secondary analysis
Data Extraction
Data presented in graphical form were digitized (Grab It, Data Trend Software, Raleigh, NC) to obtain coordinate values. Each graph was digitized on 2 separate occasions to ensure repeatability. The standard deviation of these repeated measurements ranged from 0.1%–0.3% diameter stenosis and thus was not considered to be a significant source of error in this analysis. The mean of the 2 measurements was used in the following. The resulting data were next plotted on a transparency and, by overlay, visually compared with the original graphed data to ensure that all visualized data points were included, and as a test of accuracy. For the studies providing data, all stenosis values less than 100% were included. In 2 datasets, (6) this process resulted in 105 values per dataset. Seven (6%) of the 112 data points in each of these 2 graphs were not digitized, likely reflecting symbol overlap that could not be resolved. In 3 datasets (12), 101/105 points (96%) were successfully digitized. In 2 datasets (15), tabulated values were provided.
Data Analysis
Before evaluation, percent diameter stenosis (S) was converted to fractional residual lumen (s) according to the formula s = 1 − (S/100). Statistical analysis was performed using the StatsDirect analysis package (StatsDirect Ltd, Cheshire, UK). Following Bland and Altman (21), for each dataset in which 2 readings are compared, we generated the difference and mean of each paired measurement of s. From these data, plots of difference and absolute difference versus mean were constructed, allowing graphical evaluation of the datasets for bias and dependence of the difference on mean.
In 2 datasets in which 3 observations per subject were performed (15), the subject and sample standard deviation were calculated using one-way analysis of variance for correlated samples with repeated measures. In these cases, the relationship of the standard deviation to the mean was evaluated.
Dependence of standard deviation on mean fractional residual lumen was modeled using regression of the absolute differences against the mean, following a method described by Bland and Altman (21). Assuming a normal distribution with mean zero for the differences, one calculates the standard deviation at any given value of the mean as the fitted value times a factor of (π/2)1/2 to account for the half-normal distribution of the absolute residuals. In one case, partially analyzed data were available in the form of a plot of standard deviation versus mean stenosis for pooled deciles of stenosis (14). These data were further reduced by linear regression to obtain a relationship for standard deviation versus mean. The results of the regression were used to calculate values for standard deviation at s = 0.4 (60% diameter stenosis) for each dataset. A mean value of the standard deviation for the 7 fully analyzed datasets was obtained by combining the (unweighted) variances obtained for each study. The assumption of normality was checked by evaluating normal plots of the standardized residuals from the regression analysis for each case in which raw data were available (22).
This resulted in data regarding standard deviation derived from a total of approximately 3000 readings of percent diameter stenosis on 1250 arteries. European Carotid Surgery Trial (ECST) methods were used for 1136 interobserver comparisons. North American Symptomatic Carotid Endarterectomy Trial (NASCET) style methods were used for 240 interobserver and 105 intraobserver measurements. Common carotid methods were used for 202 interobserver and 101 intraobserver comparisons.
Stenosis Measurement Simulation
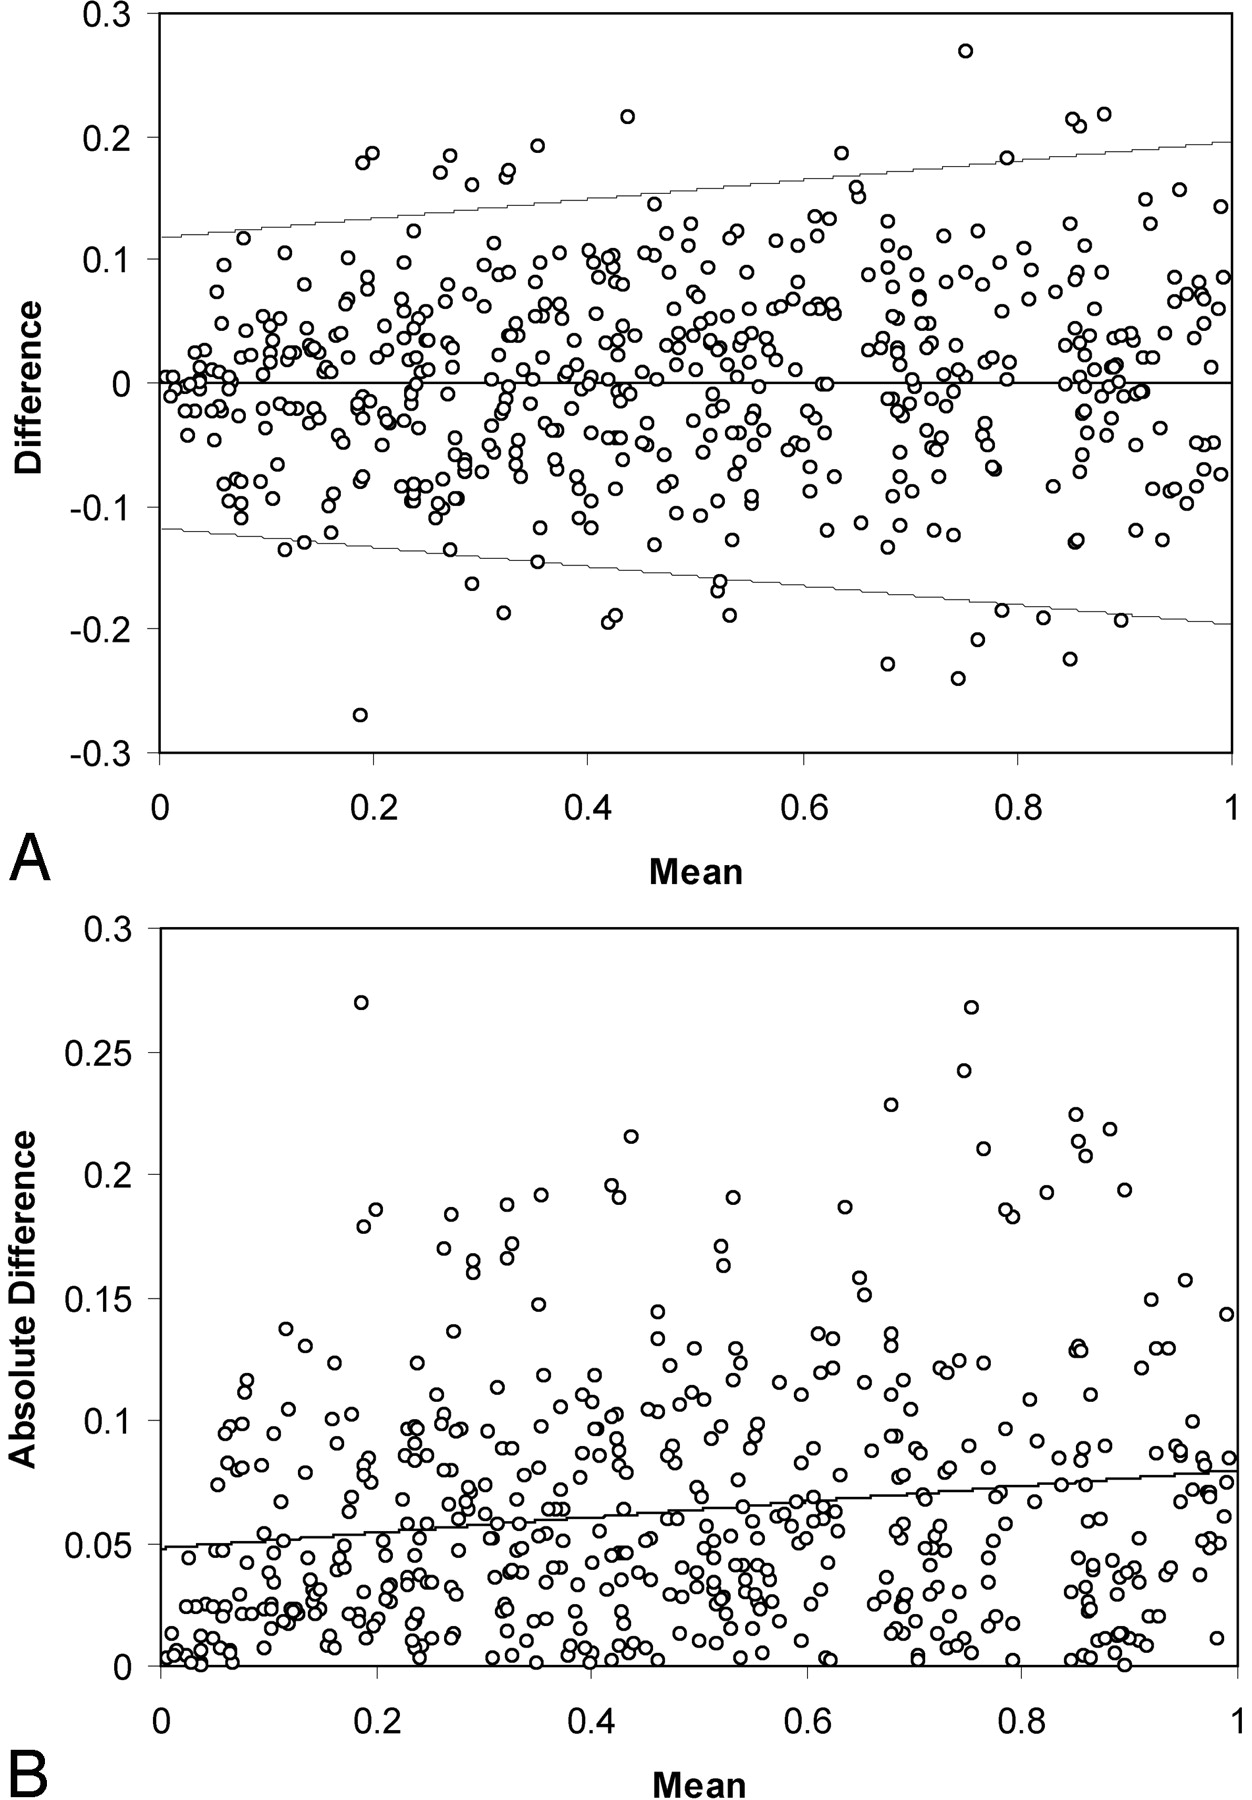
A population of carotid stenoses was generated by producing 3000 random values Ds in a uniform distribution 0 < Ds ≤ 1, using the random number generator in the Excel spreadsheet program (Microsoft Excel 2000, Redmond, WA). Simulated measurements ssim incorporating measurement error were generated as described in Appendix 1, using random values drawn from a lognormal distribution with a specified parameter (the lognormal standard deviation) using the LNORMINV subroutine from the Simtools Excel plug-in (Simtools 3.3 by R.B. Myerson, http://home.uchicago.edu/∼rmyerson/addins.htm). Two sets of measurements were generated for each true value of stenosis. These 2 sets of data were then compared using difference and absolute difference plots (Fig 1). Next, the absolute difference was regressed on the mean, as was done for the secondary analyses of literature data described previously. The standard deviation and associated variance at mean s = 0.4 (60% diameter stenosis) were calculated from this fit. This choice was made on the basis of the observation that 60% diameter stenosis represents an average of the range of clinically most interesting values. Adjusting the value of the lognormal standard deviation used in LNORMINV allowed a population with sample variance equal to the mean value of the variance determined for the published data described previously to be generated after several iterations. These data were analyzed to obtain true-positive and true-negative fractions for cutoff values of s = 0.5, 0.4, and 0.3 corresponding to 50%, 60%, and 70% diameter stenosis. From this, predicted misclassification rates for angiography compared with the true value of stenosis can be calculated. The process was then repeated to obtain simulations for values of the sample variance at the upper and lower bounds of the 95% confidence interval (CI), to estimate the range of most likely values for misclassification.

Graphs show summary of 500 randomly selected measurements from the simulation run. In A, differences between 2 simulated measurements are plotted versus mean value of s, the fractional residual lumen. B displays absolute difference versus mean for the same data. The line in B represents the linear regression fit. Although not strictly valid because the standard deviation is derived from a half-normal distribution, 95% limits of agreement (21) are indicated in A for reference. These plots illustrate the range of error as well as the mild dependence of standard deviation on stenosis grade in the simulation. The standard deviation tends to decrease for higher percentage diameter stenosis.
Results
Summary data for the analysis of the published studies are given in Table 2. The mean value for the standard deviation at 60% stenosis was 0.08 (95% CI, 0.05–0.11). The standard residuals from the regression analysis computed for each of the 7 full datasets were approximately normally distributed for mean values of s not too close to zero, confirming an assumption made in the analysis. There was no significant reader bias, and no significant difference in variance between subgroups consisting of the 3 different measurement protocols, nor between inter- and intraobserver data. The regression parameters for the fully analyzed datasets were generally consistent with a mild dependence of standard deviation on mean, although 2 datasets (15), consisting only of moderate-to-severe stenoses, did not display this dependence.
Summary of slope and intercept parameters derived from linear regression analysis of absolute differences of s, the fractional residual lumen, versus mean from published data
Regression of the absolute differences of the simulation data confirm a dependence of sample standard deviation on mean stenosis, varying linearly by a factor of 1.6 between s = 0 and 1 (Fig 1). With the lognormal standard deviation taken to be 0.05, linear regression of the simulated absolute differences against the mean adequately modeled the published data (Table 2), though the fit to the Rothwell data derived from partially analyzed published information required a larger value for the slope than the other datasets. False-positive and false-negative rates obtained by comparing one of the simulated measurement samples to the true stenosis values are listed in Table 3. From the simulation, at 60% stenosis, 28% of the false-positives and 33% of the false-negatives differed by greater than 5% diameter stenosis from the true value. By assuming a population with 30% prevalence of 60% or greater carotid stenosis, we can use the false-positive and false-negative rates to calculate an overall misclassification rate of 4.5% for a measurement standard deviation of 0.08. The simulation was also used to calculate misclassification rates corresponding to the lower and upper bounds of the 95% CI for the measurement standard deviation; these are found to be 2.6% and 5.1%, respectively.
False-positive and false-negative classification of carotid stenosis derived from the simulation
Discussion
This work examines measurement error of carotid angiography across a variety of studies, with the aim of producing an estimate for misclassification of patients being considered for surgical treatment of carotid stenosis. To accomplish this, one needs the true value of stenosis. In a comparison study, the mean of the measured values is the best estimate of the true value and could be used. Previous studies have compared measurements made by 2 observers rather than comparing one set of measurements with the mean or true value, reporting a range of 3%–26% for clinically important misclassifications at angiography (11, 12, 15). To use data from multiple studies in a standardized way, we used a simulation of the measurement process to generate estimates of misclassification. This approach also sheds light on the measurement process itself and the source of variability in measurement error as a function of stenosis value. The study group is heterogeneous in 2 principal ways: first, 3 methods of determination of stenosis were used; second, both intra- and interreader comparisons were included. The selection of studies for inclusion is also biased by the requirement that greater than 90% of plotted data be identifiable, which tends to exclude larger studies from the sample. Nonetheless, a small interval for measurement error describes the observations drawn from several studies.
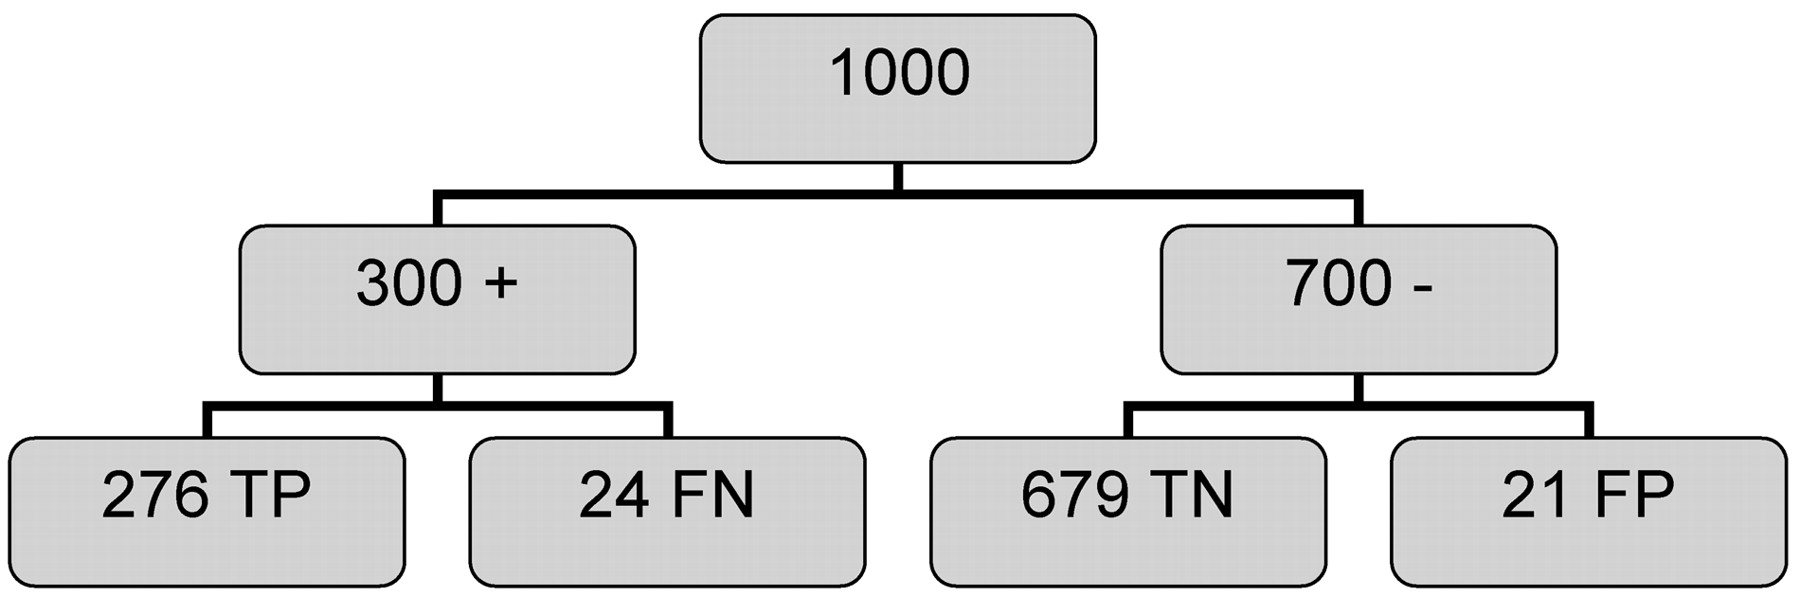
All diagnostic tests are imperfect. Subjective evaluation of carotid stenosis from angiograms has been shown to result in increased rates of misclassification (23). Furthermore, the results obtained in general practice may not equal those achieved in controlled research protocols (23). As has been noted previously (11, 14), unavoidable errors associated with quantitative measurements from angiograms will result in misclassification of patients evaluated for surgical intervention on the basis of angiography. This is illustrated in Fig 2, in which a population of 1000 patients being considered for carotid endarterectomy with a 30% prevalence of 60% or greater diameter carotid stenosis is analyzed using the data in Table 3 derived from the simulation. Of the 300 patients with true stenosis, 24 (8%) are misclassified as nonsurgical, and these patients will consequently receive suboptimal therapy. Of the 700 individuals with less than 60% stenosis, 21 (3%) are incorrectly classified as surgical, using the 60% cutoff. Although some of these individuals with stenosis values near 60% could derive some benefit from surgery, these still represent classification failures. This misclassification does not affect the results of therapy trials using angiography for selection of surgical candidates because benefit was measured against the standard of angiography, although more accurate selection could result in even more robust benefits. The misclassification rate of angiography does have a significant effect on the results of studies evaluating the efficacy of noninvasive methods for determining carotid stenosis.

Analysis of 1000 individuals evaluated for 60% diameter carotid stenosis using carotid angiography, is from data generated using the simulation described in the text. Prevalence is taken to be 30%, and the data from Table 3 are used to estimate outcomes, assuming these data are independent of prevalence. Of the 300 individuals with stenosis, 24 (8%) were false-negative (FN), and of the 700 individuals without stenosis, 21 (3%) were false-positive (FP). The overall misclassification rate is approximately 4%. TP indicates, true-positive; TN, indicates true-negative.
Although a meta-analysis published in 1995 concluded that noninvasive evaluation at that time was not adequate for presurgical evaluation of carotid stenosis (24), the use of noninvasive methods in this application has been and remains controversial (25–30). The cross-sectional noninvasive methods, including MR angiography and CT angiography, are particularly appealing. Among the many potential benefits is the possibility of quantitative evaluation of residual lumen at the point of stenosis, a measurement that can also be made with 3D rotational angiography (20). Note however that even these direct measurements would be subject to some degree of measurement error. There is general agreement that eventually with expected technical improvements, some form of non- or minimally invasive technique will replace carotid angiography. Ultimately, the acceptability of any alternative technique in a given institution will need to be evaluated by comparison with angiography as performed at that particular site. What is currently lacking is a clear statement of what standard a noninvasive evaluation needs to meet to replace angiography. Although misclassification rate is a reasonable standard, most technique comparison studies evaluate misclassification rates for the noninvasive technique compared with angiography and do not take into account the variability associated with the angiographic measurement itself. The result obtained here can be used to form a benchmark for repeatability required before acceptance of an alternative to angiography.
Conclusion
The standard deviation associated with percent diameter stenosis measurement for 60% stenosis at carotid angiography across several published studies using 3 measurement protocols is approximately 8%. This variability necessarily implies the existence of false-positive and false-negative determinations and thus of a certain base rate of misclassification of candidates for carotid endarterectomy. The acceptability of alternative methods for the determination of carotid stenosis should be judged by evaluating associated measurement error and bias compared with this standard.
Appendix 1
Although differing in clinically important ways in detail, for purposes of evaluating measurement error, the methods used for determining percent diameter stenosis of the internal carotid artery from an angiogram using ECST(31, 32), NASCET (33), or common carotid (34) methods are essentially the same. All measure the minimum linear dimension at the level of maximum stenosis (Ds) identified on the available angiographic projections as well as the linear dimension of a vessel at a reference location (Dr). These 2 measurements are used to calculate the fractional residual lumen s = Ds/ Dr, which can then be converted to percent diameter stenosis S = (1 − s) × 100.
Historically, the ECST method has been criticized because of vagueness in the definition of the reference diameter, which is chosen as the extrapolated diameter of the carotid bulb at the level of the stenosis, although studies have confirmed that the reproducibility of this method is comparable with that of the NASCET protocol (8, 9, 35). At very high grades of stenosis, flow reduction can result in a decrease in the size of the distal internal carotid artery and reduce the reference diameter in the NASCET measurement. In the presence of distal narrowing (near occlusion), the NASCET stenosis is arbitrarily assigned a numerical value of 95% (33, 35). This convention has an effect on determination of measurement error because these arbitrarily assigned values are not subject to this form of error.
Percent stenosis obtained by NASCET style measurements is less than (or equal to) the ECST measurement and less than the common carotid value: conversion factors have been published (6, 7, 12, 36, 37). When differences in measurement protocols are corrected for, the surgical benefit is comparable between the major studies, and to avoid confusion, most authorities now recommend the use of the NASCET style measurement for angiography going forward (37, 38). The advent of 3D rotational angiography (20) and noninvasive cross-sectional methods has made possible absolute diameter measurements. This may well be the future of carotid stenosis evaluation; however, these measurements are also subject to measurement error.
To quantitate Ds and Dr, we use a measuring instrument, typically graduated in 0.1 mm increments. The error in a given properly performed measurement will be the result of several factors, such as location and projection chosen for the measurement, various geometric factors such as indistinctness of the margins of the projection image of the vessel, and estimation or round off of the measured value.
To gain insight into the measurement process, we assume that a measurement of fractional residual lumen s is made in an idealized case where Dr = 1. Then 
Here Ds is the exact, but in practice unknown, diameter at the stenosis and can take values between 0 and 1, and δs and δr are errors associated with the measurements at the stenosis and reference location. If we assume that error terms are independent of the size of the associated measurement, are small compared with 1, and are drawn from the same error distribution (δs = δr = δ), then using error propagation methods (39), we determine that the error in the measurement Δs is 
At Ds = 1, this is √2 = 1.4 times larger than at Ds = 0, close to the factor of 1.6 observed in the complete simulation and the average of 1.3 from the published data. Near s = 1 (0% stenosis), the diameter at the stenosis and the reference diameter are about equal, and measurement errors from both measurements contribute equally to the observed difference. As the percent stenosis increases and Ds becomes smaller, the fractional error at the stenosis becomes larger and errors in measurement of the reference diameter become less important (decreasing linearly in the full simulation). Finally, near s = 0 (100% stenosis), the small errors in the measurement of the reference diameter are negligible compared with errors in the measurement of the (very small) diameter at the stenosis Ds. This qualitative relationship has also been noted by Young et al (11). The overall effect of this is that errors in measurement tend to be larger for mild stenosis than for severe (Fig 1).
For Ds substantially larger than the measurement error, the same (approximately normal) error distribution is associated with measurement of either Ds or Dr. This approximation fails for severe stenoses because Ds are nonnegative, and thus the error distribution for very small Ds must be bounded by zero. Errors associated with values of s greater than about 0.1 (<90% diameter stenosis) will be approximately normally distributed. To model these behaviors, we selected the lognormal distribution, which is bounded by zero and approximates a normal distribution for standard deviation small compared with the mean or mode, for the stenosis simulation, with the true value equal to the mode.
Simulation of the measurement process begins by generating a set of random numbers between 0 and 1 to represent a population of true fractional residual lumen values, strue = Ds / Dr. Any desired distribution of values of percent stenosis can be generated, simulating a particular study population with a given prevalence and distribution of stenosis. A measurement is simulated by drawing 2 suitable values from lognormal distributions with modes equal to Ds and Dr (taken equal to 1, which, because we are interested in ratios, represents a scale change). The distribution of size of the error terms is determined by the value of the lognormal standard deviation. This is a free parameter, constant for all error terms, chosen to model the average measurement variance derived from the published datasets.
References
- Received December 2, 2004.
- Accepted after revision March 4, 2005.
- Copyright © American Society of Neuroradiology
In this issue


Jump to section
Related Articles
Cited By...
- No citing articles found.