
Abstract
BACKGROUND AND PURPOSE: Poor treatment outcome remains high in patients with squamous cell carcinoma (SCC) of the head and neck region. Treatment of head and neck cancer could be improved and perhaps standardized if reliable markers for tumor progression and poor prognosis could be developed. MR spectroscopy has been used previously to differentiate between malignant and adjacent normal specimen in these cancers. This study explores the capability of MR spectroscopy in providing an indication of the aggressiveness of a tumor and its response to treatment.
METHODS: Thirty-six SCC patients with treatment failure, and 22 other patients who were treated concurrently at the same center but with no indication of failure for a period of 3 years, were selected for the study. Tumor specimens were kept frozen at −70°C, and later subjected to 1H-MR spectroscopy at 25°C. The resonance areas for 6 spectral regions were determined, and their ratio calculated. The mean values of the ratios were then compared between the 2 groups by using the Student t test.
RESULTS: The choline-to-creatine (3.2/3.0 parts per million [ppm]) and the 1.3/0.9 ppm spectral intensity ratios (signal due to lipid or lactic acid) were the 2 most notable ones to be significantly elevated in the group with poor response. Using these ratios, a sensitivity of 83% and a specificity of 82% were obtained in predicting which head and neck cancer patients would fail treatment.
CONCLUSIONS: These preliminary results suggest that MR spectroscopy has the potential to contribute to an accurate and early prediction of tumor behavior and response to treatment in squamous cell carcinoma of the head and neck region.
About 40,000 cases of head and neck cancers are diagnosed in the United States every year, with approximately 30% of these patients eventually dying of the disease (1). Squamous cell carcinoma (SCC) is the most common malignant histology in the head and neck. Head and neck SCC is treated with a range of modalities that includes surgery, radiation, and chemotherapy, individually or in combination. Despite improvements in treatment modalities, treatment outcome remains poor in these patients. Great differences of opinion remain within the head and neck community regarding optimal treatment selection for an individual patient. Treatment would, ideally, be guided by a reliable, cellular-level prognostic indicator, and the best technique for predicting treatment response would be one that is consistently accurate, nonsubjective, rapid, and economical. Moreover, such a technique should be able to predict response at an early time point (ie, before treatment or immediately after the initiation of treatment).
The methods most widely used in categorizing tumors, and hence guiding treatment, are the TNM (tumor, nodes, metastases) staging system (2) and histopathologic assessment. The TNM staging system is based on clinical and routine imaging findings and frequently fails to identify early nodal spread, a key indicator of aggressive behavior. In using the TNM system for prognostic information, the assumption is that smaller and localized tumors respond better to treatment (3). This, however, is not supported clinically, because tumors of comparable size, localization, and nodal status can respond differently to similar treatments. In head and neck cancers, this classification is more likely to fail the patient with the small volume tumor such as T1 and T2, but less so in the treatment selection for the T3 and T4 cancers (3). Because this system of staging does not address the tumor aggressiveness potential at the cellular level, its value as prognostic marker is limited. Moreover, the determination of the T and N status requires supportive pathology to complete the confirmation. In light of the limitations of the TNM system, the use of tumor volumetry as prognostic factor has also been considered (4). In a study of patients with SCC of the head and neck treated with radiation and concomitant chemotherapy, the pretreatment tumor volume was found to be prognostic with respect to survival (4). Both TNM classification and age were not found to be useful. However, in the case of some sites in the head and neck region, accurate measurements of tumor volume in vivo could be quite challenging.
Tumor DNA content (analyzed by flow cytometry) was found to be a prognostic indicator in SCC of the oral cavity and base of the tongue with aneuploid tumors having worse prognosis than diploid tumors (5). Contradictory results, however, have also been observed by others (6). There is currently a high level of interest in finding molecular biomarkers such as tumor suppressor genes, oncogenes, and microsatellite instability markers for both diagnostic and prognostic purposes in cancer. The mutation of the tumor suppressor gene, p53, is common in squamous cell carcinomas of the head and neck, and its overexpression has been correlated with poor prognosis (7–9); however, there have also been some other studies that did not show any correlation between the 2 (10,11). Histopathology as a method of determining malignancy can be criticized as being subjective and prone to sampling errors (12). Moreover, the association between the degree of differentiation and prognosis has proved to be of little clinical significance (6). A system based on intracellular features is likely to improve the prediction of prognosis.
The lack of a consistent, reproducible, and reliable prognostic marker has prompted us to look for a better tool. It is now accepted that cancer progression is accompanied by intracellular biochemical changes. 1H-MR spectroscopy has the potential to assess biochemical composition and hence identify characteristics that could indicate malignant progression. Work performed on colon, soft tissue sarcoma, prostate, thyroid, ovary, brain, and breast has yielded excellent results in distinguishing between normal/benign and malignant lesions (13–18). In the case of SCC, our laboratory and others have shown that 1H-MR spectroscopy has the potential to differentiate between normal and malignant tissue with a high degree of sensitivity and specificity (19–25). Although MR spectroscopy has been shown in several studies to have some diagnostic value, its prognostic potential has as yet not been fully explored. There is currently an ongoing attempt to use 31-P MR spectroscopy in vivo to predict treatment response in non-Hodgkin’s lymphoma and head and neck cancers (26). The pretreatment levels of phosphomonoesters have been found to correlate with treatment response, with higher levels indicating poor response.
Materials and Methods
Patient Characteristics and Sample Collection
The study was conducted at a single Canadian site (CancerCare Manitoba), where head and neck patients are reviewed by a multidisciplinary panel for the purpose of treatment planning. It can be assumed that treatment technique selection would, to a great extent, follow a consistent pattern based on available evidence. The study was approved by the Research Ethics Board of the National Research Council of Canada and the University of Manitoba Faculty Committee on the use of Human Subjects in Research. After ethics approval and written patient consent were obtained, tissue samples were taken at biopsy or during surgical excision.
Fifty-eight patients who were not previously treated were included in the study during a 3-year period. The average ages of patients were 61.33 ± 1.85 (all), 63.91 ± 2.47 (control), and 59.75 ± 2.56 (failed). The gender breakdown for patients was 39 men and 19 women. The breakdown of all the patients studied according to site is indicated in Table 1. Nine percent of the patients had cancer of the head and neck region with stage T1, 26% with stage T2, 37% with stage T3, and 28% with stage T4. Failed cases were selected on the basis of early recurrence or death from disease within 3 years of initial treatment (n = 36). Subjects who remained disease-free during this period formed the control group (n = 22). A subset of 10 pairs was also established for which we could match the subjects by site. Although the pairing/matching was done mainly on the basis of site, the stage and age of patient were also made to be as close as possible for each pair. Table 2 shows the site, stage, histopathologic information, and mode of treatment for this group of patients.
Prediction of response by MRS in head and neck cancer
Prediction of response by MRS in head and neck cancer
MR Spectroscopy Experiment
A small portion of fresh tumor was obtained from each patient. Each specimen was placed in a vial containing D2O–phosphate-buffered saline solution, immediately frozen in liquid nitrogen, transported to the laboratory, and stored at −70°C. The frozen specimens were later thawed, mounted in small capillary tubes, and subjected to 1H-MR spectroscopy at 25°C with presaturation of the water signal intensity (27). Acquisition parameters included 90° pulse at 8 μs, 256 or 640 scans (depending on the size of the specimen), 5000-Hz spectral width, 2.41-second recycle delay, and 4K time domain data points.
Data Analysis
The resonance areas (intensities) were determined for the following 7 spectral regions by using standard Bruker integration routines. The integration limits (parts per million [ppm]) for these regions were 3.30–3.13, 3.09–2.87, 2.47–2.16, 2.16–1.83, 1.51–1.08, and 1.08–0.60. The ratios of these values for the 2 groups were determined and compared by using the Student t test (P < .05; EXCEL 4.0). A paired t test was performed on the matched groups. Peak area ratios are reported as mean ± SEM.
Results
Comparison of age between control and failed groups did not show any statistically significant difference (P = .25), which indicates that age was not a factor. The number of female patients was 33% of all the cases included in the study, which reflects the current incidence rates of head and neck cancer in the general population (1). A higher percentage of men (44%) than women (36%) had a favorable response to treatment. Table 1 shows all the sites included in the control and failed groups. A number of observations could be made. As can be seen in Table 1, the 3 most-common sites included were larynx, tongue, and floor of mouth. These numbers reflect the prevalence rates found in the general population. Whereas the percentage of failed cases in tongue and the floor of mouth were high (at 83% and 90%, respectively), the opposite was true for larynx, because the percentage of the failed cases was only 28%. In all, 62% of the cases studied ended in failure—death (of cancer) or recurrence in the 3-year period.
Figure 1 shows representative spectra of tumor specimens from 2 cases, one that has shown good response to treatment and another one that has failed. The differences between the spectra suggest that MR spectroscopy–detectable biochemical changes such as the elevation of the choline resonance (at 3.2 ppm) may be predictive of patient prognosis and clinical outcome in SCC of the head and neck region. Although the taurine resonance at 3.4 ppm has not been included in the analysis, its presence at an elevated level may also be associated with poor prognosis, as seen in Fig 1.

360 MHz 1H MR spectra of head and neck tumors (A) control (B) failed case. Both specimens came from oral tongue tumors. Chos, choline-containing compounds; Cr, creatines; Gln, glutamine; Glu, glutamic acid; HOD, deuteriated water; Lac, lactic acid; Leu, leucine; Lip, lipid; Tau, taurine; Val, valine. Assignments do not imply that these are the only substances contributing to a particular peak.
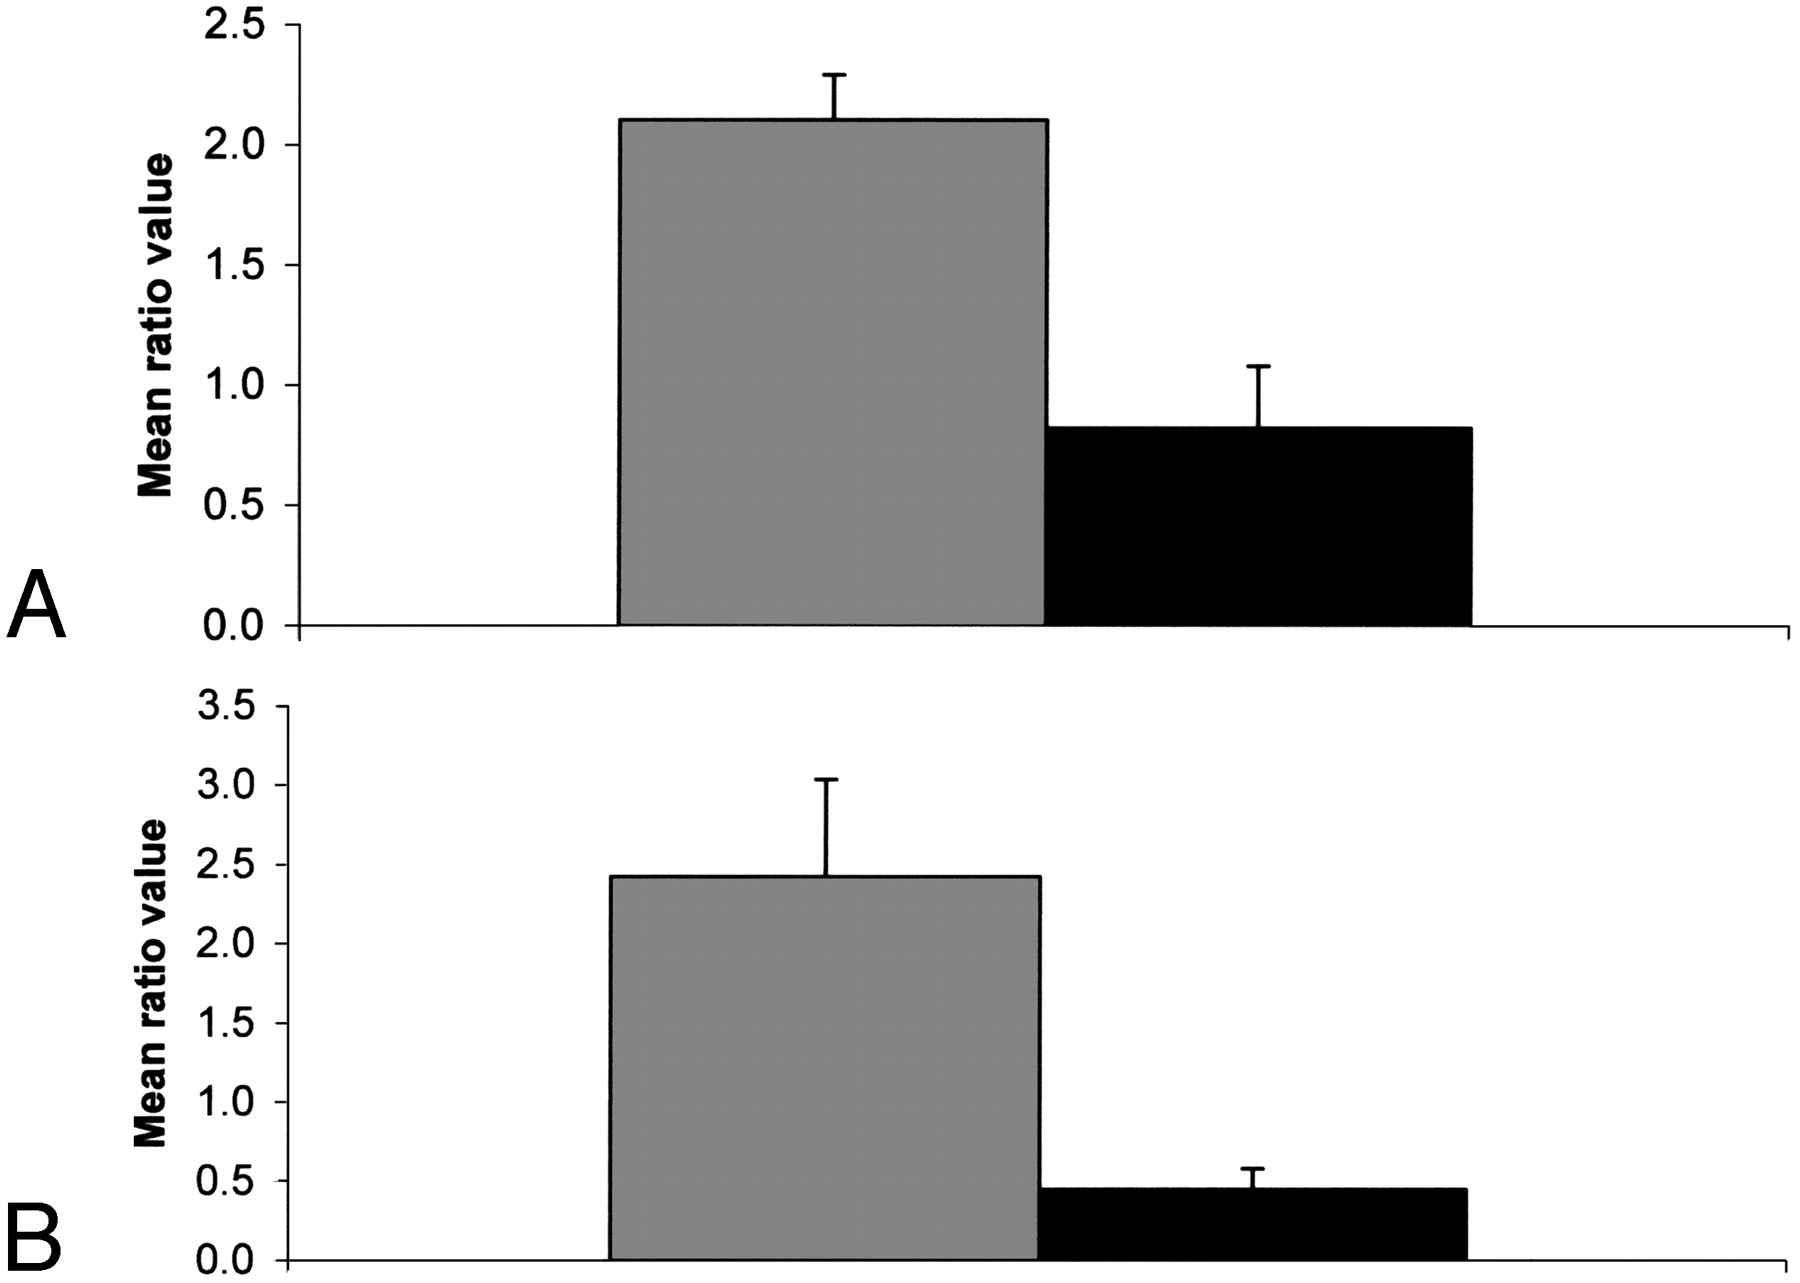
Figure 2 shows bar graphs of the choline-to-creatine metabolic ratios (3.2/3.0) showing statistically significant differences (P ≤ .05). When we looked at all the sites together, this ratio was significantly elevated (P = .027) in the failed cases. We also looked at the 2 major sites separately (ie, tongue and larynx) and found that this ratio is significantly elevated in the tongue but not in the larynx. Similarly, the 1.3/0.9 ratio was significantly elevated in the larynx but not in the tongue. The statistically significant differences observed in the spectral intensity ratios such as 3.2/2.0 and 3.2/0.9 might be primarily due to the changes in the intensity level of the choline peak. Figure 3 shows bar graphs of the 1.3/0.9 ppm ratio showing a statistically significant difference (P ≤ .05). There was no statistically significant difference in this ratio between failed and control cases for tongue. The resonance at 1.3 ppm is primarily due to the methylene (-CH2-) group of the lipid chains and the (-CH3) group of lactic acid. The 0.9 ppm resonance is mainly due to the terminal methyl (-CH3) group of lipid chains. Other statistically significant differences were also seen in the spectral intensity ratios of 2.3/0.9 and 2.3/2.0.

Bar graphs of the 3.2/3.0 spectral intensity ratio (mean ± SEM). Dark shade, control; light shade, failed cases; A, tumors from all sites included; B, tumors of the tongue only.

Bar graphs of the 1.3/0.9 spectral intensity ratio (mean ± SEM). Dark shade, control; light shade, failed cases; A, tumors from all sites included; B, tumors of the larynx only.
Sensitivity and specificity values were assessed for the various spectral ratios that showed statistically significant differences by drawing an optimal line between responders and failures in the scatter plot of the data points. The best sensitivity and specificity values were obtained for the 1.3/0.9 spectral ratio at 83% and 82%, respectively.
For the 10-pair subset of patients who were selected primarily on the basis of matching site, stage, and age, there were also statistically significant differences in some of the spectral ratios. These tumor specimens were all taken from the primary site. Although the 3.2/3.0 ratio was not significant (P = .20), ratios such as 3.2/1.3 (P = .04), 1.3/0.9 (P = .001), and 2.3/0.9 (P = .005) were statistically significant. All of the tongue cases paired in this subset were of oral origin. In the larynx cases, there was one pairing made between a glottic and supraglottic cases. The glottic case happened to be the failed one.
Discussion
There were several statistically significant differences when all the failed cases were compared with all the controls. The most notable spectral-intensity ratios that showed significant differences include the 3.2/3.0 and the 1.3/0.9 ratios. The resonance at 3.2 ppm is due to choline-containing compounds. That can include contributions from phosphocholine, glycerophosphocholine, and phosphatidylcholine. Our results are consistent with the finding of elevated pretreatment phosphomonoester (PME) levels in patients with other cancers such as non-Hodgkin lymphoma that failed to respond to treatment (28). Other similar MR spectroscopy studies have also reported that changes in PME levels predict tumor response (29, 30). Degani et al have shown that levels of PME in normal human mammary epithelial cells were significantly less than the PME levels in transformed human breast cancer cells (31). In addition, levels of choline-containing metabolites have also been shown to correlate with malignant transformation and progression (32) as well as the acquisition of a metastatic potential (33). In our earlier study, we had found a statistically significant correlation between the 3.2/3.0 spectral ratio and the degree of differentiation (34).
Choline levels have also been shown to correlate with tumor recurrence (35–37). Increased choline levels have been found in brain tumors that recurred after radiation therapy (35, 36). Similarly, MR spectroscopy performed on prostate biopsies obtained after radiation therapy has shown that recurring/remaining tumors have elevated choline levels (37). In a study by Mackinnon et al, the choline peak in the 1H-MR spectra from fine-needle aspirate samples was used to distinguish between benign and malignant breast tumors with relatively high sensitivity and specificity (38). Furthermore, the same group also found that tumor vascular invasion and lymph node involvement could be determined accurately from the proton MR spectra (18).
The significantly higher choline-to-creatine ratio found in the spectra of patients with poor prognosis is consistent with the expected high rates of proliferation and membrane biosynthesis in aggressive tumors. These results also suggest a possible decrease in the creatine levels associated with poor prognosis. This is consistent with an increased rate of metabolism (ie, increased energy consumption) in tumors that are highly aggressive.
The elevation of the 1.3/0.9 ppm spectral ratio could be due to both the methylene (-CH2-) resonance of lipids and lactate levels. The intensity of the methylene lipid resonance has been found to be elevated in tumors due to an increase in the mobility of protons in the plasma membrane. The lactate-to-N-acetyl aspartate ratio measured in vivo by 1H-MR spectroscopy in patients with malignant glioma was found to be a strong prognostic factor (39). Similarly, elevated tumor lactate levels have been found to be associated with development of metastasis in head and neck cancer patients (40).
The significance of other ratios containing the 3.2 ppm resonance (eg, 3.2/0.9 ppm) may be mainly due to the contribution of the choline changes. The reason for the statistically significant differences seen in the spectral intensity ratios of 2.3/0.9 ppm and 2.3/2.0 ppm probably has to do with the changes in the intensities of the resonances of glutamine and glutamate. Elevated levels of glutamate have been found in tumors of the stomach, colon, and prostate (13,15,41). Despite the positive trends observed, the lack of statistically significant differences when the specific sites of tongue and larynx were examined separately points to the inadequate sample size. We had only 3 control cases for tongue and just 5 failed cases for larynx. A larger patient cohort with each of the specific sites is needed to make a reliable analysis.
These data should, ideally, be analyzed by the robust and subjective multivariate methods of spectral data analysis, as we have done previously in other studies (15,17,37,42). Such an approach does not depend on intensities or ratios of preselected resonances. Rather, it uses all the information contained in the spectra and identifies the optimal discriminant regions. The sensitivity and specificity values, almost certainly, will be better with such an approach. More specimens and a novel method of analysis, however, would be necessary.
Although our current study was performed ex vivo—and hence there was not much difficulty in water and lipid suppression—these issues could present a formidable challenge in proton spectroscopy in vivo. Motion artifacts caused by respiration and swallowing and magnetic susceptibility problems due to tissue-bone-air interfaces are some of the difficulties one faces in performing such studies on head and neck sites in vivo; however, recent reports have shown that such technical difficulties can be surmounted (20,25,43).
The findings in this pilot study suggest that MR spectroscopy may provide a rapid and simple method for predicting tumor behavior. In light of the relatively small number of patients, we were not able to do a completely matched comparison (by overall stage, site, age, and sex) between the control and failed cases. To do so would require a much larger patient cohort. Even in the small subset of patients where we attempted to make a paired comparison, we only matched the cases by site and only made an effort to keep the age and stage (T stage) as close as possible between the respective pairs. We realize that the overall stage and not just the T stage, should be considered in making such comparisons. In conclusion, these findings are promising but very preliminary. A larger study, preferably a prospective one, with a significant number of patients in a given category (specific site, overall stage, age, and sex) to enable a thorough and more robust comparison should be undertaken. Design of such a study would have to be conducted, as closely as possible, in an environment with a consistent treatment planning approach. Refinement of the method and application in an in vivo setting could give objective indicators for treatment technique selection without adding invasive procedures for the patient. Because MR imaging is commonly used at the present time to stage head and neck cancer patients, the MR spectroscopy part could be easily adopted as an “add-on” to the existing protocols. Such an achievement would ensure that aggressive treatment packages are selected for the more malignant lesions while others might be spared long-term morbidity as a result of possible current overtreatment. Closer follow-up could be instituted for questionable cases. Finally, an accurate prediction system would make treatment choices easier for health care providers and patients.
Acknowledgments
We would like to thank Jenny Billey and Nancy Brown, for their help in follow-up of patients. We are also very grateful to Jay Nayak, for his assistance in editing the manuscript.
Footnotes
This work was presented in part at the meetings of the International Society of Magnetic Resonance in Medicine, 10th Scientific Meeting and Exhibition, Honolulu, HI, May 18–24, 2002, and the Eighth International Congress on Oral Cancer, Rio de Janeiro, Brazil, November 29–December 2, 2002.
References
- Received November 3, 2004.
- Accepted after revision March 4, 2005.
- Copyright © American Society of Neuroradiology


