
Article Figures & Data
Figures
- fig 1.
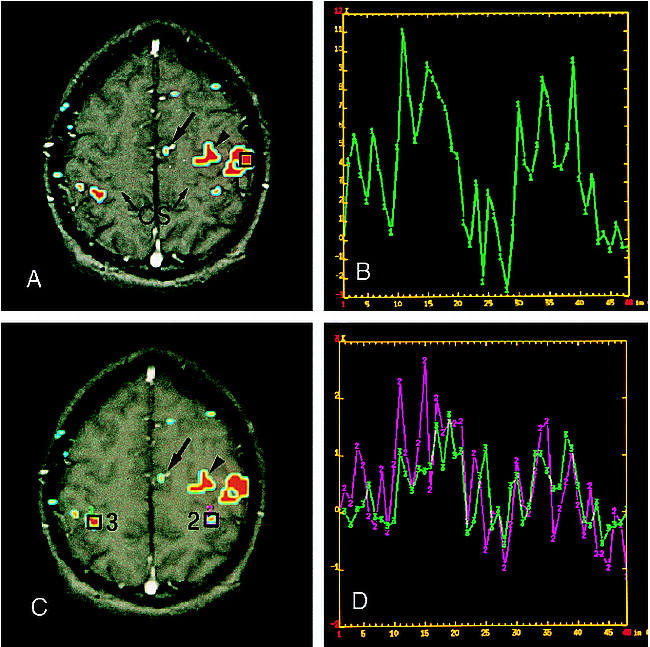
Cortical activation obtained during tactile stimulation of the right hand. Left hemisphere is on the right.
A, Axial image obtained from an SPGR T1-weighted sequence (100/12/1) in which regions activated during tactile stimulation (obtained from a single-shot echo-planar sequence [3000/60/1]) have been superimposed. An ROI was placed on an activated region in the anterior parietal cortex, presumably corresponding to the hand representation of SI (box 1).
B, Graph shows the signal increase in the ROI depicted in A. The x-axis reports the progressive number of images acquired (one image every 3 seconds) and therefore represents a time scale in seconds; the y-axis is a scale on which signal changes are expressed as a percentage of the signal obtained from the brain during the rest periods. Usually, the first value recorded was taken as 0%. In the two 30-second stimulation periods (images 8–18 and 28–38 on the x-axis), the signal increased by about 5% above baseline.
C, Same image as in A. Two ROIs were placed on two activated cortical regions of the posterior parietal cortex, one in the contralateral (box 2) and one in the ipsilateral (box 3) hemisphere.
D, Graphs illustrate the signal increase in the two ROIs shown in C. The signal was lower than in SI (B) and slightly higher in the contralateral (graph 2, purple) than in the ipsilateral (graph 3, green) hemisphere.
Two additional activation foci were apparent in the contralateral hemisphere, one in the medial (A and C, arrows) and the other in the prerolandic (A and C, arrowheads) frontal cortices. CS, central sulcus.
- fig 2.
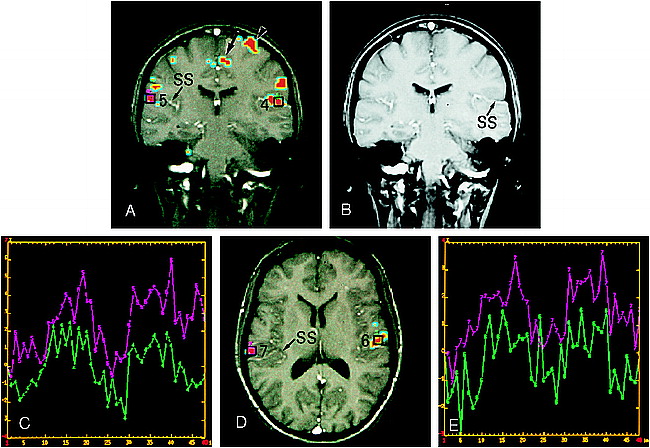
Cortical activation obtained during tactile stimulation of the right hand. Left hemisphere on the right.
A, Coronal image obtained from an SPGR T1-weighted sequence (100/12/1) on which regions activated during tactile stimulation (obtained from a single-shot echo-planar sequence [3000/60/1]) have been superimposed. This image shows activation foci in the parietal operculum of the contralateral (box 4) and ipsilateral (box 5) hemispheres. In each hemisphere the activated region lay in the upper bank of the sylvian sulcus, presumably corresponding to SII.
B, Coronal image (the same shown in A) obtained from an SPGR T1-weighted sequence (100/12/1), without activation foci or ROIs, to show the sylvian sulcus (SS).
C, Graphs show the signal increase in the contralateral (graph 4, green) and ipsilateral (graph 5, purple) activated cortical regions. The x and y axes represent the same scales as described for figure 1. In the two 30-second stimulation periods, the signal exceeded baseline by 2% to 3%.
D, Axial image, obtained from a subsequent acquisition during the same experimental session, shows the activation foci in the parietal operculum, in a region most likely corresponding to SII. ROIs indicated by boxes 6 and 7 are from contralateral and ipsilateral hemispheres, respectively.
E, Graphs 6 (green) and 7 (purple) show the signal changes in corresponding ROIs 6 and 7 selected in D.
- fig 3.
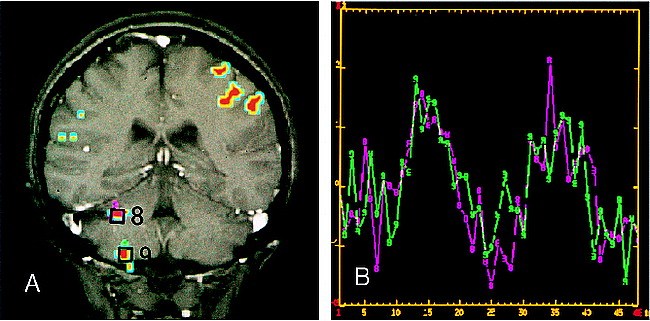
Activation of ipsilateral cerebellar cortex obtained during tactile stimulation of the right hand.
A, Coronal image (SPGR T1-weighted sequence [100/12/1]) shows two activation foci (obtained from a single-shot echo-planar sequence [3000/60/1]) in the ipsilateral cerebellar cortex, on the superior (box 8) and inferior (box 9) surfaces.
B, Graphs 8 (purple) and 9 (green) show the signal changes in the corresponding activated regions of the cerebellar cortex (boxes 8 and 9, respectively). The x and y axes represent the same scales as described for figure 1.


Tables

Subjects studied and activated somatosensory areas


