Advertisement

Main menu

  • Home
  • Content
    • Current Issue
    • Accepted Manuscripts
    • Article Preview
    • Past Issue Archive
    • Video Articles
    • AJNR Case Collection
    • Case of the Week Archive
    • Case of the Month Archive
    • Classic Case Archive
  • Special Collections
    • AJNR Awards
    • Low-Field MRI
    • Alzheimer Disease
    • ASNR Foundation Special Collection
    • Photon-Counting CT
    • View All
  • Multimedia
    • AJNR Podcasts
    • AJNR SCANtastic
    • Trainee Corner
    • MRI Safety Corner
    • Imaging Protocols
  • For Authors
    • Submit a Manuscript
    • Submit a Video Article
    • Submit an eLetter to the Editor/Response
    • Manuscript Submission Guidelines
    • Statistical Tips
    • Fast Publishing of Accepted Manuscripts
    • Graphical Abstract Preparation
    • Imaging Protocol Submission
    • Author Policies
  • About Us
    • About AJNR
    • Editorial Board
    • Editorial Board Alumni
  • More
    • Become a Reviewer/Academy of Reviewers
    • Subscribers
    • Permissions
    • Alerts
    • Feedback
    • Advertisers
    • ASNR Home

User menu

  • Alerts
  • Log in

Search

  • Advanced search
American Journal of Neuroradiology

American Journal of Neuroradiology

ASHNR American Society of Functional Neuroradiology ASHNR American Society of Pediatric Neuroradiology ASSR
  • Alerts
  • Log in

Advanced Search

  • Home
  • Content
    • Current Issue
    • Accepted Manuscripts
    • Article Preview
    • Past Issue Archive
    • Video Articles
    • AJNR Case Collection
    • Case of the Week Archive
    • Case of the Month Archive
    • Classic Case Archive
  • Special Collections
    • AJNR Awards
    • Low-Field MRI
    • Alzheimer Disease
    • ASNR Foundation Special Collection
    • Photon-Counting CT
    • View All
  • Multimedia
    • AJNR Podcasts
    • AJNR SCANtastic
    • Trainee Corner
    • MRI Safety Corner
    • Imaging Protocols
  • For Authors
    • Submit a Manuscript
    • Submit a Video Article
    • Submit an eLetter to the Editor/Response
    • Manuscript Submission Guidelines
    • Statistical Tips
    • Fast Publishing of Accepted Manuscripts
    • Graphical Abstract Preparation
    • Imaging Protocol Submission
    • Author Policies
  • About Us
    • About AJNR
    • Editorial Board
    • Editorial Board Alumni
  • More
    • Become a Reviewer/Academy of Reviewers
    • Subscribers
    • Permissions
    • Alerts
    • Feedback
    • Advertisers
    • ASNR Home
  • Follow AJNR on Twitter
  • Visit AJNR on Facebook
  • Follow AJNR on Instagram
  • Join AJNR on LinkedIn
  • RSS Feeds

AJNR Awards, New Junior Editors, and more. Read the latest AJNR updates

Research ArticleAdult Brain
Open Access

Deep Learning of Time–Signal Intensity Curves from Dynamic Susceptibility Contrast Imaging Enables Tissue Labeling and Prediction of Survival in Glioblastoma

J. Yun, S. Yun, J.E. Park, E.-N. Cheong, S.Y. Park, N. Kim and H.S. Kim
American Journal of Neuroradiology April 2023, DOI: https://doi.org/10.3174/ajnr.A7853
J. Yun
aFrom the Departments of Convergence Medicine (J.Y., N.K.)
bRadiology and Research Institute of Radiology (J.Y., J.E.P., N.K., H.S.K.), Asan Medical Center
  • Find this author on Google Scholar
  • Find this author on PubMed
  • Search for this author on this site
  • ORCID record for J. Yun
S. Yun
dDepartment of Radiology (S.Y.), Busan Paik Hospital, Inje University College of Medicine, Busan, Korea
  • Find this author on Google Scholar
  • Find this author on PubMed
  • Search for this author on this site
  • ORCID record for S. Yun
J.E. Park
bRadiology and Research Institute of Radiology (J.Y., J.E.P., N.K., H.S.K.), Asan Medical Center
  • Find this author on Google Scholar
  • Find this author on PubMed
  • Search for this author on this site
  • ORCID record for J.E. Park
E.-N. Cheong
cMedical Science and Asan Medical Institute of Convergence Science and Technology (E.-N.C.), University of Ulsan College of Medicine, Seoul, Korea
  • Find this author on Google Scholar
  • Find this author on PubMed
  • Search for this author on this site
  • ORCID record for E.-N. Cheong
S.Y. Park
eDepartment of Statistics and Data Science (S.Y.P.), Korea National Open University, Seoul, Korea
  • Find this author on Google Scholar
  • Find this author on PubMed
  • Search for this author on this site
  • ORCID record for S.Y. Park
N. Kim
aFrom the Departments of Convergence Medicine (J.Y., N.K.)
bRadiology and Research Institute of Radiology (J.Y., J.E.P., N.K., H.S.K.), Asan Medical Center
  • Find this author on Google Scholar
  • Find this author on PubMed
  • Search for this author on this site
  • ORCID record for N. Kim
H.S. Kim
bRadiology and Research Institute of Radiology (J.Y., J.E.P., N.K., H.S.K.), Asan Medical Center
  • Find this author on Google Scholar
  • Find this author on PubMed
  • Search for this author on this site
  • ORCID record for H.S. Kim
  • Article
  • Figures & Data
  • Info & Metrics
  • Responses
  • References
  • PDF
Loading

Article Figures & Data

Figures

  • Tables
  • FIG 1.
    • Download figure
    • Open in new tab
    • Download powerpoint
    FIG 1.

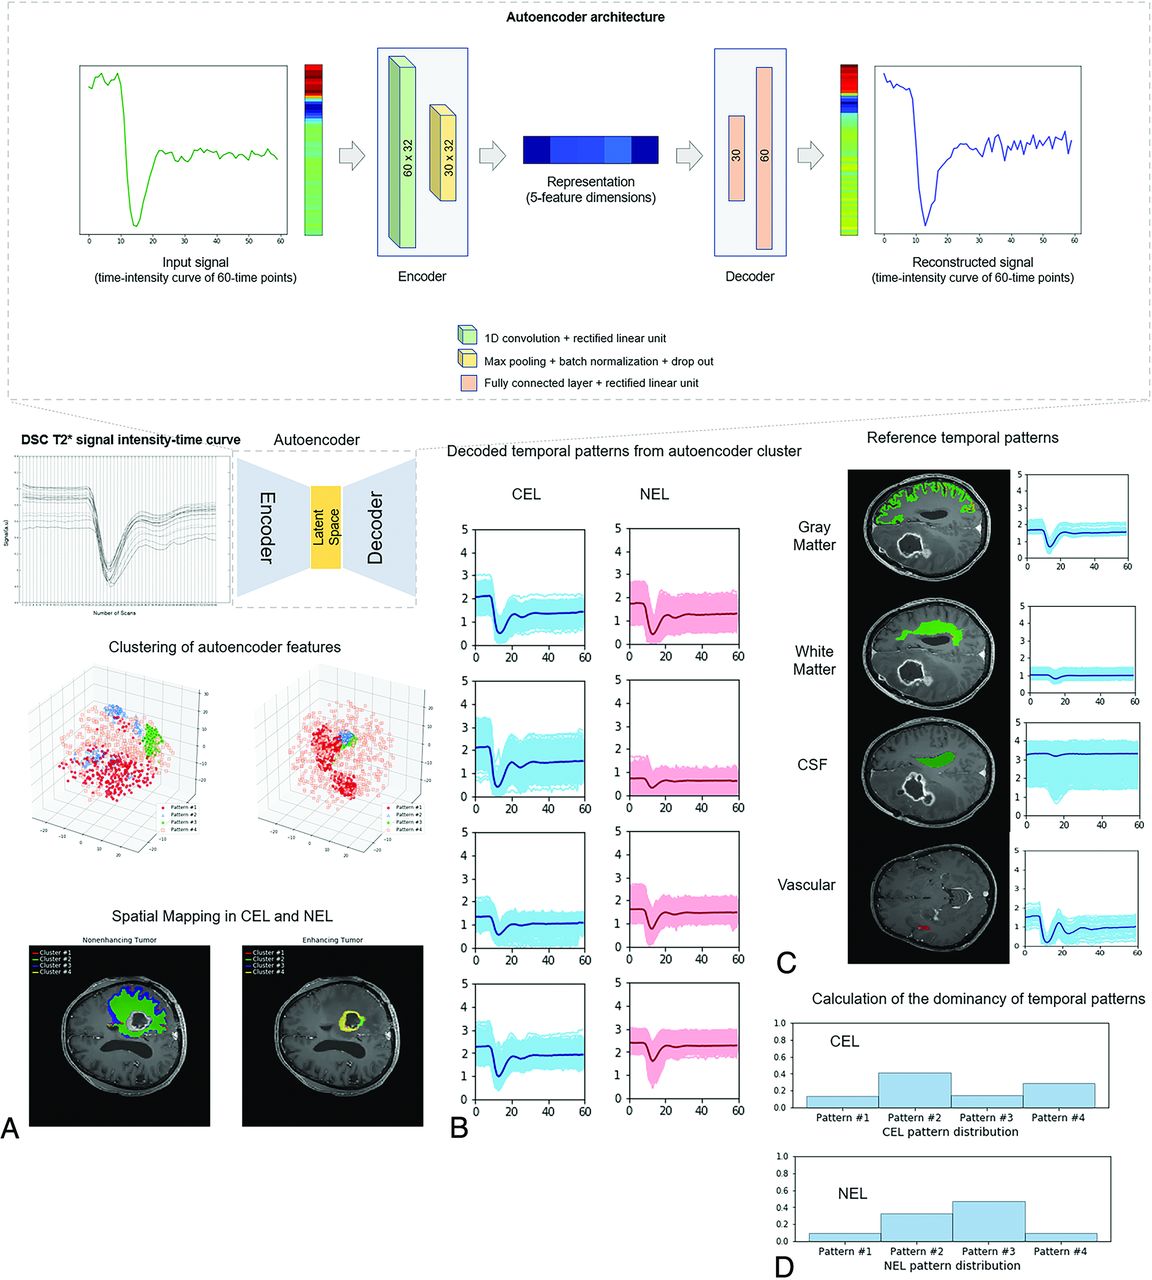
    Summary of the extraction of autoencoder features from DSC imaging. The structure of the autoencoder network showed that the encoder is a 1D convolutional layer, and the decoder consists of 2 fully connected layers of the neural network. The number of latent spaces was set at 5. A, DSC time–signal intensity curves were learned by an autoencoder, and the latent spaces were obtained as autoencoder features. B, The autoencoder features were clustered into 8 patterns representing 4 perfusion patterns in CEL and 4 in NEL. C, Perfusion patterns of reference tissues (gray matter, white matter, CSF, and arteries) were separately obtained. D, The distributions of perfusion patterns within CEL and NEL were calculated. Note that the numbers indicate scale-normalized signal intensities of the time–signal intensity of DSC imaging.

  • FIG 2.
    • Download figure
    • Open in new tab
    • Download powerpoint
    FIG 2.

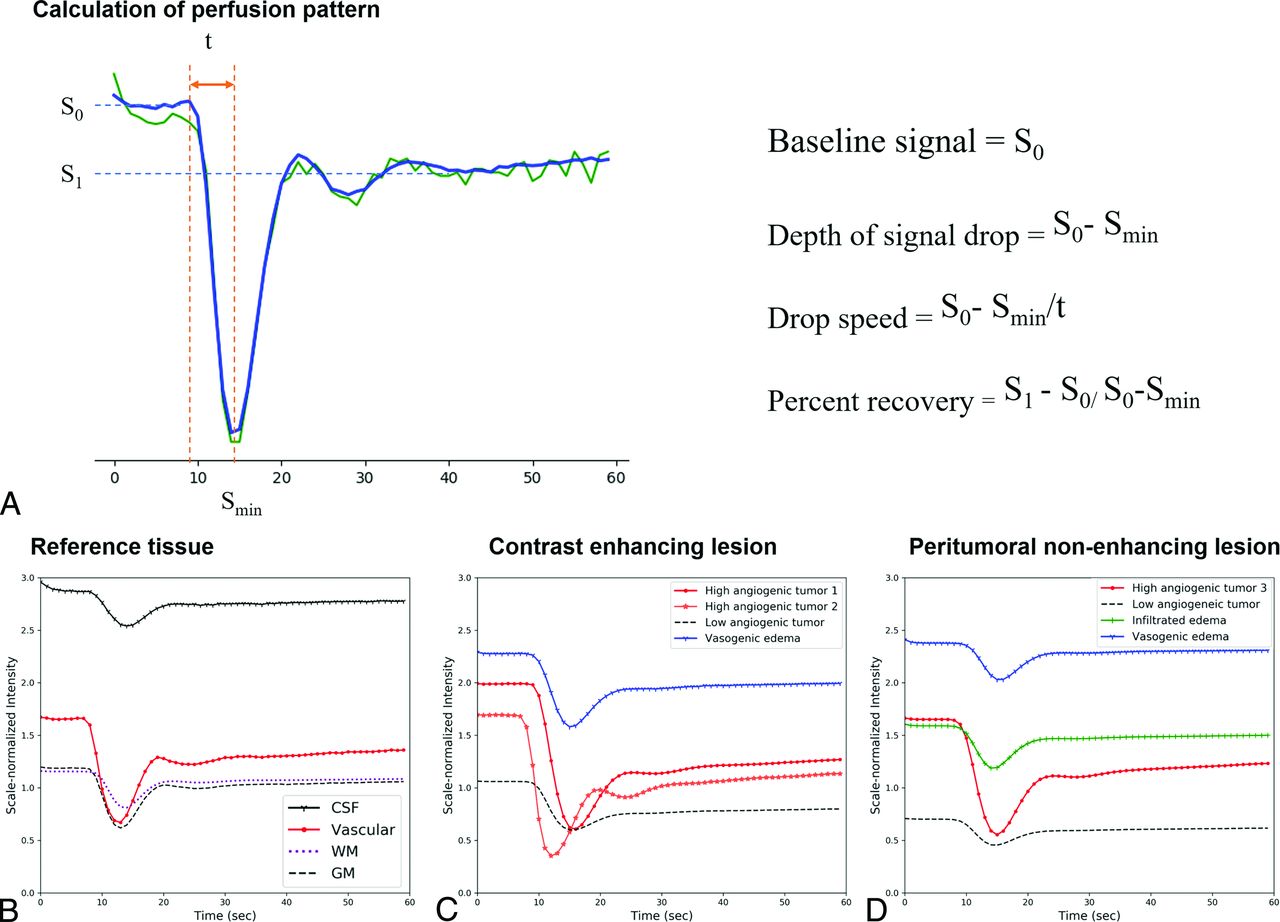
    Calculation of perfusion patterns (A) and representative perfusion patterns (B–D). A, The graph shows signal intensity–time curve elements that can reflect the characteristics of each tissue, such as the baseline signal, minimum signal intensity, and postcontrast signal intensity. On the right side is a summary of the formulas used to calculate each element. Representative perfusion patterns of the reference tissues (B), CEL (C), and NEL (D). B, CSF shows the highest baseline (black line), vascular tissue shows the highest signal drop and drop speed (red line), and normal brain tissue shows the lowest baseline (dotted lines). C, In CELs, perfusion patterns with high signal drop and drop speed are labeled as high angiogenic tumor (red lines), perfusion patterns with the highest baseline and lowest percent recovery are labeled perinecrotic lesion (blue line), and perfusion patterns with the lowest baseline and lowest signal drop are labeled low angiogenic/cellular tumor (black dotted line). D, In NEL, a perfusion pattern with intermediate-to-high baseline and intermediate-to-low signal drop and drop speed is labeled infiltrated edema (green line). A perfusion pattern with the highest baseline and lowest percentage recovery is labeled vasogenic edema (blue line).

  • FIG 3.
    • Download figure
    • Open in new tab
    • Download powerpoint
    FIG 3.

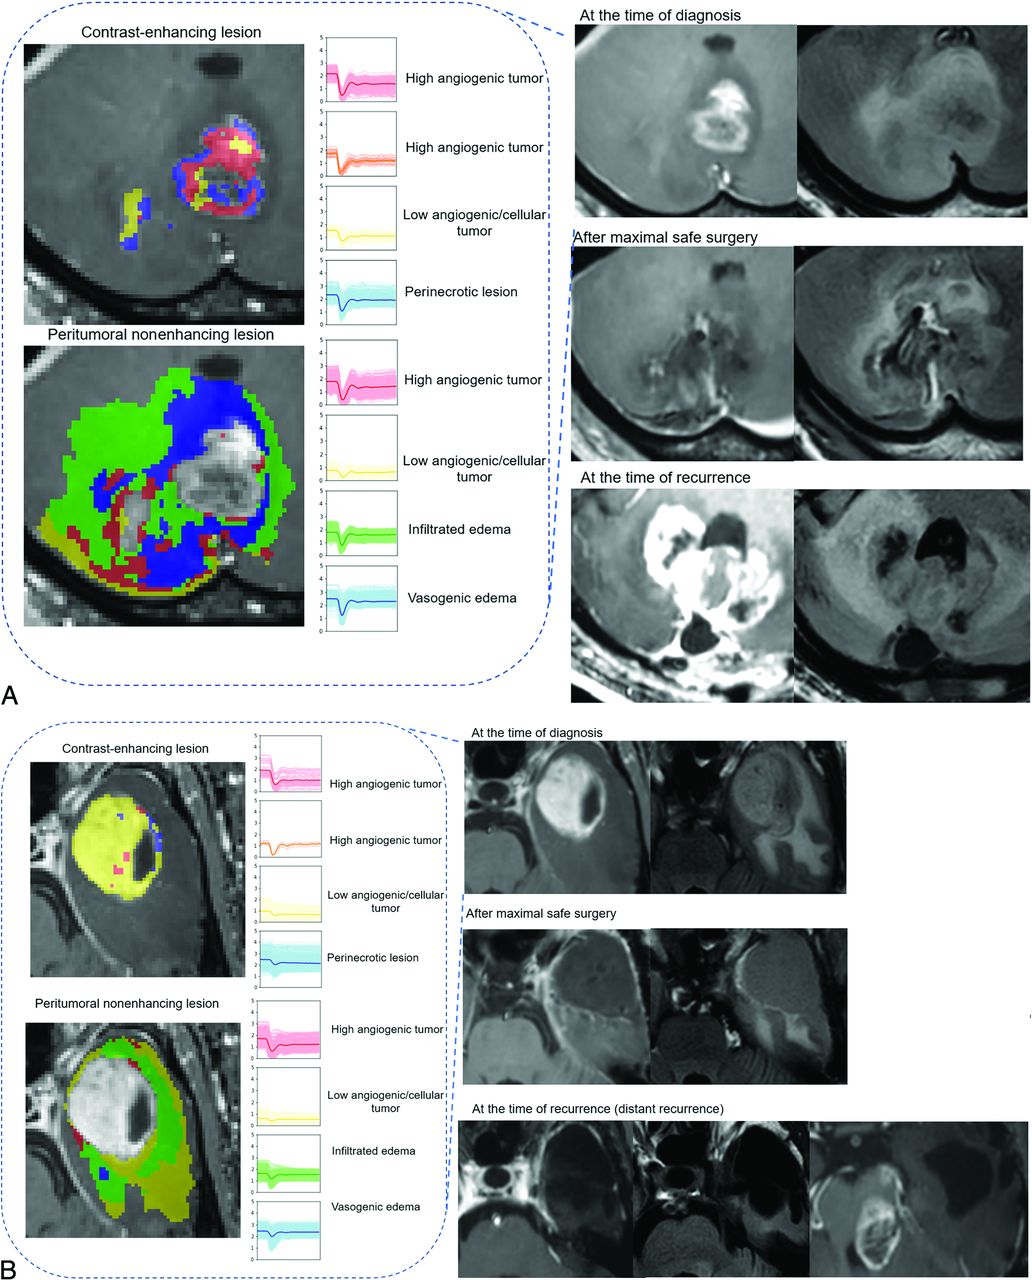
    Prognostic implication of perfusion patterns of NEL in patients with glioblastoma. A, A 62-year-old man with IDH wild-type glioblastoma (EGFR-negative) exhibited high proportions of infiltrated edema in an NEL in the cerebellum. After maximal safe resection of the contrast-enhancing lesion and concurrent chemoradiotherapy, the patient showed progression at 120 days and died 182 days after diagnosis. Note that the recurrence occurred in both the NEL and the original CEL. B, A 59-year-old man with IDH wild-type glioblastoma (EGFR-negative) had high proportions of infiltrative edema within the NEL. After maximal safe resection, the infiltrative edema was mostly resected. After concurrent chemoradiotherapy, the patient showed progression at 1200 days and died 1237 days after diagnosis. Note that the recurrence occurred distant from the primary site.

  • FIG 4.
    • Download figure
    • Open in new tab
    • Download powerpoint
    FIG 4.

    Kaplan-Meier survival curve for overall survival based on infiltrative edema. The optimal cutoff value for distinguishing the low- and high-risk groups was >6017 voxels of infiltrative edema. This cutoff value separated the survival groups with a significant difference according to a log-rank test (P = . 011).

Tables

  • Figures
    • View popup
    Table 1:

    Baseline clinical characteristics of the study population (n = 89)

    Characteristics
    Age (yr)a57.8 (SD, 12.8)
    Sex (male/female)43:46
    EGFR mutation–positive41 (46.1)
    MGMT promoter methylation–positive status30 (33.7)
    KPS at treatment initiation (%)
     >7075 (84.3)
     ≤7014 (15.7)
    Surgical extent (%)
     Gross total resection51 (57.3)
     Partial resection28 (31.5)
     Biopsy10 (11.2)
    Maximal diameter (mm)a44.9 (SD, 15.4)
    Adjuvant treatment (%)
     Standard CCRT+TMZ82 (92.1)
     RT+TMZ11 (12.4)
    OS (months)a17.7 (SD, 11.7)
    • Note:—CCRT indicates concurrent chemoradiation therapy; RT+TMZ, hypofractionated RT for elderly patients with a hypofractionated radiation schedule (40 Gy in 15 fractions for 3 weeks) with TMZ.

    • ↵a Data are expressed as means.

    • View popup
    Table 2:

    Exploratory analysis of perfusion patterns for predicting time-to-progression in patients with glioblastoma

    CEL (No. of voxels)Time-to-Progression
    HRa95% CIP Value
    High angiogenic tumor (1)0.130.01–4.59.25
    High angiogenic tumor (2)4.740.01–231.7.62
    Low angiogenic/cellular tumor0.990.10 –9.91.99
    Perinecrotic lesion22.30.44–111.30.11
    CEL (%)
     High angiogenic tumor (1)0.710.20–2.51.59
     High angiogenic tumor (2)0.650.21–2.04.46
     Low angiogenic/cellular tumor2.140.33–14.03.42
     Perinecrotic lesion2.670.52–13.63.24
    NEL (No. of voxels)
     High angiogenic tumor (3)0.950.29–3.06.93
     Low angiogenic/cellular tumor2.181.01–12.57.047
     Infiltrated edema1.881.35–2.78.009
     Vasogenic edema1.040.71–1.52.84
    NEL
     High angiogenic tumor (3)0.250.21–5.31.37
     Low angiogenic/cellular tumor0.410.08–1.99.27
     Infiltrated edema2.140.40–11.35.37
     Vasogenic edema4.200.52–33.98.18
    • ↵a HRs reported here indicate the relative change in hazard that a 1-U (10,000 voxels for the number of voxels and 1% for percentage) increase in each imaging parameter incurs.

PreviousNext
Back to top
Advertisement
Print
Download PDF
Email Article

Thank you for your interest in spreading the word on American Journal of Neuroradiology.

NOTE: We only request your email address so that the person you are recommending the page to knows that you wanted them to see it, and that it is not junk mail. We do not capture any email address.

Enter multiple addresses on separate lines or separate them with commas.
Deep Learning of Time–Signal Intensity Curves from Dynamic Susceptibility Contrast Imaging Enables Tissue Labeling and Prediction of Survival in Glioblastoma
(Your Name) has sent you a message from American Journal of Neuroradiology
(Your Name) thought you would like to see the American Journal of Neuroradiology web site.
CAPTCHA
This question is for testing whether or not you are a human visitor and to prevent automated spam submissions.
Cite this article
J. Yun, S. Yun, J.E. Park, E.-N. Cheong, S.Y. Park, N. Kim, H.S. Kim
Deep Learning of Time–Signal Intensity Curves from Dynamic Susceptibility Contrast Imaging Enables Tissue Labeling and Prediction of Survival in Glioblastoma
American Journal of Neuroradiology Apr 2023, DOI: 10.3174/ajnr.A7853

Citation Manager Formats

  • BibTeX
  • Bookends
  • EasyBib
  • EndNote (tagged)
  • EndNote 8 (xml)
  • Medlars
  • Mendeley
  • Papers
  • RefWorks Tagged
  • Ref Manager
  • RIS
  • Zotero
0 Responses
Respond to this article
Share
Bookmark this article
Deep Learning of Time–Signal Intensity Curves from Dynamic Susceptibility Contrast Imaging Enables Tissue Labeling and Prediction of Survival in Glioblastoma
J. Yun, S. Yun, J.E. Park, E.-N. Cheong, S.Y. Park, N. Kim, H.S. Kim
American Journal of Neuroradiology Apr 2023, DOI: 10.3174/ajnr.A7853
del.icio.us logo Twitter logo Facebook logo Mendeley logo
  • Tweet Widget
  • Facebook Like
  • Google Plus One
Purchase

Jump to section

  • Article
    • Abstract
    • ABBREVIATIONS:
    • MATERIALS AND METHODS
    • RESULTS
    • DISCUSSION
    • CONCLUSIONS
    • Footnotes
    • References
  • Figures & Data
  • Info & Metrics
  • Responses
  • References
  • PDF

Related Articles

  • No related articles found.
  • PubMed
  • Google Scholar

Cited By...

  • No citing articles found.
  • Crossref (5)
  • Google Scholar

This article has been cited by the following articles in journals that are participating in Crossref Cited-by Linking.

  • Survival prediction of glioblastoma patients using machine learning and deep learning: a systematic review
    Roya Poursaeed, Mohsen Mohammadzadeh, Ali Asghar Safaei
    BMC Cancer 2024 24 1
  • Advances in the Radiological Evaluation of and Theranostics for Glioblastoma
    Grayson W. Hooper, Shehbaz Ansari, Jason M. Johnson, Daniel T. Ginat
    Cancers 2023 15 16
  • ACR Appropriateness Criteria® Brain Tumors
    Jana Ivanidze, Robert Y. Shih, Pallavi S. Utukuri, Amna A. Ajam, Moises Auron, Susan M. Chang, Justin T. Jordan, Aleks Kalnins, Phillip H. Kuo, Luke N. Ledbetter, Jeffrey S. Pannell, Jeffrey M. Pollock, Jason Sheehan, Bruno P. Soares, Karl A. Soderlund, Lily L. Wang, Judah Burns
    Journal of the American College of Radiology 2025 22 5
  • Postoperative Karnofsky performance status prediction in patients with IDH wild-type glioblastoma: A multimodal approach integrating clinical and deep imaging features
    Tomoki Sasagasako, Akihiko Ueda, Yohei Mineharu, Yusuke Mochizuki, Souichiro Doi, Silsu Park, Yukinori Terada, Noritaka Sano, Masahiro Tanji, Yoshiki Arakawa, Yasushi Okuno, Kevin Camphausen
    PLOS ONE 2024 19 11
  • The Evolving Landscape of Radiomics in Gliomas: Insights into Diagnosis, Prognosis, and Research Trends
    Mehek Dedhia, Isabelle M. Germano
    Cancers 2025 17 9

More in this TOC Section

  • Diagnostic Neuroradiology of Monoclonal Antibodies
  • Clinical Outcomes After Chiari I Decompression
  • Segmentation of Brain Metastases with BLAST
Show more Adult Brain

Similar Articles

Advertisement

Indexed Content

  • Current Issue
  • Accepted Manuscripts
  • Article Preview
  • Past Issues
  • Editorials
  • Editor's Choice
  • Fellows' Journal Club
  • Letters to the Editor
  • Video Articles

Cases

  • Case Collection
  • Archive - Case of the Week
  • Archive - Case of the Month
  • Archive - Classic Case

More from AJNR

  • Trainee Corner
  • Imaging Protocols
  • MRI Safety Corner
  • Book Reviews

Multimedia

  • AJNR Podcasts
  • AJNR Scantastics

Resources

  • Turnaround Time
  • Submit a Manuscript
  • Submit a Video Article
  • Submit an eLetter to the Editor/Response
  • Manuscript Submission Guidelines
  • Statistical Tips
  • Fast Publishing of Accepted Manuscripts
  • Graphical Abstract Preparation
  • Imaging Protocol Submission
  • Evidence-Based Medicine Level Guide
  • Publishing Checklists
  • Author Policies
  • Become a Reviewer/Academy of Reviewers
  • News and Updates

About Us

  • About AJNR
  • Editorial Board
  • Editorial Board Alumni
  • Alerts
  • Permissions
  • Not an AJNR Subscriber? Join Now
  • Advertise with Us
  • Librarian Resources
  • Feedback
  • Terms and Conditions
  • AJNR Editorial Board Alumni

American Society of Neuroradiology

  • Not an ASNR Member? Join Now

© 2025 by the American Society of Neuroradiology All rights, including for text and data mining, AI training, and similar technologies, are reserved.
Print ISSN: 0195-6108 Online ISSN: 1936-959X

Powered by HighWire