
Abstract
BACKGROUND AND PURPOSE: An autoencoder can learn representative time–signal intensity patterns to provide tissue heterogeneity measures using dynamic susceptibility contrast MR imaging. The aim of this study was to investigate whether such an autoencoder-based pattern analysis could provide interpretable tissue labeling and prognostic value in isocitrate dehydrogenase (IDH) wild-type glioblastoma.
MATERIALS AND METHODS: Preoperative dynamic susceptibility contrast MR images were obtained from 272 patients with IDH wild-type glioblastoma (training and validation, 183 and 89 patients, respectively). The autoencoder was applied to the dynamic susceptibility contrast MR imaging time–signal intensity curves of tumor and peritumoral areas. Representative perfusion patterns were defined by voxelwise K-means clustering using autoencoder latent features. Perfusion patterns were labeled by comparing parameters with anatomic reference tissues for baseline, signal drop, and percentage recovery. In the validation set (n = 89), a survival model was created from representative patterns and clinical predictors using Cox proportional hazard regression analysis, and its performance was calculated using the Harrell C-index.
RESULTS: Eighty-nine patients were enrolled. Five representative perfusion patterns were used to characterize tissues as high angiogenic tumor, low angiogenic/cellular tumor, perinecrotic lesion, infiltrated edema, and vasogenic edema. Of these, the low angiogenic/cellular tumor (hazard ratio, 2.18; P = .047) and infiltrated edema patterns (hazard ratio, 1.88; P = .009) in peritumoral areas showed significant prognostic value. The combined perfusion patterns and clinical predictors (C-index, 0.72) improved prognostication when added to clinical predictors (C-index, 0.55).
CONCLUSIONS: The autoencoder perfusion pattern analysis enabled tissue characterization of peritumoral areas, providing heterogeneity and dynamic information that may provide useful prognostic information in IDH wild-type glioblastoma.
ABBREVIATIONS:
- CEL
- contrast-enhancing lesion
- EGFR
- epidermal growth factor receptor
- HR
- hazard ratio
- IDH
- isocitrate dehydrogenase
- KPS
- Karnofsky Performance Score
- NEL
- peritumoral nonenhancing lesion
- OS
- overall survival
- rCBV
- relative CBV
- RT
- radiation therapy
- TMZ
- temozolomide
Intratumoral heterogeneity has been identified as a key factor indicating treatment resistance in glioblastoma,1,2 with various microenvironments and their genetic subtypes containing treatment-resistant cell populations that result in disease recurrence. The vascular microenvironment of glioblastoma distinguishes it from lower-grade gliomas,3 and vascular co-option, angiogenesis, and vasculogenesis result in hypoxia, treatment resistance, and a poor prognosis.4 Thus, defining the vascular characteristics of glioblastoma can facilitate elucidation of potential treatment resistance and provide prognostic value in patients with glioblastoma. Recurrence of glioblastoma typically develops around the primary tumor site and may be attributed to the remaining nonenhancing peritumoral area.5 Intratumoral heterogeneity is also important in nonenhancing peritumoral areas that have malignant tumor cells and contain different levels of genetic mutations.6 Therefore, noninvasive demonstration of intratumoral heterogeneity, including vasogenic edema and infiltrative tumor tissue, may provide value for survival prediction.7
Dynamic susceptibility contrast MR imaging (DSC MR imaging) is a noninvasive imaging technique that can provide vascular information.7,8 The most widely used perfusion parameter is the relative cerebral blood volume (rCBV), with high preoperative rCBV values in tumor and peritumoral areas being associated with a poor prognosis in patients with glioblastoma.9⇓-11 However, rCBV imaging provides a 1D (scalar) value that does not allow complete characterization of dynamic perfusion information.12 The original complex dynamic information of DSC-MR imaging time–signal intensity curves may contain hidden information, and autoencoders may provide more robust representations of this information by reconstructing unlabeled input data from the latent representation space.13 We hypothesized that essential information could be extracted using an autoencoder to analyze the entirety of the perfusion signal intensity derived from DSC MR imaging.
An autoencoder is a type of artificial neural network used to learn unlabeled data and efficiently compress data in feature space.14⇓-16 An autoencoder can be used to capture the variance of time–signal intensity curves from DSC imaging,12 and various aspects of the DSC time–signal intensity curves can be captured in the feature space and clustered to provide unique perfusion patterns when translated to the data (imaging) space.
The preoperative characterization of vascular heterogeneity has been studied using vascular habitat analysis of rCBV,10 but direct perfusion pattern analysis of DSC MR imaging time–signal intensity curves has not been previously performed. We hypothesized that an autoencoder-derived time–signal intensity analysis would allow high-dimensionality perfusion pattern analysis of DSC-MR imaging data and provide useful imaging signatures for prognostication. We limited our study to isocitrate dehydrogenase (IDH) wild-type glioma because the IDH-mutant type has a better prognosis, and the term “glioblastoma” was limited to IDH wild-type according to the World Health Organization 2021 classification of CNS tumors. The aim of this study was to investigate whether an autoencoder-based pattern analysis of tumor and peritumoral areas on perfusion MR imaging could provide interpretable tissue labeling and prognostic value in preoperative treatment-naïve IDH wild-type glioblastoma.
MATERIALS AND METHODS
Patients
The study protocol was approved by the institutional review board of Asan Medical Center, and the requirement for informed patient consent was waived because of the retrospective study design (No. 2019–0594). The inclusion process is shown in the Online Supplemental Data. The training data set was part of a cohort used in a previous autoencoder study of brain tumor differentiation.12 The patient eligibility criteria were pathologically confirmed glioblastomas identified from the radiologic database of Asan Medical Center from September 2016 to March 2019; two hundred fifty-three patients were identified. Among them, 70 patients were excluded because 1) either immunohistochemistry for the IDH1 R132H mutation or IDH2 sequencing was not performed when the patients were 55 years of age or younger (n = 23), or 2) they were diagnosed with IDH-mutant gliomas according to the World Health Organization 2021 classification of CNS tumors (n = 47). This process led to 183 patients being included in the training set.
For the network validation set (study population), the same eligibility criteria were used; a total of 113 patients with newly diagnosed (treatment-naïve) IDH wild-type glioblastoma treated at the same tertiary hospital between April 2019 and March 2021 were included. Preoperative structural imaging and DSC imaging were performed. Among them, patients were excluded if they had undergone surgical treatment before MR imaging (n = 15) or if the quality of DSC imaging was inadequate for image analysis because of the presence of artifacts (n = 9). Therefore, the autoencoder was pretrained on a set that included 183 patients (mean age, 58.52 years; 110 [60.1%] men), and the study population included 89 patients (mean age, 57.83 years; 43 [48.3%] men).
Clinical Predictors and Endpoints
The recorded patient characteristics included age at diagnosis, sex, epidermal growth factor receptor (EGFR) mutation status, Karnofsky Performance Score (KPS, ≥80 or <80), maximum tumor diameter, extent of resection (biopsy, partial resection, or gross total resection), and methods of chemoradiation therapy. Standard concurrent chemoradiotherapy17 consisted of fractionated focal radiation therapy (RT) at a dose of 2 Gy per fraction administered once daily 5 days per week for 6 weeks, for a total dose of 60 Gy. Concomitant chemotherapy consisted of temozolomide (TMZ) at a dose of 75 mg/m−2 per day, administered 7 days per week from the first to the last day of RT. After a 4-week break, the patients then received up to 6 cycles of adjuvant TMZ according to the standard 5-day schedule every 4 weeks. RT+TMZ therapy refers to hypofractionated RT for elderly patients with a hypofractionated radiation schedule (40 Gy in 15 fractions for 3 weeks), which has been suggested for elderly patients and found to be equivalent18 to a standard 6-week schedule (60 Gy in 30 fractions for 6 weeks). For the study population, overall survival (OS) was calculated from the day of histopathologic diagnosis until the day of death, as obtained from the national health care data linked to our hospital. Patients who were alive at the time of analysis (n = 33, 35.1% of the validation set) were right-censored and included in the analysis. All patients were followed up every 3–6 months after surgical treatment. The minimum follow-up time to ascertain survival was 1 year.
Imaging Acquisition and Preprocessing
All MR imaging of the enrolled patients was acquired on a 3T scanner (Achieva or Ingenia; Philips Healthcare) equipped with a 32-channel head coil. The imaging acquisition and preprocessing methods are described in the Online Supplemental Data.
Autoencoder Analysis and Perfusion Patterns
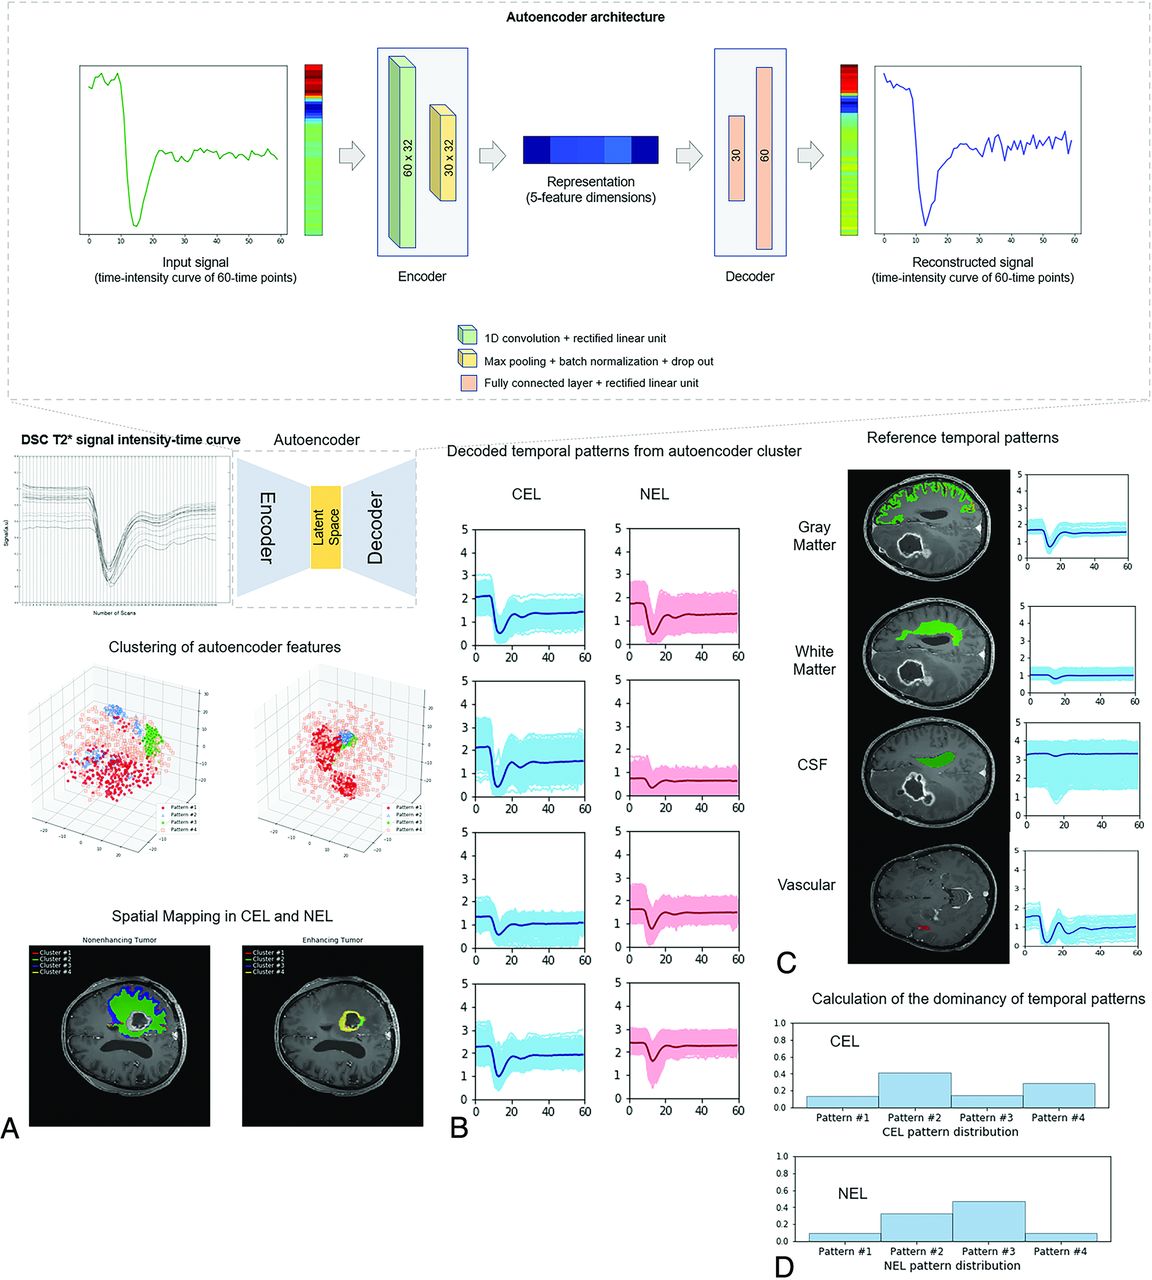
The overall study process is shown in Fig 1. The proposed algorithm consists of 3 main stages: 1) autoencoder analysis and clustering of contrast-enhancing lesions (CELs) and nonenhancing lesions (NELs), 2) creation of perfusion patterns from autoencoder clusters, and 3) characterization of perfusion patterns using reference tissue.

Summary of the extraction of autoencoder features from DSC imaging. The structure of the autoencoder network showed that the encoder is a 1D convolutional layer, and the decoder consists of 2 fully connected layers of the neural network. The number of latent spaces was set at 5. A, DSC time–signal intensity curves were learned by an autoencoder, and the latent spaces were obtained as autoencoder features. B, The autoencoder features were clustered into 8 patterns representing 4 perfusion patterns in CEL and 4 in NEL. C, Perfusion patterns of reference tissues (gray matter, white matter, CSF, and arteries) were separately obtained. D, The distributions of perfusion patterns within CEL and NEL were calculated. Note that the numbers indicate scale-normalized signal intensities of the time–signal intensity of DSC imaging.
Preprocessing and Network Architecture.
For scale normalization, the DSC time–signal intensity curves were rescaled according to the mean value of the white matter of each brain. A total of 3,103,293 time–signal intensity curves were used for the network training set, 587,184 (19%), 2,166,171 (70%), and 349,938 (11%) for CELs, NELs, and necrotic lesions, respectively.
Representations were extracted from high-dimensional DSC time–signal intensity data using an autoencoder that consisted of 2 parts: an encoder and a decoder. Each time–signal intensity curve of 60 timepoints was compressed into 5 feature dimensions using the encoder and then decompressed to a representation of the original curve using the decoder. The encoder had a single 1D convolution block with 32 learnable filters using a kernel size of 2 and was followed by a rectified linear unit, max pooling, and batch normalization. A connection dropout probability of 0.7 was introduced to prevent overfitting. Using 2 fully-connected layers, the decoder reconstructed the representations derived from the encoder into representations of the original 60-time point data. The autoencoder was trained by minimizing the mean squared error between the input and reconstructed signals. An Adam optimizer with a learning rate of 1 × 10⁻⁸ and a batch size of 100,000 was used.
Optimization of Autoencoder Clusters.
K-means clustering was applied to the autoencoder-derived representations of the CELs and NELs. The optimal number of clusters is an important issue in K-means clustering, and silhouette analysis was, therefore, used to define the optimal number.19 The silhouette method calculates how close each point in 1 cluster is to points in neighboring clusters and thus provides a way to assess parameters such as the number of clusters. Silhouette scores have a range of [−1, 1]; a score of zero indicates that the sample is on or very close to the decision boundary between 2 neighboring clusters, while a score near to +1 indicates that the sample is far away from neighboring clusters; a high value indicates that the clustering configuration is appropriate. EGFR mutation status was set as the output value to optimize the number of clusters because it is a binary outcome.12,20 We chose EGFR mutation status as the output value to optimize the number of clusters because it is a binary outcome and because previous literature demonstrated differences in perfusion parameters between EGFR-amplified and nonamplified groups, with a higher mean normalized CBV and higher 95th percentile of normalized CBF following EGFR amplification in IDH wild-type glioblastoma.21
The autoencoder representations in the latent space were clustered and mapped onto the anatomic images for visualization using the optimal number of clusters defined above. The distributions of perfusion patterns were calculated within CELs and NELs.
Tissue Labeling of Perfusion Patterns.
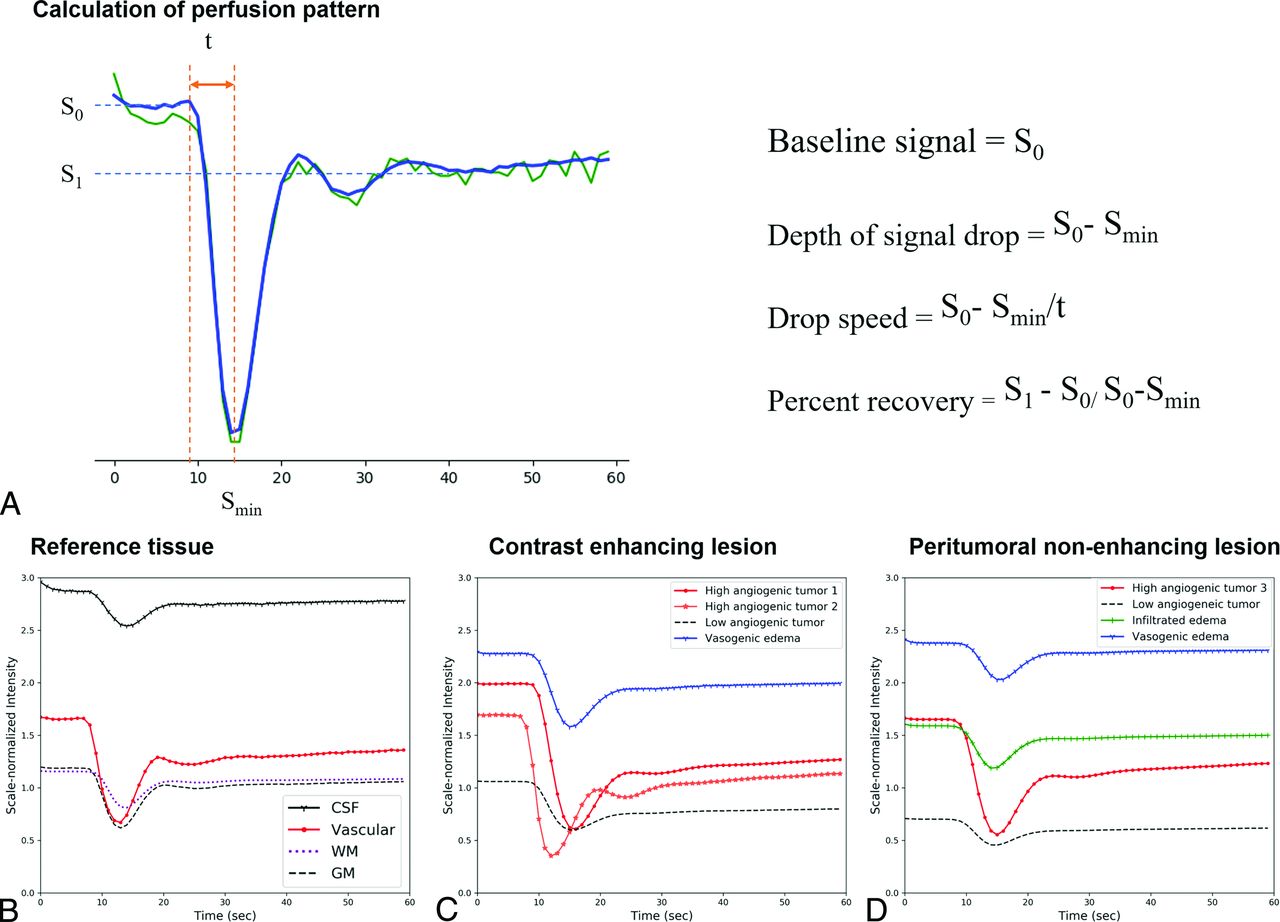
To characterize the perfusion patterns, we calculated the baseline signal, depth of the signal drop, slope of the signal decrease (drop speed), and percentage recovery from each perfusion pattern (Fig 2). The perfusion patterns were first normalized using minimum-maximum scaling before we applied the following processing steps:
The baseline signal (S0) was calculated as the median signal intensity between timepoints 3 and 9.
The depth of the signal drop was calculated as the difference between the baseline signal and the minimum signal intensity (Smin): (S0 − Smin).
The drop speed was calculated as the depth of the signal drop divided by the time (t) for baseline to reach minimum: (S0 − Smin/t). Here, the time (t) was defined as the initial time at which a signal decrease of >5% of the maximum signal decrease was observed across serial timepoints.
The percentage recovery (adopted from previous studies22,23) representing the percentage of signal intensity recovered at the end of the first pass of contrast agent, relative to baseline, was calculated. The postcontrast signal intensity S1 was calculated as the average signal intensity between 30 and 50 timepoints. With S1 as the postcontrast signal intensity, the percentage recovery was described as (S1 − Smin) / (S0 − Smin).

Calculation of perfusion patterns (A) and representative perfusion patterns (B–D). A, The graph shows signal intensity–time curve elements that can reflect the characteristics of each tissue, such as the baseline signal, minimum signal intensity, and postcontrast signal intensity. On the right side is a summary of the formulas used to calculate each element. Representative perfusion patterns of the reference tissues (B), CEL (C), and NEL (D). B, CSF shows the highest baseline (black line), vascular tissue shows the highest signal drop and drop speed (red line), and normal brain tissue shows the lowest baseline (dotted lines). C, In CELs, perfusion patterns with high signal drop and drop speed are labeled as high angiogenic tumor (red lines), perfusion patterns with the highest baseline and lowest percent recovery are labeled perinecrotic lesion (blue line), and perfusion patterns with the lowest baseline and lowest signal drop are labeled low angiogenic/cellular tumor (black dotted line). D, In NEL, a perfusion pattern with intermediate-to-high baseline and intermediate-to-low signal drop and drop speed is labeled infiltrated edema (green line). A perfusion pattern with the highest baseline and lowest percentage recovery is labeled vasogenic edema (blue line).
Reference tissue was defined for arteries, gray matter, white matter, and CSF using probability template matching in SPM12 (http://www.fil.ion.ucl.ac.uk/spm/software/spm12) to label brain regions.24 For arteries, an expert neuroradiologist (J.E.P., with 8 years of neuroradiology experience) carefully selected 2-3 slices and drew an ROI within the MCA ipsilateral to the tumor. For gray matter, white matter, and CSF, the same reader refined the ROIs using brain templates obtained from SPM (SPM12). The mean ROI sizes were 30 voxels for arteries, 1845 voxels for gray matter, 7380 voxels for white matter, and 1528 voxels for CSF (Fig 1).
ADC Calculation for Each Perfusion Pattern.
To support tissue assignment using perfusion parameters, the mean ADC value within each perfusion pattern was extracted. The details of this procedure are provided in the Online Supplemental Data.
According to signal drop, drop speed, baseline, and percentage recovery compared with reference tissues of artery, gray matter, white matter, and CSF, each perfusion pattern within the tumoral ROI was assigned one of the following: high angiogenic tumor, low angiogenic/cellular tumor, perinecrotic lesion, infiltrative edema, or vasogenic edema. The ADC value was also considered. High angiogenic tumor was assigned when a perfusion pattern showed a high signal drop and drop speed, and low angiogenic/cellular tumor, when the perfusion pattern showed a low baseline and signal drop, as well as a low ADC value. Perinecrotic lesion was assigned to a contrast-enhancing lesion when a perfusion pattern showed a high baseline with a low percentage recovery. Infiltrative edema was assigned when a perfusion pattern showed an intermediate-to-high baseline and drop speed. Vasogenic edema was assigned when a perfusion pattern showed a high baseline with a low percentage recovery.
Statistical Analysis
Categoric variables are reported as frequencies and proportions, and continuous variables are reported as means. Differences among categoric variables and differences among continuous variables were assessed using the χ2 test and independent t test, respectively.
The silhouette score was calculated to predict the EGFR mutation status. The proportions of autoencoder clusters (perfusion patterns) were tested for group differences between EGFR-amplified and -nonamplified groups using MANCOVA.
For the ADC values, differences between each perfusion parameter were compared using ANOVA. The ADC values showed normality on an D’Agostino-Pearson test. Correlation coefficients between characteristics of the time–signal intensity curves and ADC were calculated with a Pearson correlation.
For survival analysis, univariate analysis with Cox regression or the Kaplan-Meier method (log-rank test) was performed to analyze associations of perfusion patterns with OS. First, the number of voxels in each pattern was calculated. Second, the percentage of each pattern within the contrast-enhancing lesion (CEL) volume or peritumoral nonenhancing lesion (NEL) volume was calculated (number of voxels in pattern/number of voxels in the CEL volume). Hazard ratios (HRs) reported herein indicate the relative change in hazard that a 1-U (10,000 voxels for the number of voxels and 1% for percentage) increase in each imaging parameter incurred in this study. A univariate Cox proportional hazard regression analysis was also used to test associations between OS and clinical predictors. A model combining statistically significant perfusion patterns and clinical predictors was created, and its prognostic performance was calculated using 10-fold cross-validation, which enables unbiased prediction within the sample.25 Discrimination was measured with the Harrell concordance probability index (C-index).
Statistical analyses were performed using R statistical software (R version 4.0.2; http://www.r-project.org/). A P value < .05 was considered statistically significant.
RESULTS
Patient Demographics
The clinical characteristics of the included patients are summarized in Table 1. The validation set included 89 patients (mean age, 57.8 [SD, 12.8] years; 46 women), most of whom (57.3%) underwent gross total resection. The median OS was 14.4 months.
Baseline clinical characteristics of the study population (n = 89)
Exploratory analysis of perfusion patterns for predicting time-to-progression in patients with glioblastoma
Perfusion Patterns of Reference Tissues
The Online Supplemental Data show the values of the 4 parameters extracted from the DSC time–signal intensity curve and the ADC values of the perfusion patterns of the reference tissue. On the basis of the scale-normalized signal intensity of the DSC imaging (expressing the entire signal intensity between a minimum of 0 and maximum of 5), the perfusion patterns of arteries exhibited the highest signal drop (1.16) and drop speed (0.24). The perfusion patterns of gray matter had higher mean baseline signal (1.18 versus 1.11), signal drop (0.64 versus 0.37), and drop speed (0.14 versus 0.07) but a lower percentage recovery (0.79 versus 0.81) than those of white matter. The perfusion patterns of CSF showed higher baseline (3.04) and lower percentage recovery (0.65) than the other tissue types.
Determination of Autoencoder Clusters and Tissue Labeling
Four clusters were chosen for the CELs and NELs of glioblastomas because this number had the highest silhouette score for the distinction of EGFR mutation status. The Online Supplemental Data demonstrate the results of the K-means clustering and silhouette scores. A MANCOVA was used to compare the proportions of temporal patterns as a group analysis for EGFR; however, there was no significant difference in the distribution of clustering patterns in CELs (P = .446) or NELs (P = .974).
The perfusion patterns of the 4 clusters were then compared with the perfusion patterns of reference tissues (Fig 2 and Online Supplemental Data).
ANOVA showed statistically significant differences (P < .001) among the perfusion patterns in both CELs and NELs. Among these, perinecrotic lesions in CELs had the highest ADC, while low angiogenic/cellular tumor had the lowest ADC.
There was a strong positive correlation between the ADC value and baseline signal intensity in both CELs (r = 0.448, P < .001) and NELs (r = 0.631, P < .001). There was a mild negative correlation between the ADC value and signal drop (r = −0.253, P < .001) and between the ADC value and drop speed (r = −0.256, P < .001) in NELs. These findings correspond well with the angiogenic assignment of the tumors in this study.
In CELs, 2 perfusion patterns had the highest signal drop (1.32 and 0.95) and drop speed (0.23 and 0.21) and were labeled “high angiogenic tumor.” A perfusion pattern with the highest baseline (2.08) and the lowest percent recovery (0.58) was labeled “perinecrotic lesion.” In NELs, a perfusion pattern with the highest signal drop (1.1) and drop speed (0.2) was labeled “high angiogenic tumor.” In NELs, perfusion patterns with the highest baseline (2.25) and the lowest percent recovery (0.78) were labeled “vasogenic edema,” whereas perfusion patterns with the lowest baseline (0.76 in CELs and 0.81 in NELs) and lowest signal drop (0.62 in CELs and 0.51 in NELs) as well as the lowest ADC were labeled “low angiogenic/cellular tumor.” In NELs, a perfusion pattern with intermediate-to-high baseline (1.58) and intermediate-to-low signal drop (0.51) and drop speed (0.10) was labeled “infiltrated edema.”
Exploratory Analysis of Survival Prediction Using Perfusion Patterns
The results of association of perfusion patterns with survival are shown in Table 2. The anonymized data for perfusion parameters including the number of voxels and percentages are in the Online Supplemental Data. In the univariable analysis, no association with OS was found for any of the perfusion patterns in CELs. However, in NELs, low angiogenic/cellular tumors (HR, 3.57; P = .047) and infiltrated edema patterns (HR, 1.79; P = .009) in the peritumoral area showed significant associations with OS. There was no significant association between the percentage of perfusion parameters and OS.
Among clinical predictors, a high KPS score equal to >90 (HR, 0.85; 95% CI, 0.79–0.93; P = . 21) and extent of resection (biopsy or partial resection compared with gross total resection, HR, 2.12–2.43; 95% CI, 1.01–5.04; largest P value = .04) were significantly associated with OS (Online Supplemental Data). There was no association between the ADC (either the ADC in CELs or NELs) and OS (Online Supplemental Data).
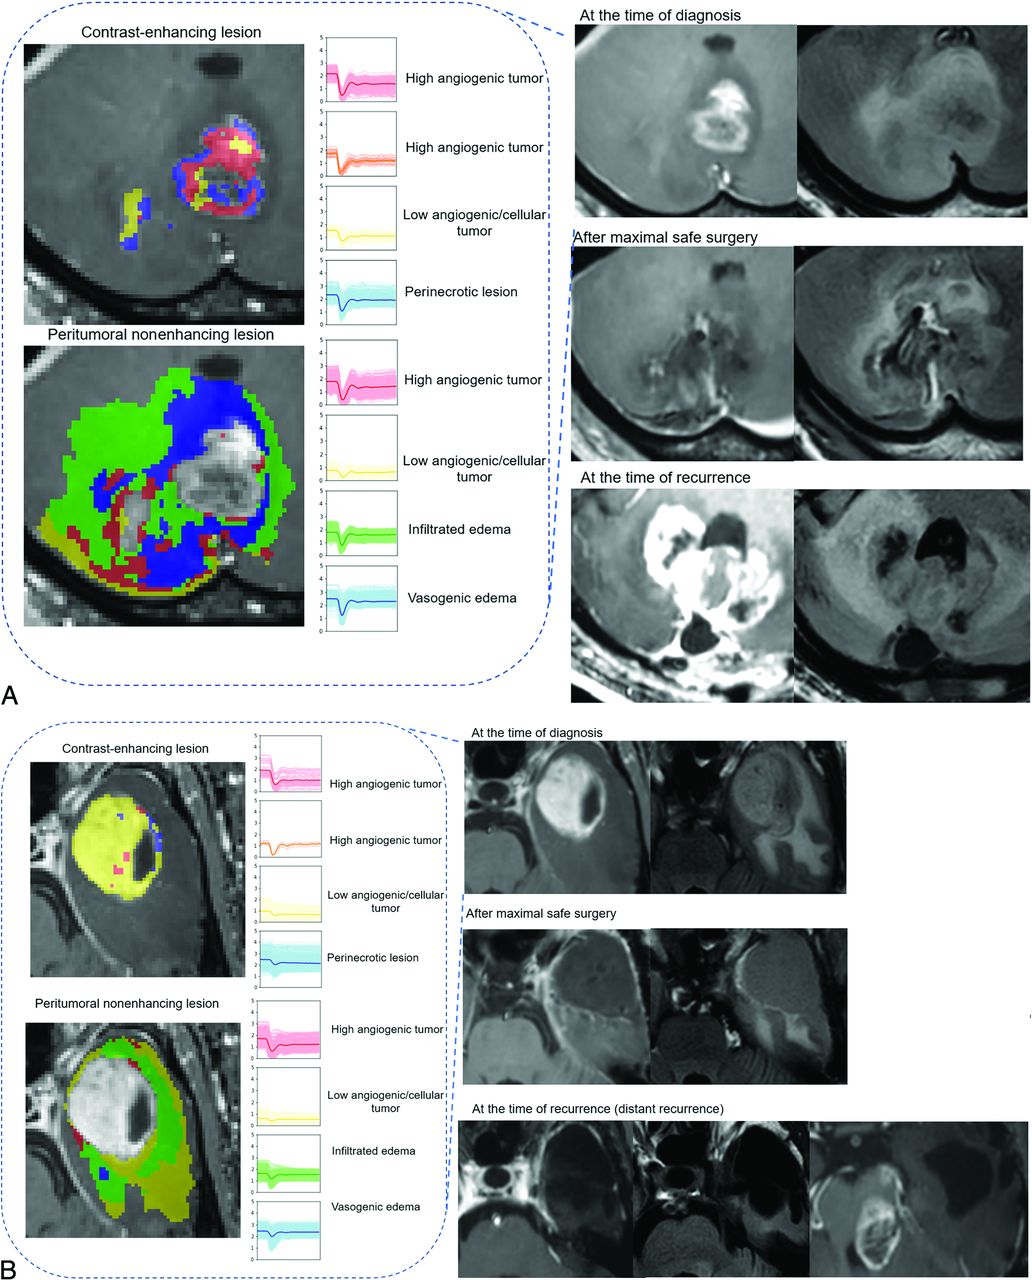
The C-index for NEL perfusion patterns alone was 0.57 (95% CI, 0.55–0.60), while that for NEL perfusion patterns combined with clinical predictors (extent of resection and age) was 0.72 (95% CI, 0.70–0.74). Representative cases are shown in Fig 3 and the Online Supplemental Data. Patients with tumors showing a high proportion of infiltrative edema and low angiogenesis died earlier than those with tumors with a low proportion of infiltrative edema and low angiogenesis but similar conditions of tumor resection.

Prognostic implication of perfusion patterns of NEL in patients with glioblastoma. A, A 62-year-old man with IDH wild-type glioblastoma (EGFR-negative) exhibited high proportions of infiltrated edema in an NEL in the cerebellum. After maximal safe resection of the contrast-enhancing lesion and concurrent chemoradiotherapy, the patient showed progression at 120 days and died 182 days after diagnosis. Note that the recurrence occurred in both the NEL and the original CEL. B, A 59-year-old man with IDH wild-type glioblastoma (EGFR-negative) had high proportions of infiltrative edema within the NEL. After maximal safe resection, the infiltrative edema was mostly resected. After concurrent chemoradiotherapy, the patient showed progression at 1200 days and died 1237 days after diagnosis. Note that the recurrence occurred distant from the primary site.
The Kaplan-Meier survival curve for OS based on the presence of infiltrative edema is shown in Fig 4. The optimal cutoff value for distinguishing the low- and high-risk groups was >6017 voxels showing infiltrative edema. A log-rank test showed a significant difference between the low- and high-risk groups (P = .011).

Kaplan-Meier survival curve for overall survival based on infiltrative edema. The optimal cutoff value for distinguishing the low- and high-risk groups was >6017 voxels of infiltrative edema. This cutoff value separated the survival groups with a significant difference according to a log-rank test (P = . 011).
DISCUSSION
In this study, we investigated whether an autoencoder trained to analyze perfusion patterns extracted from DSC imaging could depict perfusion heterogeneity and whether it had prognostic value in patients with IDH wild-type glioblastoma. Using perfusion patterns based on unsupervised learning by the autoencoder and K-means clustering, we performed tissue labeling by comparison with the perfusion patterns obtained from reference tissues of the MCA, gray matter, white matter, and CSF. Our results demonstrate that the preoperative perfusion patterns, especially those from the peritumoral nonenhancing region, contained prognostic information. A high proportion of infiltrative edema and low angiogenic/cellular tumor in the peritumoral nonenhancing region, old age, and a low extent of surgery indicated poor patient survival. Thus, along with a maximal safe resection strategy according to the current guidelines for patients with glioblastoma, the depiction of preoperative perfusion patterns and localization of infiltrative and low angiogenic/cellular tumor portions could be helpful for providing important early information on survival.
The nonenhancing regions of glioblastoma consist of areas of edema and infiltrative tumor tissue that usually remain after surgical resection, and most recurrences occur within the original treatment field.26⇓⇓-29 Several studies have investigated perfusion MR imaging findings in the nonenhancing peritumoral area as potential prognostic factors.5,11,30 Jain et al11 revealed that rCBV measurements of the nonenhancing region of glioblastoma provide unique prognostic information independent of morphologic, genomic, and clinical features. Lee et al30 investigated tumor-derived texture feature ratios extracted from contrast-enhancing and nonenhancing lesions on perfusion MR imaging–based CBV maps. A recent voxelwise rCBV and CBF analysis showed that vascular habitats had prognostic value in patients with glioblastoma.10 Nevertheless, rCBV analysis does not allow depiction of the complex nature of DSC time–signal intensity curves, such as drop speed and percentage recovery, and vascular habitat is derived from a unidirectional high or low pattern of vascular density. For example, rCBV does not reflect the permeability of tumor vessels, which can be determined using parameters such as the percentage recovery calculated from DSC MR imaging.31
However, recent machine learning and deep learning studies have revealed possibilities for analyzing the high-dimensional data of the time–signal intensity curves obtained from DSC images.12,20,31,32 Akbari et al20 characterized perfusion characteristics with a support vector machine classifier to create a map of heterogeneity within the peritumoral region. Bakas et al32 constructed a quantitative within-patient peritumoral heterogeneity index for evaluating EGFR status using contrasting perfusion patterns of immediate and distant peritumoral edema. A recent study used a long short-term memory–based model to predict IDH genotypes on DSC MR imaging of gliomas.31 These studies have revealed that DSC MR imaging contains more voxelwise information than is represented by a simple rCBV map. Our study is in accordance with the above-mentioned studies, in that we found that analysis of the entire DSC time–signal intensity curve with a deep learning technique using an autoencoder made it possible to compress voxelwise data while extracting essential information.12,13
The interpretation of high-dimensional information from unsupervised learning is challenging. The tissue interpretation performed in this study differs from that in previous work in 2 ways: First, the perfusion patterns were labeled according to similarities with reference tissues of the ipsilateral MCA, contralateral normal-appearing gray/white matter, and CSF. For the reference tissues, we applied robust tissue segmentation using established software and included a large number of voxels, differing from a previous study that included 2–3 voxels of reference tissue.20 Second, the perfusion patterns used entire tumoral and peritumoral voxels, labeling them as high angiogenic tumor, perinecrotic lesion, low angiogenic/cellular tumor, infiltrative edema, or vasogenic edema by considering their perfusion parameters, including baseline signal, signal drop, drop speed, and percentage recovery.
Previous unsupervised learning studies used a heterogeneity index,20,32 but this is an oversimplified measure and limits biologic interpretation. In addition, infiltrated edema was limited to a 2-cm margin around the enhancing tumor,10 whereas we were able to identify infiltrated edema from all peritumoral voxels. This finding highlights a strength of our study, in that we first applied tissue labeling using the perfusion patterns of the entire tumoral and peritumoral voxels, enhancing the interpretability of unsupervised learning including clustering and autoencoder analysis. In this study, edema was assigned using a higher baseline value than white matter in NELs. Furthermore, assignment of angiogenic tumors was possible using high signal drop and drop speed compared with gray and white matter. We believe that this method will help researchers to identify the perfusion pattern of tumor in comparison with reference tissues.
Moreover, the ADC value was adjunctly used to explain the tissue labeling, which enhances the biologic explanation of the perfusion patterns by combining both cellularity and characteristics of time–signal intensity curve analyses including baseline, signal drop, and percentage recovery. In particular, percentage recovery is known to be helpful for characterizing permeability, with high permeability leading to low percentage recovery22,23 because of the high T1 effect of gadolinium-based contrast leakage into interstitial spaces.
In CELs, there were 2 each of high angiogenic tumors, low angiogenic/cellular tumors, and perinecrotic lesions. This finding was also supported by ADC analysis, which showed that perinecrotic lesions exhibited a high ADC, while low angiogenic/cellular tumor exhibited a low ADC. On histopathology, the tumorigenic “perinecrotic niche” is known to have quiescent stemlike tumor cells in glioblastoma33 and is distinct from other tissue types. High angiogenic tumors exhibited the highest signal drop (1.32 and 0.95) and drop speed (0.23 and 0.21), demonstrating neoangiogenesis within the tumor because high signal drop and drop speed are correlated with a high rCBV.34 It is unclear why 2 distinct high angiogenic perfusion patterns were obtained, and future studies with further molecular subgroups may reveal the meaning of this difference.
There are several limitations to this study. First, it used a retrospective design and had a small cohort size; these factors limit the generalizability and statistical power of our findings. Second, despite the use of an optimized number of clusters identified by silhouette analysis, MANCOVA showed no significant difference in the distribution of clustering patterns between CELs and NELs. In a previous study, a higher mean nCBV and higher 95th percentile of nCBF were significant predictors of EGFR amplification in IDH wild-type glioblastoma.21 Therefore, we expected that the perfusion MR imaging values would change according to the EGFR amplification results, but our results showed no difference. MANCOVA is extremely sensitive to outliers, which may produce either type I or type II error.35 It is, therefore, necessary to perform further research with more clusters or optimized clusters of perfusion patterns.
CONCLUSIONS
Autoencoder-derived perfusion patterns could be labeled with different brain tissues on the basis of the interpretation of perfusion patterns of reference tissues. The perfusion patterns could be useful biomarkers for prognostication, especially low angiogenic/cellular tumor and infiltrative edema perfusion patterns in nonenhancing peritumoral areas. Autoencoder analysis enabled capture of infiltrative tumorlike perfusion patterns in the brain, and this study demonstrated the feasibility of voxelwise temporal information as a prognostic indicator in patients with IDH wild-type glioblastoma.
Footnotes
J. Yun and S. Yun contributed equally.
This research was supported by the Ministry of Health and Welfare, South Korea (HI21C1161 and HI22C0471).
Disclosure forms provided by the authors are available with the full text and PDF of this article at www.ajnr.org.
Indicates open access to non-subscribers at www.ajnr.org
References
- Received June 29, 2022.
- Accepted after revision March 21, 2023.
- © 2023 by American Journal of Neuroradiology


Jump to section
Related Articles
Cited By...
- No citing articles found.