
Abstract
BACKGROUND AND PURPOSE: Progressive MS is typically heralded by a myelopathic pattern of asymmetric progressive motor weakness. Focal individual “critical” demyelinating spinal cord lesions anatomically associated with progressive motor impairment may be a compelling explanation for this clinical presentation as described in progressive solitary sclerosis (single CNS demyelinating lesion), progressive demyelination with highly restricted MR imaging lesion burden (2–5 total CNS demyelinating lesions; progressive paucisclerotic MS), and progressive, exclusively unilateral hemi- or monoparetic MS (>5 CNS demyelinating progressive unilateral hemi- or monoparetic MS [PUHMS] lesions). Critical demyelinating lesions appear strikingly similar across these cohorts, and we describe their specific spinal cord MR imaging characteristics.
MATERIALS AND METHODS: We performed a retrospective, observational MR imaging study comparing spinal cord critical demyelinating lesions anatomically associated with progressive motor impairment with any additional “noncritical” (not anatomically associated with progressive motor impairment) spinal cord demyelinating lesions. All spinal cord MR images (302 cervical and 91 thoracic) were reviewed by an experienced neuroradiologist with final radiologic assessment on the most recent MR imaging. Anatomic association with clinical progressive motor impairment was confirmed independently by MS subspecialists.
RESULTS: Ninety-one individuals (PUHMS, 37 [41%], progressive paucisclerosis 35 [38%], progressive solitary sclerosis 19 [21%]) with 91 critical and 98 noncritical spinal cord MR imaging demyelinating lesions were evaluated. MR imaging characteristics that favored critical spinal cord demyelinating lesions over noncritical lesions included moderate-to-severe, focal, lesion-associated spinal cord atrophy: 41/91 (45%) versus 0/98 (0%) (OR, 161.91; 9.43 to >999.9); lateral column axial location (OR, 10.43; 3.88–28.07); central region (OR, 3.23; 1.78–5.88); ventral column (OR, 2.98; 1.55–5.72); and larger lesion size of the axial width (OR, 2.01;1.49–2.72), transverse axial size (OR, 1.66; 1.36–2.01), or lesion area (OR, 1.14; 1.08–1.2). Multiple regression analysis revealed focal atrophy and lateral axial location as having the strongest association with critical demyelinating lesions.
CONCLUSIONS: Focal, lesion-associated atrophy, lateral column axial location, and larger lesion size are spinal cord MR imaging characteristics of critical demyelinating lesions. The presence of critical demyelinating lesions should be sought as these features may be associated with the development of progressive motor impairment in MS.
ABBREVIATIONS:
- PUHMS
- progressive unilateral hemi- or monoparetic MS
- PPS
- progressive paucisclerosis
- PSS
- progressive solitary sclerosis
SUMMARY SECTION
PREVIOUS LITERATURE:
Progressive myelopathic motor impairment is the hallmark feature of progressive multiple sclerosis (MS). Brain involvement such as whole brain atrophy, cortical demyelinating lesions and slowly expanding brain lesions to partially explain progressive MS. Spinal cord atrophy is associated with progression, but there remains an incomplete understanding of how specific focal demyelinating lesions may contribute to progressive MS. Some selected patient cohorts have specific focal “critical” demyelinating lesions anatomically associated with motor progression even with very few additional demyelinating lesions. MR imaging characteristics of “critical” demyelinating lesions are undefined and could provide clinical usefulness in assessing progressive MS.
KEY FINDINGS:
“Critical” demyelinating spinal cord lesions anatomically and clinically associated with progressive motor impairment have MR imaging features of focal spinal cord atrophy, lateral axial location and are larger in size.
KNOWLEDGE ADVANCEMENT:
MR imaging assessment of the characteristic features of “critical” demyelinating lesions may be useful in correlating clinical features of progressive motor impairment of progressive MS. “Critical” demyelinating lesions may be important prognostic features in the development of progressive MS.
Insidiously progressive, asymmetric, myelopathic upper motor neuron weakness is the hallmark of and among the most debilitating features in individuals with progressive demyelinating disease such as progressive MS.1 The direct association between specific, individual, focal demyelinating lesions (the most common radiologic and pathologic feature of MS) with progressive motor impairment has been less clear. Prior studies examining progressive MS development have mainly focused on brain parenchymal changes, including whole-brain atrophy, gray matter atrophy, cortical demyelinating lesions, and slowly expanding brain lesions,2⇓⇓⇓-6 but there remains a “clinical-radiologic paradox,”7 whereby the presence and number of MR imaging brain lesions do not reliably predict the development of progressive MS.
Spinal cord atrophy is present in those with primary and secondary-progressive MS more commonly than in those remaining without progressive disease (“benign” MS). The association with individual focal demyelinating lesions and progressive MS is less certain.8 Spinal cord atrophy is found due to both white and gray matter involvement and distinguishes individuals with this condition from healthy controls. MS spinal cord pathology shows focal demyelinating and decreased axonal density compared with healthy controls.9
The progressive and asymmetric myelopathic pattern could be better explained anatomically by multifocal demyelinating lesions within the spinal cord. Recently, we termed a “critical” demyelinating lesion as that in which an anatomic association was apparent between a specific focal demyelinating plaque and progressive upper motor neuron weakness or spasticity.10 “Critical demyelinating lesions” are a suggested term used at our MS center to describe a lesion that is anatomically associated with the progressive motor impairment seen clinically, and if the patient did not have that lesion, he or she would be almost without impairment. Such critical demyelinating lesions were described in those with only a single CNS demyelinating lesion (progressive solitary sclerosis [PSS]),11 those with a highly restricted (2–5 total MR imaging lesions) demyelinating disease (progressive paucisclerosis [PPS]),12 and those with unlimited CNS demyelinating lesion burden (>5 CNS lesions) but with exclusively unilateral progressive motor impairment (progressive unilateral hemi- or monoparetic MS [PUHMS]).13 While a critical demyelinating lesion may be located within the cervicomedullary junction/brainstem14 or cerebral white matter parenchyma, the most common location is within the spinal cord.11,13,14 Clinical features of progressive motor impairment and MR imaging features of a critical demyelinating lesion appear to be strikingly similar in PSS, PPS, and PUHMS. The aim of this study was to assess the MR imaging characteristics of critical demyelinating spinal cord lesions in these cohorts and compare them with additionally found noncritical spinal cord MR imaging lesions.
MATERIALS AND METHODS
Patient Ascertainment
A retrospective, comparative study of our clinic population assessing individuals with progressive motor impairment for >1 year due to a spinal cord critical demyelinating lesion reviewed data from January 1, 1996, to December 31, 2020 (Fig 1). Patients provided written informed consent according to the Declaration of Helsinki for the use of their de-identified information for research purposes. The study was approved by Mayo Clinic institutional review board (IRB 09–7045).

Patient ascertainment algorithm.
We included individuals with progressive upper motor neuron impairment for >1 year, consistent with PSS (MR imaging burden of a single lesion), PPS (defined as a total CNS MR imaging burden of between 2 and 5 demyelinating lesions), or PUHMS (defined as exclusively unilateral, hemi- or monoparetic motor impairment with >5 total CNS MR imaging demyelinating lesions), and clinical and MR imaging available and of adequate quality.
This was a retrospective study, identified on retrospective review of records following appropriate assessment into the 3 cohorts described. Participants were collected from prior publications (n = 78)11⇓-13 and subsequent enrollment (n = 13). We attempted to enroll all qualifying patients, but we could have missed additional, otherwise-qualified patients. MS-trained neurologists assessed progressive motor impairment by both a consistent clinical history of progressive upper motor neuron weakness characteristics of MS and, when possible, by repeat clinical examination.
Exclusion criteria were PSS, PPS, and PUHMS, when the critical demyelinating lesion was not in the spinal cord (ie, brain or brainstem corticospinal tract lesion) and there were nondefinitive progressive motor impairment and identifiable alternative etiologies of progressive motor impairment. Alternative etiologies for progressive motor impairment apart from CNS demyelinating disease were determined, including compressive, infectious, inherited, nutritional, neoplastic or vascular disease or other immune-mediated demyelinating diseases such as aquaporin-4 immunoglobulin G seropositive neuromyelitis optica spectrum disorder or myelin oligodendrocyte glycoprotein antibody–associated disease. Neuromyelitis optica spectrum disorder and myelin oligodendrocyte glycoprotein antibody–associated disease were excluded by the clinical presentation, neuroimaging findings, and, when available, serologic assessment specific to these immune demyelinating diseases. Peripheral nervous system involvement contributing to progressive motor impairment was evaluated by neurologic examination by neurologists and, when indicated, with nerve conduction studies and electromyography.
Clinical Evaluation.
All participants except one were evaluated by our MS subspecialty neurologists. The remaining person declined face-to-face evaluation, and clinical evaluation was documented at an outside facility and by MR images retrieved electronically for review.
Data recorded included participant sex, age at CNS demyelinating disease symptom onset, demyelinating disease clinical course (relapse onset before progressive motor impairment, “secondary-progressive,” or progressive motor impairment from onset “primary-progressive”), and CSF findings including white blood cell count, protein, glucose, neural autoantibodies, and cytology when available. CSF abnormalities consistent with demyelinating disease were defined as either or all of ≥2 unique CSF abnormal oligoclonal bands (compared with serum oligoclonal bands) or immunoglobulin G (index of >0.85 or CSF κ free light chain of >0.1000 mg/dL).
MR Imaging Evaluation
Spinal Cord MR imaging Acquisition.
For imaging performed at our institution, spinal cord MR imaging consisted of sagittal T1- and T2-weighted, frequently sagittal T1- and T2-weighted STIR, axial T2-weighted, sagittal postgadolinium T1-weighted and, in some, axial postgadolinium T1-weighted imaging. Brain MR imaging included T1- and T2-weighted, T2-weighted FLAIR, and postgadolinium T1-weighted sequences. The demyelinating protocol at our institution for a spinal cord section thickness is set to 3 mm for sagittal and 4 mm for axial images, and brain MR imaging currently has a section thickness of 1 mm for T2 FLAIR and T1-weighted (pre- and postcontrast) images. Most MR imaging examinations were performed at 3T: cervical spine: GE Healthcare: sagittal T1 FLAIR (FOV = 220; matrix = 320 × 224; TR = 2800 ms; TE = 28 ms), sagittal T2 (FOV = 220; matrix = 384 × 256; TR = 3000–6000 ms; TE = 105 ms), sagittal STIR (FOV = 220; matrix = 352 × 224; TR = 2600 ms; TE = 42 ms; TI = 143 ms), and axial T2 (FOV = 200; matrix = 320 × 256; TR = 3000–6000 ms; TE = 105 ms). Siemens: sagittal T1 (FOV = 220; matrix = 320 × 224; TR = 600 ms; TE = ms 9), sagittal T2 (FOV = 220; matrix = 384 × 269; TR = 3000–6000 ms; TE= 94 ms), sagittal STIR (FOV = 220; matrix = 256 × 218; TR = 3000–6000 ms; TE = 52 ms; TI = 145 ms), and axial T2 (FOV = 140; matrix = 320 × 240; TR = 3000–6000 ms; TE = 99 ms). Thoracic spine: GE Healthcare: sagittal T1 FLAIR (FOV = 300; matrix = 384 × 56; TR = 2800 ms; TE= 24 ms), sagittal T2 (FOV = 300; matrix = 488 × 288; TR = 3000–6000 ms; TE = 102 ms), sagittal STIR (FOV = 300; matrix = 352 × 288; TR= 3248 ms; TE = 42 ms; TI = 143 ms), and axial T2 (FOV = 200; matrix = 384 × 256; TR = 3000–6000 ms; TE = 102). Siemens: sagittal T1 (FOV = 320; matrix = 384 × 288; TR = 600 ms; TE = 7.2 ms), sagittal T2 (FOV = 320; matrix = 448 × 336; TR = 3000–6000 ms; TE = 94 ms), sagittal STIR (FOV= 320; matrix = 320 × 256; TR = 2600–6000 ms; TE = 42 ms; TI = 145 ms), and axial T2 (FOV = 200; matrix = 320 × 256; TR = 3000–6000 ms; TE = 91 ms).
Spinal cord MR imaging from outside institutions, at a minimum, consisted of sagittal T1- and T2-weighted and axial T2-weighted sequences. Brain MR imaging from outside institutions required a minimum of T1- and T2-weighted and T2-weighted FLAIR sequences.
Spinal Cord MR Imaging Lesion Evaluation/Spinal Cord Tool.
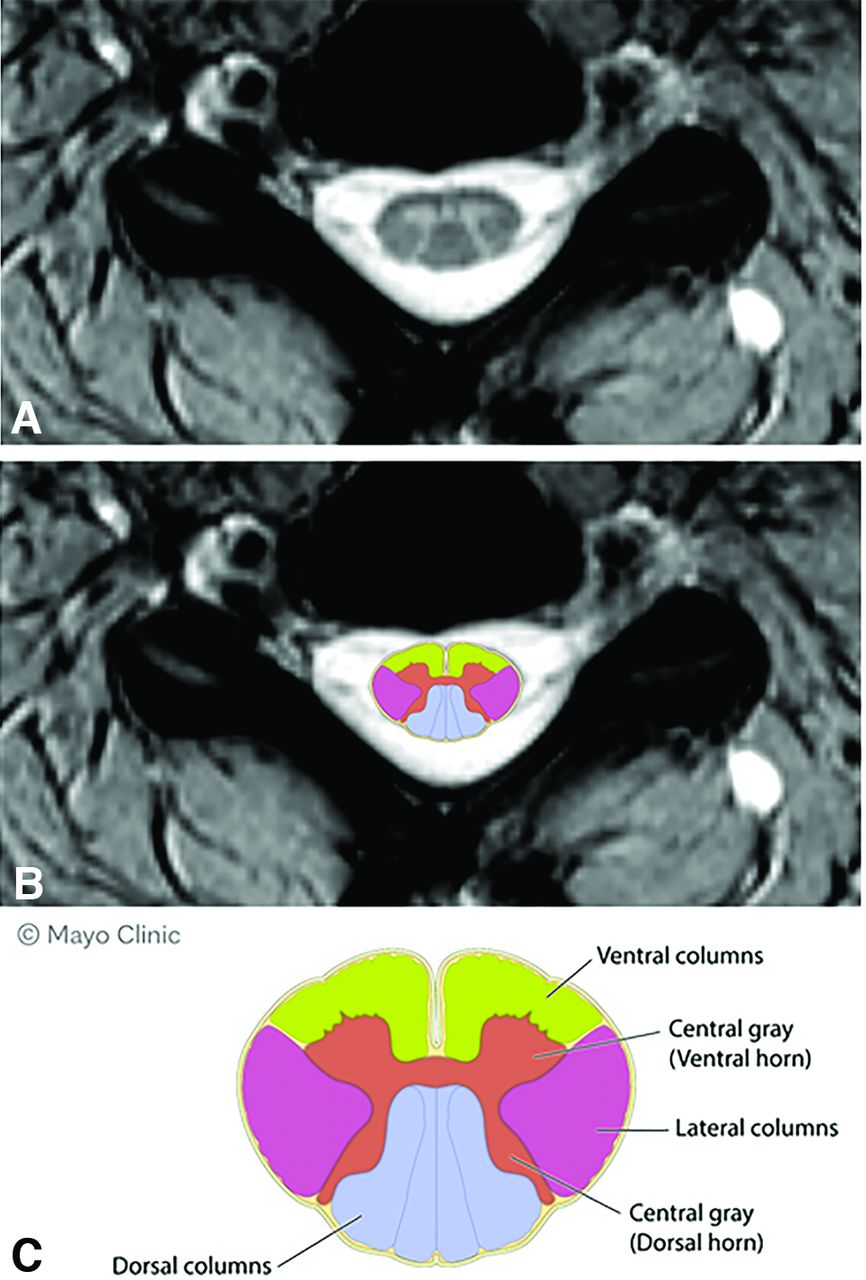
All spinal cord MR images in each participant were reviewed in a blinded fashion from the neurologic evaluation by an experienced, board-certified neuroradiologist to identify all unequivocal spinal cord demyelinating lesions and their location (Fig 2). Assessments were made manually and then entered into an interactive case report form tool similar to others developed previously.15 Because individuals with PSS have only 1 demyelinating lesion, additional spinal cord lesions were seen in those with PPS and PUHMS. The categoric definition of MR imaging assessment was defined before data collection. Data acquired for each critical and noncritical lesion included sagittal assessment of the corresponding vertebral body location, laterality (left versus right), axial assessment of specific spinal cord column involvement (ventral, dorsal, central, lateral, and combinations of each when >1 column was affected [Fig 2]), and lesion size (the number of vertebrae involved and width, height, and area of each detected lesion in each image were drawn and measured by the neuroradiologist).

Axial spinal cord columns. A, Axial T2 spinal cord imaging. B, Superimposed schematic of axial columns on axial MR image. C, Schematic diagram of axial columns of spinal cord.
The spinal cord interactive tool was developed by our Biomedical Imaging Resource to manage the cohort images and allow a generally unencumbered examination of the images while forcing decisions of lesion presence and count or absence in specific regions of the brain scans and providing tools to fully characterize the lesions detected in the thoracic and cervical scans. The width, height, and area of each detected lesion in each image was measured, along with the number of vertebrae involved and the ROI saved with sufficient detail to allow additional review/auditing of the acquired data as well as the ability to retrieve all lesion samples for future training of an artificial intelligence model to detect lesions.
Critical Lesion versus Noncritical Lesion Assessment
Neurologists with expertise in MS independently reviewed all available clinical data regarding assessment of progressive motor impairment due to demyelinating disease. Prior experience from assessment of such lesions in earlier studies identified a lesion anatomically associated with progressive motor impairment. For example, a person with progressive face-sparing, left hemiparesis could be classified as having a critical spinal cord lesion only if there was a cervical spinal cord lesion involving the left hemi-spinal cord and no additional demyelinating lesions along the corticospinal tracts of the cerebrum, brainstem, or cervicomedullary junction. To be classified as critical, the demyelinating lesion must account for all involved limbs. However, a person with progressive left monoparesis of the lower extremity would qualify if either a cervical or thoracic spinal cord lesion of the left hemi-spinal cord were present.13 A contralateral hemi-spinal cord lesion would not be included because it would not explain the progressive clinical findings. When uncertainty arose as to the classification of critical demyelinating lesions, consensus was reached by the evaluating coauthors (B.M.K., S.A.M., E.P.F.).
Focal Spinal Cord Atrophy
Focal spinal cord atrophy was gauged initially by visual inspection. With no reliable, objective, and validated methods to assess focal spinal cord atrophy formally, a visually highly compelling and robust atrophy was sought. The presence of atrophy was dichotomized as “present” only when judged to be unequivocally moderate or severe (ie, at least 20% loss of spinal cord with area of T2 signal abnormality compared with the unaffected hemicord at that level) and judged to be “absent” when only mild or no atrophy was observed. In equivocal circumstances, consensus was reached by the evaluating coauthors.
Statistical Analysis
Age was summarized using median, range, and SD, while PSS, PPS, and PUHMS were summarized using count and percentage. Logistic regression was used to examine the relationship between critical and noncritical lesions and multiple biologic variables. Multiple logistic regression and the Firth option were used to assess multiple biologic variables including atrophy. Analysis was performed using SAS, Version 9.4 (SAS Institute).
Data Availability
Anonymized data used for this study are available.
RESULTS
Demographics and Clinical Presentation
Participant demographics and clinical presentations are detailed in Table 1. Most participants were women and of white ethnicity. The most common clinical courses were progression from onset (primary-progressive) and PUHMS.
Clinical characteristics of 91 individuals with critical demyelinating lesions
Neuroimaging
Formal assessment was performed on 302 cervical and 91 thoracic spinal cord MR images. Ninety-one critical demyelinating lesions were identified and compared with 88 noncritical lesions assessed (Table 2). The critical demyelinating lesion was in the cervical spinal cord, associated with corresponding ipsilateral hemiparesis or monoparesis in 74 patients, and in the thoracic spinal cord associated with corresponding ipsilateral monoparesis in 17 patients. Critical demyelinating lesions were more commonly observed in the upper cervical spinal cord (C1–4; n = 52) and lower cervical spinal cord (C5–7; n = 22) than in the upper thoracic spinal cord (T1–5; n = 12) or lower thoracic cord (T6–12; n= 5). Sixty-three noncritical cervical spinal cord lesions were evaluated in 39 individuals, and 25 noncritical thoracic spinal cord lesions were evaluated in 24 individuals.
MR imaging characteristics in 91 critical and 88 noncritical spinal cord demyelinating lesions
Moderate-to-Severe Focal Lesional Atrophy
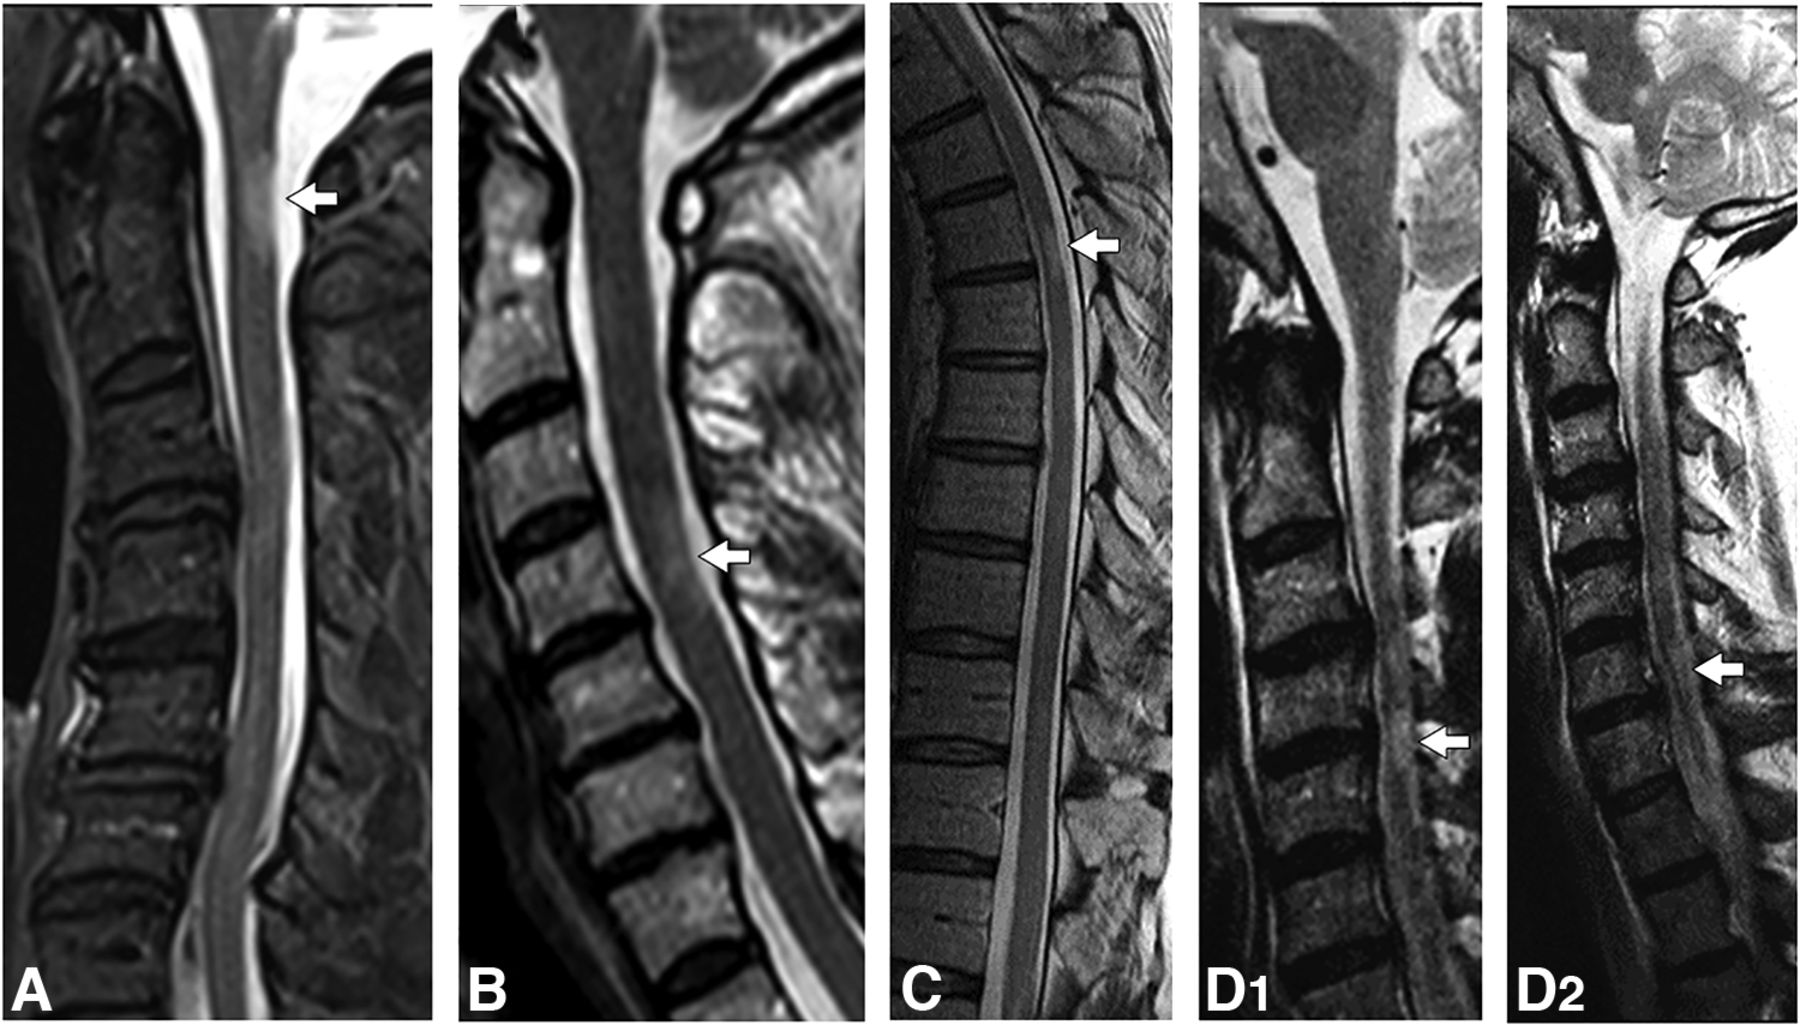
All spinal cord lesions with moderate-to-severe focal lesional atrophy were critical demyelinating lesions, and no noncritical demyelinating lesions had moderate-to-severe focal lesion atrophy (OR , 161.907; 95% CI, 9.433 to >999.999; P = .0005). Of the critical demyelinating lesions, 41/91 (45.1%) had moderate-to-severe focal lesional atrophy (Table 2 and Figs 3 and 4).

Examples of critical T2-hyperintense demyelinating lesions on sagittal T2-weighted images. Imaging composite of sagittal T2-weighted images in patients with critical lesions with corresponding axial images. A right C1 T2-hyperintense lesion with focal atrophy (A, arrow). A left C4 T2-hyperintense lesion with focal atrophy (B, arrow). A right-sided upper thoracic spine; T2-hyperintense lesion with focal atrophy (C, arrow). A left-sided C4-C5 T2-hyperintense lesion with focal atrophy (D1, arrow). An additional noncritical lesion is noted at the C6 level (D2, arrow).

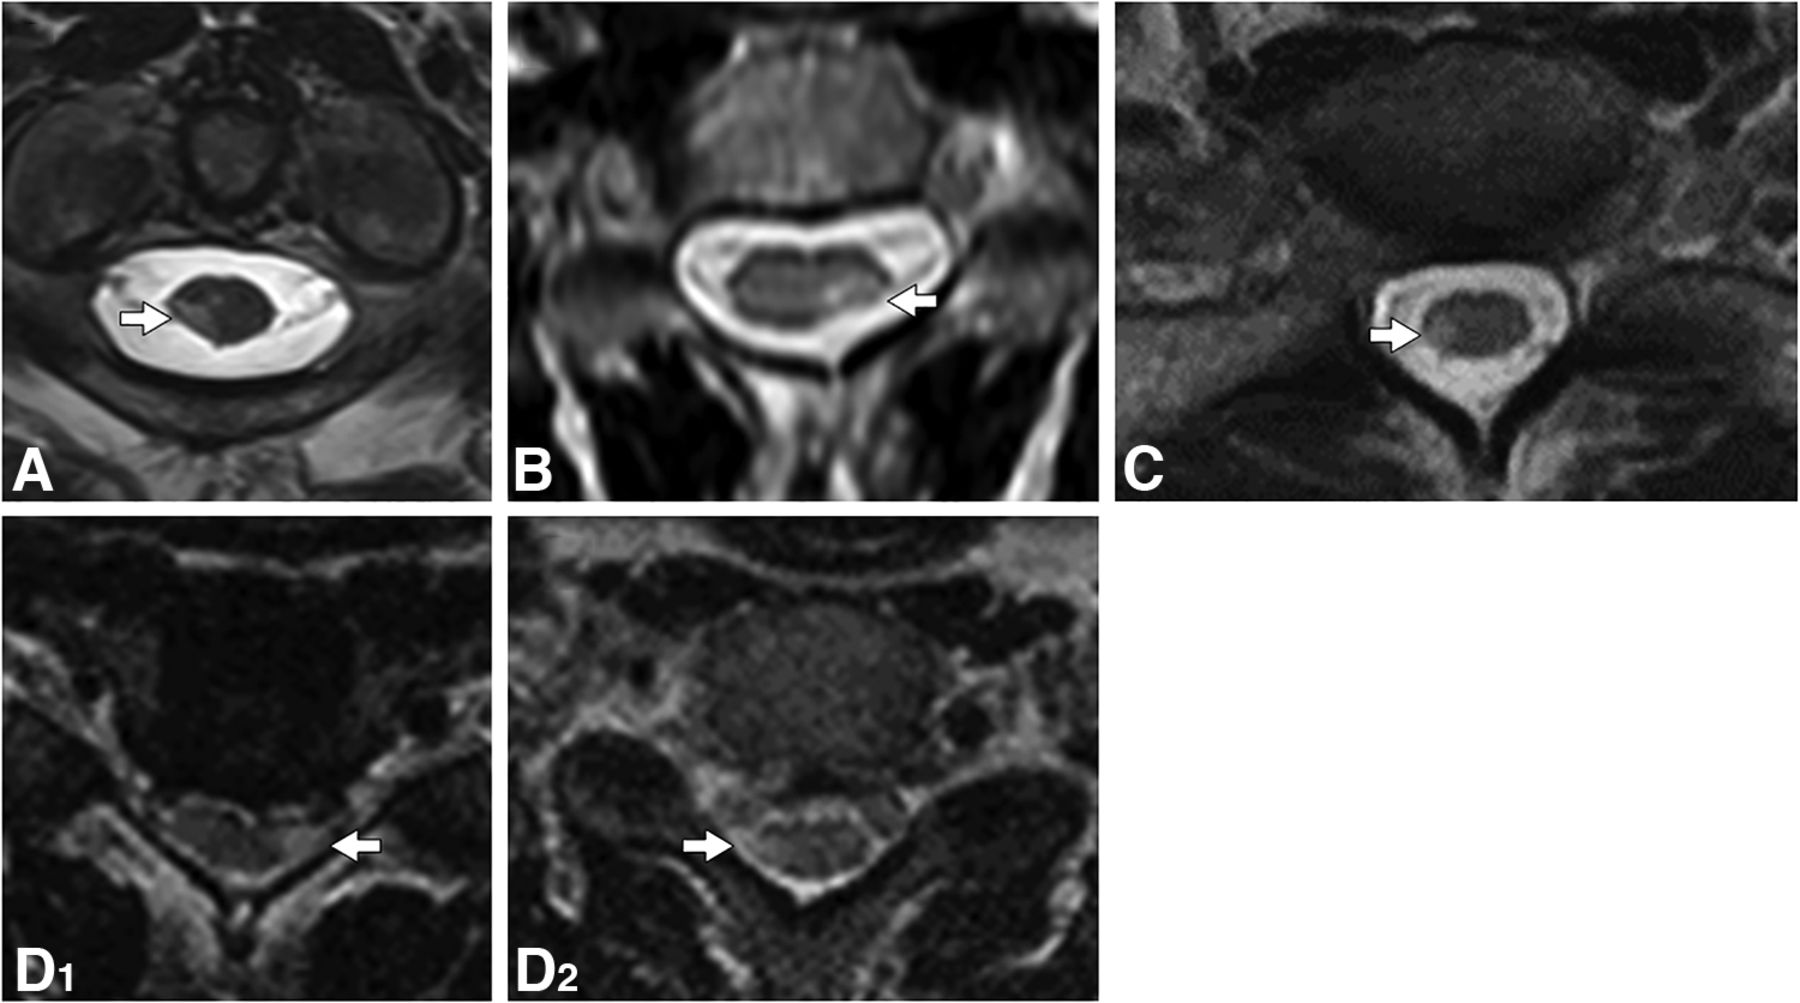
Examples of critical T2-hyperintense demyelinating lesions on axial T2-weighted images. Imaging composite of axial T2-weighted images in patients with critical lesions, corresponding to sagittal images and clinical details. The corresponding axial images reveal a T2-hyperintense lesion in the right lateral column with focal atrophy (A, arrow), a T2-hyperintense lesion in the left lateral column with focal atrophy (B, arrow), a T2-hyperintense lesion in the right lateral column with focal atrophy (C, arrow), a T2-hyperintense lesion in the left lateral column with focal atrophy (D1, arrow), and a T2-hyperintense lesion in the right lateral column without focal atrophy (D2, arrow).
Axial Column Lesion Location
On univariate analysis, critical demyelinating lesions were most commonly identified as involving the lateral axial region of the spinal cord (OR, 10.43; 95% CI, 3.88–28.07; P = < .0001), the central axial region (OR, 3.23; 95% CI, 1.78–5.88; P = .0001), and the ventral axial region (OR, 2.98; 95% CI, 1.55–5.72; P = .001). Lesions were less likely to be critical when they involved the dorsal axial regions of the spinal cord (OR, 0.45; 95% CI, 0.24–0.86; P = .0145; Table 2 and Figs 3 and 4).
Critical demyelinating lesions were more likely to involve >1 tract (Table 2). There was an increased association with critical demyelinating lesions, especially when the lateral column plus additional columns were involved (lateral only: (OR, 5.01; 95% CI, 1.71–14.64; P = .0033); lateral column and any additional column lateral + other: OR, 17.27; 95% CI, 6.12–48.70; P =<.0001).
Central and ventral lesions may be critical if the lateral column is also involved (Table 2). When lesions involved solely the central region, they were rarely critical. Critical lesions were more common in those with either ventral or central lesion and lateral lesion involvement versus those with central or ventral or dorsal with no lateral lesion involvement (OR, 8.60; 95% CI, 2.81–33.00; P < .001). No critical lesion solely involved the ventral column but always involved the lateral column as well.
Larger lesion size is associated with critical lesion status, including the area of the lesion (median, 14 versus 7.6 mm; OR, 1.14; 95% CI, 1.08–1.20; P = <.0001; C-statistic per 1 mm = 0.75; 95% CI, 0.68–0.81), axial anterior-posterior width (4.1 versus 3.3 mm; OR. 2.01; 95% CI, 1.49–2.72; P = <.0001), and the transverse axial diameter of the lesion (median, 5.2 versus 3.5 mm; OR, 1.66; 95% CI, 1.36–201; P = <.0001; C-statistic per 1 mm = 0.71; 95% CI, 0.64–0.78; Table 2). The association with lesion size remained even though such lesions were often atrophic, making them smaller. This association between larger lesion size and the critical nature of the lesion is especially pronounced if considered in the absence of moderate-to-severe atrophy, which reduces the lesion size.
Multiple Regression Analysis
A multiple regression analysis demonstrated that the factors independently associated with a critical demyelinating lesion were the presence of moderate-to-severe atrophy (OR, 78.216; 95% CI, 4.267 to >999.999; P = .0026) and axial location involving the lateral column of the spinal cord, lateral column only versus no lateral column involvement (OR, 4.998; 95% CI, 1.572–15.888; P = .0064), and lateral column with additional column involvement versus no lateral column involvement (OR, 7.069; 95% CI, 2.292–21.800; P = .0007). Lesion size was not associated with critical demyelinating lesion documentation following multiple regression analysis (lesion area: OR, 1.061; 95% CI, 0.993–1.134; P = .0806).
DISCUSSION
Critical spinal cord demyelinating lesions associated with progressive motor impairment have MR imaging characteristics of moderate-to-severe focal lesion–associated spinal cord atrophy and are most commonly in the lateral column, both when restricted to 1 column and when combined with additional spinal cord column involvement. Central and ventral column distributions were also associated with critical demyelinating lesions in univariate analysis but only when also associated with lateral column involvement. Dorsal column lesions were inversely associated with progressive motor impairment. Critical demyelinating lesions were larger than noncritical lesions, with a particularly strong association noted when focally atrophic lesions were excluded.
Critical demyelinating lesions capture the eloquent territory and anatomic plausibility of association with progressive motor impairment due to demyelinating disease, and these results emphasize the importance of axial spinal cord imaging for column localization and focal atrophy assessment. Most descending motor corticospinal tracts are located within the lateral columns. The ventral spinal cord column contains the ventral motor corticospinal tracts (10%), possibly explaining its association but to a lesser degree, with progressive motor impairment. The dorsal columns contain predominantly ascending vibratory and joint position sense, so they may be expected to contribute to ambulatory impairment with sensory ataxia but would not be expected to contribute to progressive motor weakness.
The importance of spinal cord MR imaging assessment in progressive demyelinating disease is increasingly recognized. The presence of spinal cord lesions is associated with both the future development of relapsing MS and progressive MS in radiologically isolated syndrome.16 In individuals with clinically isolated syndromes of demyelination, spinal cord lesions are associated with development of progressive MS and increased disability.17,18 Spinal cord volume loss is associated with progressive MS at its earliest stages.19⇓⇓-22 Spinal cord atrophy, including cervical enlargement volume loss, is an active area of MS spinal cord imaging research.23,24 Increased spinal cord demyelinating lesion load is found to be higher in primary- and secondary-progressive than in relapsing-remitting MS, and the upper cervical cord lesion load and cord atrophy are independently correlated with disability and progressive MS.25 Furthermore, the number of focal spinal cord lesions within the lateral column and gray matter is independently associated with disability in MS.26 Demyelinating lesion location along the corticospinal tracts in the lateral funiculus of the spinal cord and entire CNS is associated with progressive MS and disability.27,28 Central spinal cord involvement was more frequent in primary-progressive MS than in relapsing-remitting MS, and lateral and central cord involvement correlated with disability on the Expanded Disability Status Scale.28
The importance of MR imaging lesion location in differing phenotypes of progressive MS and disability is recognized as well. A demyelinating lesion located within the posterior fossa (cerebellum, brainstem) increases both the likelihood of a diagnosis of relapsing-remitting MS and of disability accumulation29 in individuals with clinically isolated syndrome. However, in another study, early spinal cord lesions were more associated with disability progression than infratentorial lesions across time in MS,30 highlighting the crucial importance of MR imaging assessment of the spinal cord in evaluating and prognosticating progressive MS. One strength of the study is the collection of human annotation data, which can serve as the basis for developing new algorithms to detect and characterize spinal cord demyelinating lesions, as well as possibly predicting progression or guiding interventions. Modern artificial intelligence has proved to be a viable pathway to clinical care in MS;31 however, the veracity of these approaches depends on the quality of the data used in training the model.
There are several limitations to this study. This is a retrospective, single, tertiary care center study. MR images were obtained as part of routine clinical care across many years on scans of variable quality. Despite this limitation, the critical lesions were reliably identified and assessed, indicating a strong likelihood of generalizability of the findings across typical clinical care in many centers assessing progressive demyelinating disease. Furthermore, this finding encourages improvement in spinal cord MR imaging assessment and techniques.32 Individuals in this study were highly selected as having progressive motor impairment associated with individual critical lesions, and a circular argument may be made that a lesion is deemed critical if it corresponds to the clinical presentation. A few individuals in the progressive solitary sclerosis cohort did not meet current diagnostic criteria for primary-progressive MS because they had fewer demyelinating lesions than required. However, critical lesions are strikingly similar in each group; they are highly characteristic of progressive MS in many aspects (age at progression,33 CSF biomarkers34). Ideally, a cohort of unselected patients with MS with additional, blindly assessed spinal cord scans would allow a clearer assessment of spinal cord demyelinating lesions associated and unassociated with motor progression. While we found focal atrophy and axial lateral column location to be important, additional pathologic factors such as severity of the axonal loss versus demyelination predominance and the degree of remyelination may be involved, and neuropathologic spinal cord tissue examination is lacking in these presented individuals.
Findings consistent with this study have been reported in a variety of demyelinating disease subtypes, including radiologically isolated syndrome, clinically isolated syndromes of demyelination, and MS cohorts. Additionally, in a population-based study, our group found that those with longstanding MS (>25 years’ disease duration) who do not have such critical demyelinating lesions are more likely to remain with relapsing-remitting MS rather than developing progressive MS.10 Future investigations of such critical demyelinating lesions will assess how often they occur in unselected individuals with MS, when the critical lesions become radiologically evident, and how they evolve on MR imaging in association with the clinical presentation of progressive, anatomically consistent motor impairment. Optimal current and future spinal cord imaging techniques to identify critical demyelinating lesions and better understand their underlying pathophysiology will be important.
CONCLUSIONS
Critical demyelinating lesions in these cohorts with progressive motor impairment are associated with MR imaging spinal cord characteristics of moderate-to-severe focal atrophy, lateral spinal column location, and large lesion size. Critical spinal cord demyelinating lesions may represent a compelling prognostic and therapeutic target of demyelinating conditions such as progressive MS.
Acknowledgments
The authors greatly appreciate Ms Lea Dacy and Mr Jon Harrington for administrative assistance.
Footnotes
This work was funded by the Mayo Clinic Center for Individualized Medicine and Applebaum Family Fund Philanthropy.
Disclosure forms provided by the authors are available with the full text and PDF of this article at www.ajnr.org.
Disclosures: Disclosure forms provided by the authors are available with the full text and PDF of this article at www.ajnr.org.
References
- Received December 19, 2023.
- Accepted after revision February 19, 2024.
- © 2024 by American Journal of Neuroradiology


Jump to section
Related Articles
Cited By...
- No citing articles found.