
Abstract
SUMMARY: An improved understanding of the cellular and molecular biologic processes responsible for brain tumor development, growth, and resistance to therapy is fundamental to improving clinical outcomes. Imaging genomics is the study of the relationships between microscopic, genetic, and molecular biologic features and macroscopic imaging features. Imaging genomics is beginning to shift clinical paradigms for diagnosing and treating brain tumors. This article provides an overview of imaging genomics in gliomas, in which imaging data including hallmarks such as IDH-mutation, MGMT methylation, and EGFR-mutation status can provide critical insights into the pretreatment and posttreatment stages. This article will accomplish the following: 1) review the methods used in imaging genomics, including visual analysis, quantitative analysis, and radiomics analysis; 2) recommend suitable analytic methods for imaging genomics according to biologic characteristics; 3) discuss the clinical applicability of imaging genomics; and 4) introduce subregional tumor habitat analysis with the goal of guiding future radiogenetics research endeavors toward translation into critically needed clinical applications.
ABBREVIATIONS:
- AI
- artificial intelligence
- CE
- contrast-enhanced
- DCE
- dynamic contrast-enhancement
- DMG
- diffuse midline glioma
- H3K27-DMG
- histone H3 lysine 27-altered diffuse midline glioma
- H3K27me3
- H3 lysine 27 trimethylation
- IVIM
- intravoxel incoherent motion
- LASSO
- least absolute shrinkage and selection operator
- PCA
- principal component analysis
- rCBV
- relative CBV
- TERT
- telomerase reverse transcriptase
- TME
- tumor microenvironment
- WHO
- World Health Organization
Imaging genomics is the study of the relationships between microscopic, genetic, and molecular biologic features and macroscopic imaging features. Imaging genomics is important in CNS pathologies because tissue sampling faces challenges, including invasiveness in a critically functioning organ, the feasibility of intraoperative imaging, technical difficulties in site-specific tissue sampling, and requirements for study team coordination among neurosurgeons, radiologists, and pathologists. Through the use of imaging genomics, we seek to improve the clinical care of patients by predicting risk and patient outcomes with identification of noninvasive imaging biomarkers.1 Imaging features can be divided into 2 categories: first, low-dimensional imaging features that include semantic or qualitative features comprising a standardized lexicon for the description of tumors (Visually AcceSAble Rembrandt Images [VASARI]; https://radiopaedia.org/articles/vasari-mri-feature-set) or a description of tumor morphology (ie, T2-FLAIR mismatch sign). Second, radiomics features include high-throughput data that completely cover the range of quantitative features that can be extracted from images such as texture, shape, and margin gradient.2 Radiomics can be derived from either handcrafted or deep learning techniques.3 Radiogenomics is a subcategory of imaging genomics that is based on radiomics.1,2 In radiogenomics, imaging features are extracted automatically and with high throughput, and radiogenomics often requires the use of a machine learning algorithm for model development.2,4
Imaging genomics is technology-heavy and incorporates some combination of clinical imaging, “-omic” tissue analyses with “big data” bioinformatics, and artificial intelligence (AI) through machine learning algorithms. Imaging genomics has different methodologic approaches and uses low-dimensional semantic features and high-dimensional radiomics features. During cancer development, a few genes undergo distinct changes in specific locations,5 and identifying these with imaging biomarkers requires distinct radiomics techniques. For instance, an IDH mutation is an ideal tumor-specific neoantigen that can be assessed with low-dimensional imaging features because it is uniform in a given tumor and does not change with time.6 On the other hand, epidermal growth factor receptor (EGFR) amplification and MGMT promoter methylation status are distributed heterogeneously within a given tumor, and loss of EGFR amplification7 and alterations of the MGMT promoter methylation status occur during treatment.8 These results necessitate using high-dimensional imaging features including radiomics and deep learning–based features to spatially discern these heterogeneous biologic expression patterns. AI is particularly helpful to handle high-dimensional imaging features as well as large-scale transcriptomics and genomics data.
Imaging genomics can be applicable to many clinical scenarios from diagnosis to treatment-planning and evaluating the treatment response. For example, it may be applied when tumor diagnostics are incomplete due to challenges with tissue sampling or when noninvasively subtyping gliomas on the basis of known gene expression or mutation patterns, including those associated with IDH, MGMT, EGFR, and others.9⇓-11 Moreover, imaging genomics and radiomics have applicability in prognostication, which can support decision-making of patients and clinicians. Its applications also extend into evaluating the tumor microenvironment and determining how this microenvironment changes with time in response to treatment. Finally, imaging genomics and especially radiomics may provide novel tools to evaluate the response to these therapies when it is challenging to distinguish posttreatment changes such as pseudoprogression, tumor progression, and treatment complications such as radionecrosis.
This article will achieve the following: 1) review the methods used in imaging genomics including visual analysis, quantitative analysis, and radiomics analysis; 2) recommend suitable analytic methods for imaging genomics according to biologic characteristics; 3) discuss the clinical applicability of imaging genomics; and 4) introduce subregional tumor habitat analysis with the goal of guiding future radiogenetics research endeavors toward translation into critically needed clinical applications.
PART 1: METHODOLOGY OVERVIEW
An overview of the methodology and clinical utility of imaging genomics is shown in Fig 1. Imaging genomics studies are usually based on 3 main methodologies: First, physiologic information from multiparametric MR imaging, usually based on low-dimensional features, can be used. Second, modeling and validation using high-dimensional data including radiomics and deep learning can be performed. Third, voxelwise spatial mapping and clustering using voxels from multiparametric MR imaging can be used. The main role of imaging genomics is prediction of genomics, including depiction of intratumoral heterogeneity, prediction of molecular subtypes, or colocalization and in situ validation. Depiction of intratumoral heterogeneity, which is often achieved with radiomics, facilitates understanding of microscopic genetic features. Prediction of molecular and genetic mutations in individuals or groups facilitates understanding of molecular and biologic features. Colocalization and in situ validation, which are often achieved with voxel-wise clustering and spatial mapping, facilitate understanding of macroscopic features to predict tumor aggressiveness, tumor infiltration, and vascularity. Further clinical utilities for imaging genomics include prognostication for patient consultation and determination of the therapeutic implications of treatment-planning for chemotherapy and radiation therapy. A detailed process of structuring an imaging genomics study is summarized as follows.

Sample workflow for imaging genomics studies to integrate glioma imaging phenotypes with molecular features. In imaging genomics studies of glioma, pretreatment MR imaging sequences are typically obtained. Next, tumor tissue is collected, sometimes under image guidance in relation to specific imaging features, and then subjected to various types of genomics, transcriptomics, and proteomics analyses. Both the imaging and molecular data require preprocessing and normalization steps before they are integrated to assess the associations between imaging phenotypes and genomic and molecular features. Finally, these associations are interpreted in the context of the clinical disease and known complex biologic processes and pathways.
Data Collection
Imaging data are collected through standard and specialized protocols that provide detailed information about the size, shape, location, and other imaging characteristics of the tumor, while biologic data collected from tissue samples reveal the genomic/transcriptomic profile of the tumor. Imaging data variability must be considered and harmonized across different imaging vendors and institutions because it greatly affects the reproducibility of imaging features. Imaging-acquisition protocols need to be unified across multiple centers to conduct a prospective study. For retrospective analysis, a phantom study, test-retest analysis, quantitative maps, or value normalization can be used. The detailed methodology is explained elsewhere.12 For tumor characteristics that are binary (such as the presence or absence of an IDH mutation) and that do not change across a tumor, tumor tissue samples do not need to be spatially colocalized with the specific imaging features with which they are being correlated. Publicly available databases of genomics and transcriptomic data and their correlated clinical radiographs have resulted in some of the first large number of cohort studies in this field, for instance, the National Cancer Institute’s large The Cancer Genomic Atlas was expanded to include a companion imaging database, The Cancer Imaging Archive, which has led to hundreds of publications in oncology exploring radiogenomics (https://www.cancerimagingarchive.net). However, for biologic features that vary over regions of a single tumor, spatially colocalized data (imaging and biologic) need to be collected from brain tumors. Precise colocalization of the tissue and imaging data is critical to permit these correlates, and this can be achieved through intraoperative stereotactic tissue sampling.13,14
Imaging Data Preprocessing
Once the data are collected, they undergo preprocessing steps to ensure their quality and suitability for postprocessing. These may involve tasks such as resizing the images to a consistent resolution, normalizing the intensity values, removing artifacts or noise, and aligning the images in a standardized orientation.
ROI Segmentation
Once the images are acquired, an ROI is defined. The ROI is typically used as a bounding method (manual or automated segmentation) that prevents analytic extension into normal brain structures. This step ensures that subsequent analyses are specifically conducted on the tumor region.
Image Processing and Feature Extraction (especially, radiomics)
Once the imaging data are collected, they can undergo any number of image-processing steps to extract relevant features from the precise location of the colocalized tissue sample. Imaging features can be obtained from anatomic images (T1, T2-weighted, FLAIR), diffusion-weighted images, perfusion-weighted images, and metabolic images. Relevant imaging features according to genetic/molecular features are demonstrated in Part 2. In radiomics, these include intensity-based features (voxel intensities), shape-based features (geometric properties), texture-based features (spatial patterns), and spatial-based features (relationships between different regions).
Biologic Analysis
The tissue data are simultaneously processed and analyzed to identify genetic mutations, gene-expression patterns, methylation patterns, and other biologic alterations. This direct tissue analysis provides information about the molecular characteristics and nuanced tumor biology, which can include potential therapeutic targets. Further subanalyses of the gene-expression profile can provide additional tissue features such as an estimation of the abundance of member cell types in a mixed cell population with cellular deconvolution techniques.
Data Integration and Analysis
The extracted imaging features and biologic data are then integrated and analyzed together to define biologic processes that are correlated with imaging features or phenotypes. The detailed integration analysis is explained in Part 2 regarding molecular features. Supervised learning including modeling is the most common method to predict 1 or 2 genomic mutations and molecular features. In radiomics, statistical and machine learning techniques including dimensionality reduction methods, feature selection techniques, or modeling approaches are used. When one uses AI, the choice of model depends on the specific task and available data. For example, convolutional neural networks can achieve image-analysis tasks by learning patterns and features from the input training images. The training process adjusts the internal parameters of the model to minimize the differences between the predicted and ground truth tumor annotations. After training, the model is evaluated using a separate validation data set. This step assesses the performance and generalizability of the model and may involve adjusting hyperparameters (eg, learning rate, regularization), exploring different model architectures, or augmenting the training data with transformations or variations. For validation, external validation is highly recommended to achieve the generalizability of the model. The detailed radiologic and statistical perspectives are summarized elsewhere.12 Other analytic methods are as follows: Correlation plots or unsupervised learning methods including clustering are adopted to demonstrate heterogeneity to demonstrate correlation among multiple different genomic mutations and molecular features. To perform a prognostication or outcome study using imaging genomics, one can perform time-to-event analysis.
PART 2: ANALYTIC METHODOLOGY FOR DIFFERENT MOLECULAR FEATURES OF GLIOMAS
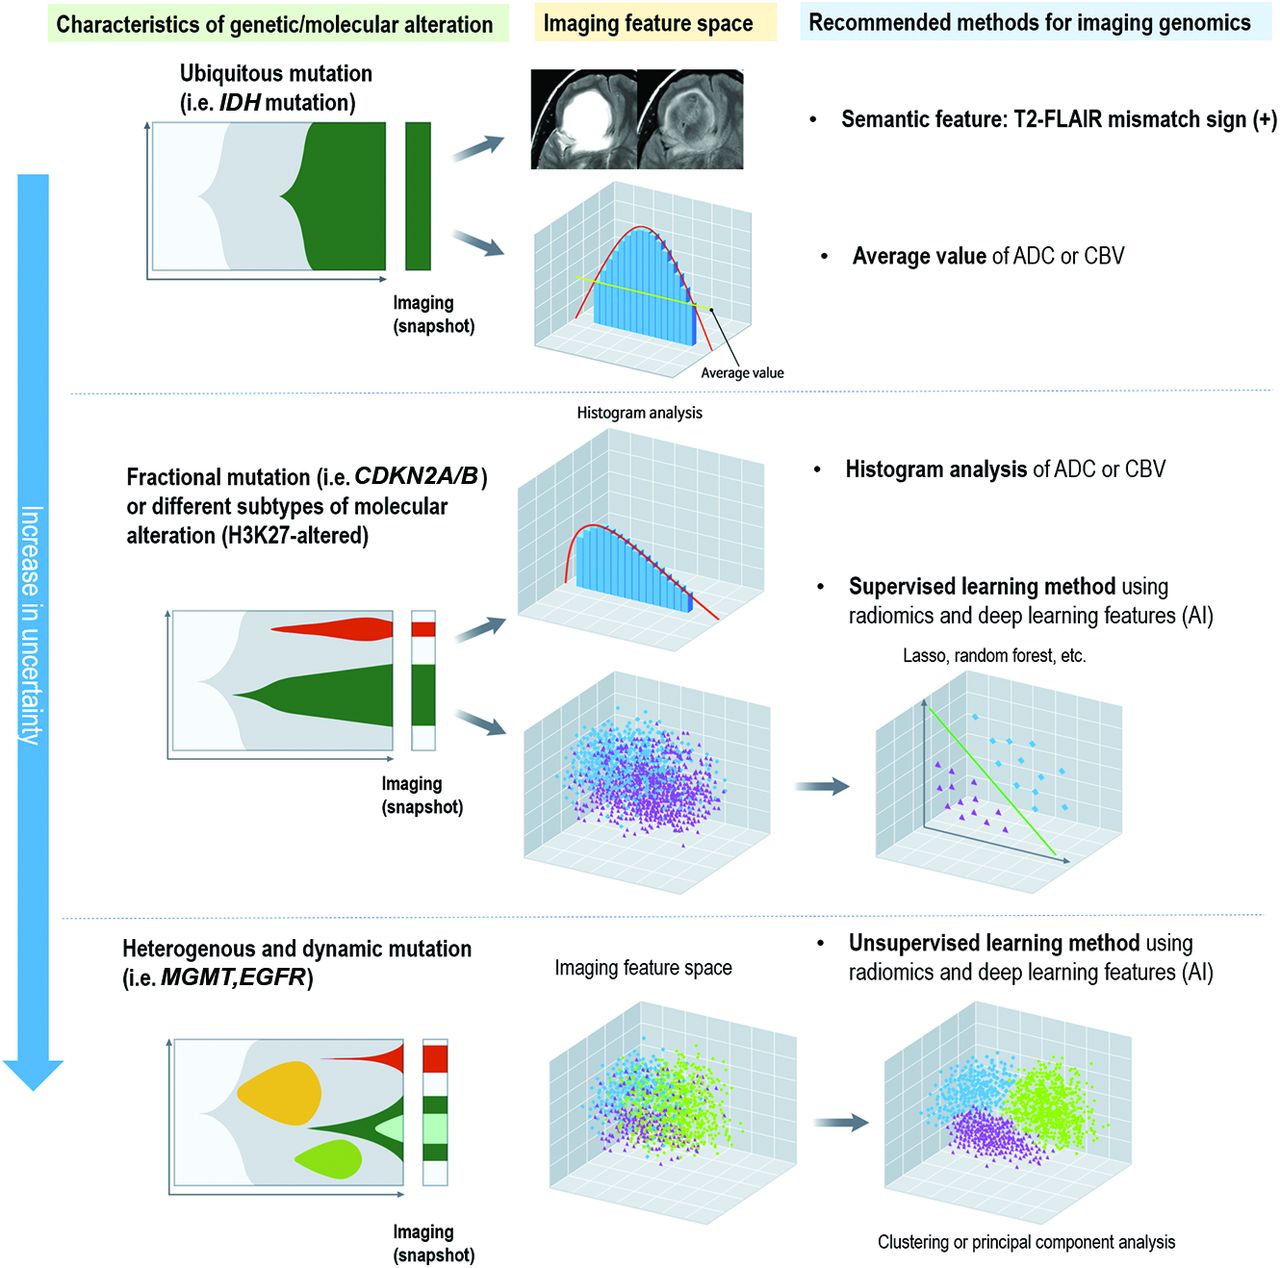
The spatial distribution of tumor molecular features has a substantial influence on the choice of analytic methodology (Fig 2). The biologic background of the molecular features of gliomas is summarized with a review of current analytic methodologies (Online Supplemental Data).4,15,16 The analytic approaches that best reflect the spatial distribution of given molecular features are proposed. Ubiquitously expressed biologic features such as IDH mutations may be assessed using low-dimensional, lesion-wide analysis. Conversely, for molecular features with fractional mutation (ie, CDKN2A/B) or different subtypes of molecular alterations (ie, H3K27-altered), a histogram analysis or high-dimensional analysis using imaging-based computational techniques such as radiomics and deep learning with a supervised approach may be the most appropriate. For heterogeneous and dynamic molecular features (ie, MGMT promoter methylation, EGFR amplification), radiomics and deep learning with an unsupervised approach may best reflect spatial and temporal heterogeneity.

Differences in the biologic distribution of genes and molecular subtypes in glioma and suggested analytic methods of imaging genomics. For genes and molecular subtypes that are stable and ubiquitous, imaging genomics using averaged values or a simple imaging phenotype such as T2-FLAIR mismatch sign is applicable. For genes and molecular subtypes with a skewed distribution or those that include different subtypes, a histogram analysis or supervised learning using AI or radiomics is applicable. For genes and molecular subtypes that are dynamic and heterogeneous, pattern-wise analysis using unsupervised learning or subregional analysis to explain intratumoral heterogeneity needs to be applied.
Imaging Genomics for Ubiquitously Expressed Biologic Features
Biologic Features of IDH Mutations.
IDH mutation in glioma is ubiquitously expressed in all tumor cells in the IDH-mutant type.16 In the World Health Organization (WHO) CNS5 edition published in 2021, secondary glioblastoma or IDH-mutant glioblastoma is no longer listed.16 Regardless of the histologic grade, tumors with IDH wild-type are now assigned as “(molecular) glioblastoma, IDH-wild-type, CNS grade grade 4.” Thus, distinguishing IDH-mutational status becomes more important because it is a strong prognostic factor for survival.17
Review of Current Analytic Methodologies.
Visual analysis of various imaging features has been shown to differ according to IDH1-mutation status as characterized by standardized imaging lexicons such as VASARI.18 In addition, the T2-FLAIR mismatch sign is a validated imaging sign for IDH-mutant status in patients with diffuse adult-type glioma, specifically in diffuse astrocytoma, IDH-mutant type without the 1p/19q codeletion. The T2-FLAIR mismatch sign is expressed in the entire tumor, which shows entirely homogeneous high signal intensity on T2-weighted images and low signal intensity in the internal portion on FLAIR images. The T2-FLAIR mismatch sign has been previously described in detail.19⇓-21 Imaging genomics clinicopathologic analysis suggests that the presence of tumor microcystic change is a causative etiology of FLAIR suppression.22 The positive predictive value of the T2-FLAIR mismatch sign for IDH-mutation status was 100% in retrospective cohort studies of diffuse adult-type gliomas.19,20 There are false-positives for the T2-FLAIR mismatch sign when it is observed in other tumors such as dysplastic embryogenic tumors23 and pilocytic astrocytoma.24 When a study design includes all gliomas, both the positive predictive value and specificity of the T2-FLAIR mismatch sign for IDH-mutation may decrease.
Advanced physiologic imaging has also been shown to predict IDH-mutation status such as DSC,25 dynamic contrast-enhancement (DCE),26 intravoxel incoherent motion (IVIM),26 and metabolic imaging such as amide proton transfer–weighted imaging.27 While CBF is not useful in distinguishing IDH-mutation status, the medians of the parameters derived from DSC and IVIM such as the CBV, microcirculation perfusion coefficient, and simplified perfusion fraction were lower in IDH-mutant gliomas.25 In addition, the median lower fractional volume of intravascular space using a distributed parameter model showed the highest diagnostic performance among DCE-derived parameters, including those based on the Tofts model.26 Such findings may support the lower vascularity, permeability, and flow in the tumor microenviroment of IDH-mutant gliomas due to resistance to neoangiogenesis by regulation of hypoxia-inducible factor α.28 In terms of chemical exchange saturation transfer (CEST) imaging metrics, the median amide/amine signal ratio and levels of amine signal differentiated IDH wild-type from the pooled IDH-mutant gliomas, supporting the relevance of tumor acidity in differentiating gliomas.27
Supervised learning approaches with radiomics features and deep learning features have been used to predict IDH-mutation status with multiparametric MR imaging.29 This approach often requires large, highly curated data sets. On the basis of the glioma The Cancer Genomic Atlas cohort, a prediction model of IDH-mutation status using multiple machine learning classifiers exhibited a preoperative accuracy of up to 88.9%.30 In terms of AI, use of convolutional neural networks has demonstrated an accuracy of 94% for IDH-1 mutation status and 92% for 1p/19q codeletion status.31
Proposed Analytic Methodology.
For ubiquitously expressed biologic features such as IDH mutations, a lesion-wide visual analytic approach that captures the whole tumor and provides direct and intuitive information is proposed. The ubiquitous expression of IDH mutations in all tumor cells negates the need to reflect intratumoral heterogeneity, making histogram or radiomics approaches excessive.
The T2-FLAIR mismatch sign, when applied appropriately, is a representative visual analytic approach that is simple to use and has been extensively validated in real-world clinical settings. For physiologic imaging, the median or mean values from physiologic imaging modalities including DSC, DCE, IVIM, and amide proton transfer–weighted imaging from the entire tumor ROI are suitable for analyzing this ubiquitous expression of genetic mutation. Supervised learning using high-dimensional imaging features to classify IDH-mutant tumors is feasible, but future research should be directed to proposing and validating a simple, visual, or statistical analytic approach that enables lesion-wide reflection of ubiquitously expressed biologic features.
Imaging Genomics for Subtypes with a Skewed Distribution
Intratumoral Heterogeneity of CDKN2A/B.
Certain molecular features of gliomas are characterized by fractional mutations or different subtypes of molecular alterations. CDKN2A/B is a tumor-suppressor gene that, when homozygously deleted, promotes biologic aggressiveness in IDH-mutant gliomas.32 In the WHO CNS classification published in 2021, a CDKN2A/B homozygous deletion results in a CNS WHO grade of 4 for IDH-mutant tumors, even without microvascular proliferation or necrosis.16 Thus, grading is no longer entirely histologic, and CDKN2A/B status becomes important. The percentage of cells with homozygous deletion across all IDH-mutant tumors is bimodal, with a median value of <10%.33 However, this distribution is skewed toward histologically high-grade tumors having >50% deletion.
Intertumoral Heterogeneity of Histone H3 Lysine 27-Altered Diffuse Midline Glioma.
Histone H3 lysine 27-altered diffuse midline glioma (H3K27-DMG) is a unique molecular subgroup that includes subtypes with an alternative mechanism for the loss of H3K27 trimethylation, such as additional somatic genetic alterations of receptor tyrosine kinases, cell cycle regulators, mediators of DNA repair, and/or phosphoinositide 3-kinase/protein kinase B/mammalian target of rapamycin signaling.34 The 2021 WHO classification adopted the revised designation “diffuse midline glioma, H3K27-altered” to include subtypes of diffuse midline glioma (DMG) with an alternative mechanism for the loss of H3K27 trimethylation. These include 4 subtypes of DMGs: 1) H3.3 p.K28M (K27M)-mutant, 2) H3.1 or 3.2 p.K28M (K27M)-mutant, 3) H3-wild-type with EZHIP overexpression, and 4) EGFR-mutant, which mainly includes bithalamic diffuse gliomas that present H3K27M or EZHIP overexpression together with strong enrichment in EGFR alterations. The H3K27-altered type is characterized by low intratumoral heterogeneity because the K27M-mutant variant causes a global reduction in levels of H3 lysine 27 trimethylation (H3K27me3).35 In addition, EZHIP overexpression results in H3K27me3 global reduction.36
Review of Current Analytic Methodologies.
There are a limited number of studies predicting CDKN2A/B status, and most have used supervised learning approaches.37,38 A recent study of imaging genomics for CDKN2A/B showed a trend toward an infiltrative pattern, a larger maximal diameter, and a higher value of the 95th percentile of normalized CBV being independent predictors of CDKN2A/B.39 Imaging features of CDKN2A/B deletion may overlap with those implying tumor aggressiveness.
For H3K27M-DMG, imaging features have been characterized by comparing the mean values or histogram parameters of ADC or relative CBV (rCBV).40,41 Imaging features of H3K27-altered tumors have various presentations (high intertumoral heterogeneity), but most tumors show relatively uniform signals (low intratumoral heterogeneity).42 Metabolic imaging with MRS has demonstrated significantly higher citrate and glutamine levels in H3K27-DMG tumors.43
Proposed Analytic Methodology.
For fractional mutation of CDKN2A/B, the proposed analytic methodology is histogram analysis. To depict intratumoral heterogeneity of CDKN2A/B, histogram parameters of skewness, kurtosis, and percentile values are useful. By means of radiomics, intratumoral heterogeneity can be captured, and CDKN2A/B can be diagnosed using supervised learning. Using the median or mean value derived from histograms of physiologic imaging biomarkers, imaging prediction of CDKN2A/B may be difficult because there is no clear technical cutoff, and IDH-mutant tumors evolve toward homozygous deletion across time.
For H3K27-altered DMG, the imaging features have various presentations (high intertumoral heterogeneity), but most tumors show relatively uniform signals (low intratumoral heterogeneity).42 Pattern-wise diagnosis is helpful to depict intertumoral heterogeneity of H3K27-altered DMG. Metabolic imaging with MRS has demonstrated significantly higher citrate and glutamine levels in H3K27-DMG tumors.43 On the basis of the low intratumoral heterogeneity of metabolic/cell signaling alterations, noninvasive metabolic imaging may provide a method for improved preoperative diagnosis of tumors with H3K27 alterations.
Imaging Genomics for Subtypes with Dynamic and Heterogeneous Biologic Features
Biologic Background of MGMT Methylation and EGFR-Mutation Status.
Some molecular features of gliomas have spatial and temporal heterogeneity with evolution of the mutational status with treatment. DNA promoter methylation of the MGMT gene is a clinically important feature that is predictive of temozolomide sensitivity, which is the standard-of-care chemotherapeutic agent used in the treatment of glioblastoma. Prior investigations have demonstrated MGMT methylation to be heterogeneous, with heterogeneity of methylation patterns across the MGMT 5′ CpG island, and capable of changing through the course of therapy.
EGFR amplification and EGFR variant III (EGFRvIII) mutations have both temporal and spatial heterogeneity. EGFRvIII mutations were detectable only in subclones of the tumor in EGFR amplification samples of individual patients, which suggested that EGFRvIII mutations are late events in tumor development.44 Heterogeneity of EGFRvIII has also been observed at the protein level. In contrast, wild-type EGFR expression is much more abundant and lacks the profound heterogeneity observed with EGFRvIII. This finding indicates that both the occurrence and disappearance of EGFR mutations are frequent processes that significantly contribute to tumor heterogeneity.
Review of Current Analytic Methodologies.
Radiomics and deep learning–based approaches involve the extraction of hundreds of quantitative features from images.4 Typically, machine-learning techniques are subsequently applied to the extracted radiomics features. These techniques use 2 main methods:45 1) dimensionality reduction and feature selection via unsupervised approaches, and 2) association analysis with ≥1 specific outcome via supervised approaches.
MGMT Promoter Methylation Status
Using supervised learning methods, numerous studies have assessed the correlation of conventional MR imaging features from T1-weighted, T2-weighted, FLAIR, and T1-weighted gadolinium contrast-enhanced (CE-T1WI) images with MGMT methylation status. Published studies have reported a wide range of predictive accuracy ranging from 60% to >80%.46⇓⇓-49 For dimensionality reduction and feature selection, algorithms such as maximum redundancy and maximum relevance46 or least absolute shrinkage and selection operator (LASSO) have been used. Fusion radiomics signatures determined by logistic regression modeling of single radiomics signatures selected from each sequence and habitat have been shown to predict survival.46 In particular, convolutional neural networks–based architectures have been validated or further developed with transfer learning to determine MGMT promoter methylation status.48,49
EGFR Amplification Status
Histogram analysis and supervised learning approaches (machine learning) with radiomics have been used to predict EGFR amplification in glioblastomas and have achieved a diagnostic accuracy of up to 78%.50⇓⇓-53 Measures such as the maximum rCBV, relative peak height, and percentage signal recovery from DSC have been correlated with EGFR mutation status.53 Logistic regression models with or without dimensionality reduction and feature selection via LASSO using conventional images such as T2WI, CE-T1WI, FLAIR, and DWI have been most commonly used.51,52
Proposed Analytic Methodology.
For genes exhibiting both spatial and temporal heterogeneity, unsupervised approaches to dimensionality reduction and feature selection are more beneficial than supervised approaches. The 2 most commonly used unsupervised approaches are cluster analysis and principal component analysis (PCA).2 Genomics data are often multidimensional. Cluster analysis is a method that sorts through genomics data and allows better visualization through heatmaps.54 A heatmap can readily display trends in data by simultaneously accounting for each dimension of the genomic data fed into the computational pipeline. PCA also explores multidimensional genomics data and determines the impact a specific dimension of the data has on variation in the data set as a whole. This process shows the likelihood of contribution from a specific attribute compared with the contributions of other dimensions in the data.55 Both cluster analysis and PCA allow the analysis of contributions from individual vectors within an extensive basis of vectors.
One good example of unsupervised learning for MGMT promoter methylation status is a study that used dimensionality reduction with unsupervised learning to account for the intra- and intertumoral heterogeneity of MGMT. By means of anatomic FLAIR and CE-T1WI features, K-means clustering of radiomics features obtained 3 distinct and reproducible imaging subtypes of glioblastoma with molecular characteristics, including MGMT promoter methylation status.47
For EGFR amplification status, unsupervised learning using regional information has been studied. Intratumoral heterogeneity can be depicted by conducting separate regional-based analyses of imaging biomarkers, including enhancing tumors, nonenhancing tumors, necrosis, and edema. In a multiparametric MR imaging and multisegmentation study, the spatial tumor pattern (location) and intensity distribution obtained from histograms of T2-FLAIR, ADC, and rCBV values were compared between EGFR variant III-positive (EGFRVIII+) versus EGFR variant III-negative (EGFRvIII−) tumors. EGFRvIII+ tumors displayed a higher rCBV, lower ADC, higher fractional anisotropy, lower T2-FLAIR, and a distinctive spatial pattern (Fig 3).56 EGFRvIII+ tumors had a more isotropic distribution of rCBV in enhancing and nonenhancing tumors and a low rCBV in perinecrotic tissue. This finding was observed with PCA of complex time-signal-intensity curves from DSC imaging of the peritumoral region.57 This unsupervised learning approach showed that EGFRvIII+ tumors had more homogeneity in time-signal-intensity curve–based features between immediate and distant peritumoral ROIs, while greater heterogeneity was observed in EGFRvIII tumors.

Illustration of the use of an unsupervised learning method and a subregional analysis to account for an EGFRvIII mutation. A, Histogram analysis of multiparametric MR imaging enables depiction of the differences between the EGFRvIII-mutant and wild group (reproduced with permission from Bakas et al57). B, For EGFRvIII-mutant tumors, there is no heterogeneity in the perfusion pattern distribution between the far and near ROIs, while there is considerable heterogeneity between the far and near ROIs for patients who have EGFRvIII– tumors (reproduced with permission from Akbari et al56).
PART 3: ADVANCING PERSONALIZED MEDICINE USING IMAGING GENOMICS AND RADIOMICS
The standard-of-care treatment for glioblastoma includes upfront maximal safe resection followed by concurrent radiation therapy and temozolomide and then adjuvant temozolomide.58 For patients with a good performance status, their treatment often includes the use of tumor-treating fields after concurrent chemoradiation. With this treatment paradigm, patients with glioblastoma have a median survival of 20.9 months.59 However, there is substantial variation in individual outcomes, with survival ranging from a few weeks to many years. Imaging genomics has demonstrated clinical feasibility in selecting subgroups of patients who are likely to benefit from specific therapies, including immunotherapies and targeted molecular therapies, and in improving our ability to assess treatment responses.
Surgery
Maximal safe surgical cytoreduction is unequivocally linked to improved clinical outcomes for patients with glioblastoma. However, the highly infiltrative growth pattern often leads to involvement of eloquent brain regions and challenges discerning areas with the highest risk of tumor recurrence. This feature makes achieving “negative” surgical margins difficult, if not impossible. Assessing tumor infiltration by using imaging genomics is an important issue and needs to be validated with spatial mapping. A colocalization study demonstrated imaging correlates of tumor infiltration using anatomic, perfusion, diffusion images and O-(2-[18F]-fluoroethyl)-L-tyrosine ([18F] FET) PET and subsequent multiregion stereotactic biopsies.14 In nonenhancing gliomas, FLAIR had the highest diagnostic accuracy. Recently, an optical imaging technique and fiber laser-based stimulated Raman histology showed the potential to noninvasively predict residual infiltrative glioma.60 This finding has the potential to assist in personalizing resection plans on the basis of the individual risk of local recurrence, while concurrently minimizing the risk of neurologic deficits and preserving function status. Although radiomics has begun to explore imaging correlates of tumor cellularity61 and the extent of infiltration,62 spatial mapping and colocalization are difficult to achieve for radiomics because this technique demonstrates heterogeneity and complexity, and spatial information is lost.
Temozolomide
Temozolomide is used in glioblastoma treatment alongside radiation therapy. However, response to this agent varies among patients and depends on individual tumor biology. Patients with methylated MGMT promoters show an enhanced response to temozolomide.9,10 Therefore, noninvasive determination of MGMT methylation status using imaging genomic applications can predict temozolomide sensitivity. Imaging genomics methodologies to assess MGMT promoter methylation have been previously discussed herein. Similarly, the gene telomerase reverse transcriptase (TERT), which is sometimes mutated in glioblastoma, impacts temozolomide and radiation sensitivity. A recent study created an optimized radiomics score using a LASSO regression model and multivariate analysis to predict TERT promoter mutations.63 This model, which combines the radscore with patient characteristics, demonstrated high prediction accuracy.
Radiation Therapy
Radiation, a standard treatment for glioblastoma and many gliomas, may be optimized through radiomics. A recent review article64 demonstrated that a radiomics-guided radiation therapy approach may aid radiation therapy planning by using radiomics volumetric signature maps and radiomics subvolumes. This approach would further enable personalization of radiation treatment plans based on patient-specific anatomic and tumor characteristics using radiomics. Radiomics and imaging genomics could offer novel biomarkers for variable inter- and intratumoral radiation sensitivity, guiding individualized dose/fractionation plans and dose painting across a tumor.
Immunotherapy
Immunotherapies, primarily targeting programmed cell death protein 1/programmed death-ligand 1, or anti-cytotoxic T-lymphocyte-associated protein 4, use the adaptive immune system against tumor cells. Unfortunately, these therapies have shown little benefit in improving survival of patients with glioblastoma to date. Two recently published international randomized Phase III trials evaluating the efficacy of adding nivolumab to the treatment of newly diagnosed glioblastoma with and without MGMT promoter methylation showed no benefit over the standard-of-care treatment.65,66 The ineffectiveness of immune checkpoint blockade in glioblastoma could be due to decreased CNS immune surveillance, low tumor mutation burden, poor BBB penetration, or insufficient immunologic response to glioblastomas. However, some glioblastoma subtypes may respond better to immune-modulating therapeutics. One randomized control study showed that patients who received neoadjuvant and/or adjuvant therapy with pembrolizumab had significantly extended overall survival among patients with recurrent glioblastoma.67 Imaging genomics and radiomics may provide insight into more immunogenic glioblastomas that could have heightened sensitivity to immune-modulating therapies. One imaging study used radiomics to characterize tumor macrophage infiltration within the tissue microenvironment, which plays a critical role in the tumor-immune interface.68 A recent review elaborated on how radiomics and imaging phenotypes correlate with the immune microenvironment of gliomas, their applications in immunotherapy era, and ongoing challenges in the field.69
PART 4: Potential POWERFUL IMAGING GENOMICS TOOL FOR ENABLING BOTH SPATIAL MAPPING AND DEPICTING HETEROGENEITY—TUMOR HABITAT ANALYSIS
When assessing the translational utility of imaging genomics to the previously discussed clinical diagnostic and treatment pathways, it is critically important at the methodologic level to account for the vast intratumoral heterogeneity that these tumors exhibit. Imaging analyses that use supervised learning with radiomics or deep learning features are limited for biologic validation for 3 reasons: First, the end point of the classifier is singular for radiomics using supervised learning, which does not consider any heterogeneity. Second, there is a danger of overfitting or overinterpreting the derived models for supervised learning.70 Third, radiomics depicts heterogeneity and complexity within a given ROI, in which any spatial information is lost. Pattern-wise analysis using unsupervised learning may reduce dimensionality and the risks of overfitting, but regional biologic validation is ultimately needed.70
Tumor habitat analysis uses spatially oriented “voxels.” Grouping “similar” voxels together (parcellation) may define multiple subregions with a common biology that respond differentially to therapy or drive progression.71 Parcellation methods include either an a priori assumption of a binary threshold, a geographic assumption, or a data-driven analysis using a clustering method. Tumor habitat analysis is in line with existing methods of imaging genomics, including subregions or subvolumes of a tumor or signature map. This method enables depiction of intratumoral heterogeneity similar to that of radiomics as well as spatial mapping and colocalization for further biologic validation. By means of subregions or subvolumes, tumor habitat analysis may guide imaging-guided treatment-planning and predict localization of tumor recurrence site. Below is a description of studies demonstrating use cases (specific situations or scenarios) of tumor habitat analysis are utilized.
Depiction of the Tumor Microenvironment Using Tumor Habitat Analysis
A data-driven analysis of clustering demonstrated tumor subregions with distinct biology and pathologic correlations with the tumor microenvironment (TME).71 Figure 4 explains the difference between radiomics-based supervised learning methods and voxelwise unsupervised learning (clustering) methods for tumor habitat analysis. These data-driven approaches have successfully distinguished viable tumors from nonviable tumors using multiparametric MR imaging and validated the method against H&E histology.72,73

Limitations of radiomics with supervised learning for explaining intratumoral heterogeneity. The TME interacts with genes, and subregions evolve and develop certain genomic mutations. Tumor habitat (subregional) analysis is an analytic method using voxelwise clustering of multiparametric MR imaging data that maintains the spatial information.
In glioblastoma, tumor habitat analysis using multiparametric MR imaging with diffusion-weighted and perfusion-weighted imaging has been conducted with a voxel-based clustering method.74 The process is assisted by deep learning–based segmentation, which enables reproducible tumor delineation, and the voxels containing physiologic information—the ADC reflecting cellularity and the rCBV reflecting vascular density—can be extracted within the ROI.
Potential Utility of Tumor Habitat Analysis
Virtual Biopsy and Radiogenomics.
Voxelwise clustering and tumor habitat analysis enable the establishment of distinct functional regions with spatial information and the spatial coregistration of the images and corresponding histologic findings.70 In breast cancer, multiparametric MR imaging habitat analysis and coregistered histology identified biologically validated subregions of hypoxia, necrosis, and other conditions.75 This result suggests the possibility that virtual biopsies can depict the most aggressive tumor portion of the glioma as well as help to predict genetic mutations under different TMEs. In terms of radiogenomics, tumor heterogeneity is shaped by both genetic differences and the local microenvironment.76 Due to differences in the tissue architecture and nutrient and oxygen levels, regional differences in the TME lead to different selection of subpopulation of tumor cells (clonal selection). For example, late development of EGFRvIII is correlated with a TME promoting anabolic metabolism in glioblastoma cells, leading to alterations in the levels of EGFRvIII expression.76 Depiction of tumor habitats based on hypoxic regions enables investigation of genetic/molecular alterations per subregion that may enhance the prediction of certain mutations.
Treatment Monitoring.
The most promising clinical application of tumor habitat analysis is assessing the treatment response.70 Temporal changes in the tumor habitat, the “spatiotemporal habitat,” occur during and after treatment with both spatial and temporal variation. Following treatment, outcomes can include tumor response, tumor progression, pseudoprogression, and radiation necrosis or other adverse effects of the anticancer therapies, all of which could be evaluated with habitat analysis.
Pseudoprogression
Pseudoprogression is thought to represent an inflammatory response to treatment but radiographically mimics tumor growth and thus poses a dilemma for the clinician when considering a treatment change or pursuing close surveillance. The feasibility of subregional analysis was shown in differentiating pseudoprogression on the basis of a voxelwise clustering method that exhibited better performance than the single parameters of the ADC or CBV.74 By means of spatiotemporal habitat analysis on the ADC and CBV, 3 spatial habitats of a hypervascular cellular (high CBV and low ADC), a hypovascular cellular (low CBV and low ADC), and a nonviable tissue habitat (low CBV and high ADC) were identified, and an increase in the hypervascular cellular (OR, 4.55, P = .002) and hypovascular cellular (OR, 1.22, P < .001) habitats was predictive of tumor progression.77
Prediction of Treatment Response
Spatiotemporal habitats also assist in monitoring treatment responses in patients with glioblastoma.77 On the basis of a spatiotemporal habitat analysis of the ADC and CBV, a short-term increase in the hypervascular cellular habitat (hazard ratio, 40.0; P = .001) and hypovascular cellular habitat was significantly associated with shorter progression-free survival (hazard ratio, 3.78; P < . 001) after concurrent chemoradiation therapy. Validation using a prospective cohort showed that an immediate increase in hypovascular cellular tumors after concurrent chemoradiation therapy was strongly associated with shorter progression-free survival.77
Comparative Assessment with Current Methodology.
By means of spatially oriented voxels and learning methods, tumor habitat analysis has the potential to become a powerful tool for imaging genomics. While traditional radiomics methods offer valuable insights into tumor heterogeneity, they often fail to account for spatial information, an area in which habitat analysis excels. Therefore, tumor habitat analysis is likely to be most beneficial for accurately distinguishing various intratumoral regions, thereby enhancing our ability to differentiate between viable and nonviable tumor areas as well as to discern treatment-induced changes such as pseudoprogression. However, comparisons with traditional radiomics methods indicate the need for further studies to establish the role of habitat analysis, because the specificity and sensitivity of the latter can be influenced by factors such as the choice of clustering methods, the quality of input imaging data, and the presence of overlapping imaging features. Despite these hurdles, its potential for improving therapeutic decision-making, predicting prognosis, and monitoring treatment response makes tumor habitat analysis a promising avenue in neuro-oncology.
PART 5. LIMITATIONS, CHALLENGES TO BE ADDRESSED, AND FUTURE OPPORTUNITIES
Imaging genomics is not aimed at replacing actual genomics. There are features that are only attainable through direct tissue analysis of genetic data and molecular characteristics that lack specific imaging features. Furthermore, imaging features overlap among high-grade gliomas with increased cellularity showing a low ADC and increased vascularity exhibiting a high rCBV. Nonetheless, imaging genomics is useful in patients with brainstem glioma or deep-located tumors in the pretreatment stage. With spatial mapping, imaging genomics can become a powerful noninvasive tool for guiding treatment and treatment monitoring. Surgery and radiation therapy can be guided by demonstrating an infiltrative tumor component. Timely and noninvasive diagnosis is possible for the posttreatment stage by enabling localization of viable tumor or tumor progression that requires subsequent treatment.
For future studies, different analytic approaches for biologic features that are ubiquitously expressed, demonstrate skewed distribution, or display temporal or spatial heterogeneity are proposed. Biologic validation, when possible and appropriate, should be encouraged, and analytic techniques such as molecular imaging and tumor habitat analysis that enable colocalization will prove promising.
CONCLUSIONS
Imaging genomics not only identifies genomic and molecular alterations noninvasively but also can help with prognostication, assessing and predicting tumor progression, and guiding therapy by spatial mapping and localization. In the pretreatment and diagnostic stage, different analytic approaches should be applied for imaging genomics. For ubiquitously expressed genomics features such as IDH-mutation status, a simple visual evaluation is sufficient. For skewed distribution or intra-/intertumoral heterogeneity including CDKN2A/B homozygous deletion or H3K27-altered status, histogram analysis of physiologic imaging biomarkers or radiomics with supervised learning methods are suitable. For dynamic alterations of MGMT promoter methylation or EGFR-mutation status, unsupervised learning of high-dimensional data is suitable. In the posttreatment stage, spatial mapping of imaging genomics has greater clinical implications through tumor habitat analysis to localize and predict tumor progression and guide therapy. Ultimately, colocalization of imaging genomics and actual pathology will improve this technique and broaden its utility in patients with glioma.
Acknowledgments
We thank Bethany Barajas, MSN, for her helpful comments regarding this article and the many wonderful patients who selflessly contribute their time to undergo research medical imaging while confronting a deadly disease.
Footnotes
↵# C.N. Kersch and M. Kim are co-first authors.
Ji Eun Park was supported by the National Research Foundation of Korea grant funded by the Korean government (grant No.: RS-2023-00305153) and Korea Health Technology R&D Project through the Korea Health Industry Development Institute, funded by the Ministry of Health & Welfare: HI22C0471. Ramon F. Barajas, Jr was supported by the National Institutes of Health, National Cancer Institute K08CA237809, KL2TR002370, and L30CA220897 and Jonathan D + Mark C. Lewis Foundation.
Disclosure forms provided by the authors are available with the full text and PDF of this article at www.ajnr.org.
References
- Received July 28, 2023.
- Accepted after revision November 9, 2023.
- © 2024 by American Journal of Neuroradiology


Jump to section
- Article
- Abstract
- ABBREVIATIONS:
- PART 1: METHODOLOGY OVERVIEW
- PART 2: ANALYTIC METHODOLOGY FOR DIFFERENT MOLECULAR FEATURES OF GLIOMAS
- PART 3: ADVANCING PERSONALIZED MEDICINE USING IMAGING GENOMICS AND RADIOMICS
- PART 4: Potential POWERFUL IMAGING GENOMICS TOOL FOR ENABLING BOTH SPATIAL MAPPING AND DEPICTING HETEROGENEITY—TUMOR HABITAT ANALYSIS
- PART 5. LIMITATIONS, CHALLENGES TO BE ADDRESSED, AND FUTURE OPPORTUNITIES
- CONCLUSIONS
- Acknowledgments
- Footnotes
- References
- Figures & Data
- Supplemental
- Info & Metrics
- Responses
- References
Related Articles
Cited By...
- No citing articles found.