
Article Figures & Data
Figures
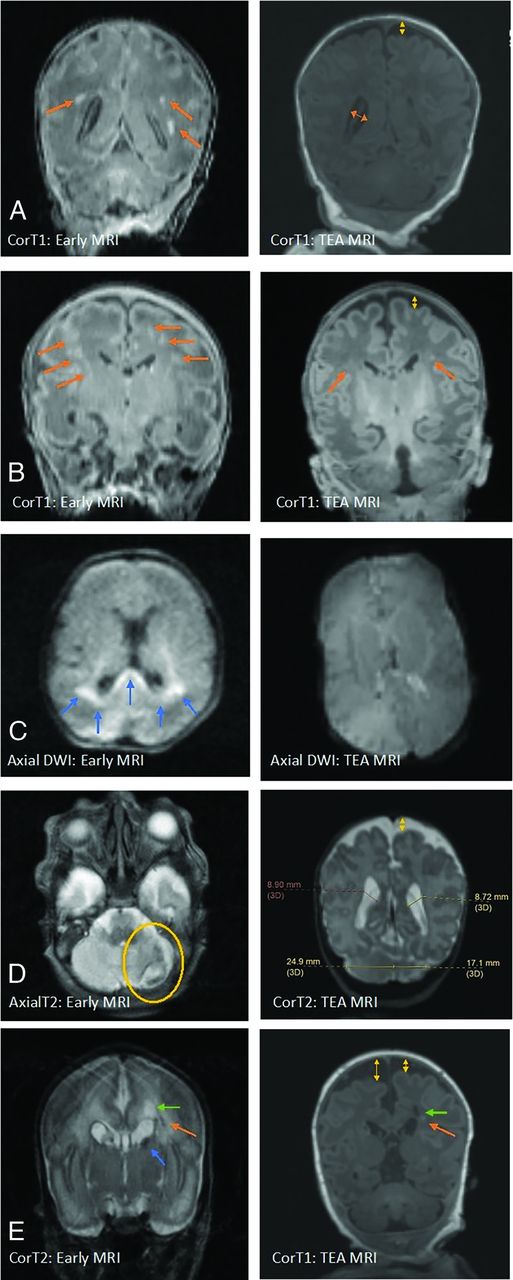
- FIG 1.
WMI as appreciated in early (1T scanner) versus TEA MR imaging (3T scanner) in different cases. A, The image on the left shows an early MR imaging and the extent of WMI (orange arrows) and its evolution at TEA (image on the right) in which there is an absence of visible WM lesions. WMI sequelae can be appreciated as volume loss, with arrows indicating a dilated ventricle and enlarged subarachnoid space (yellow arrow). B, Early T1 images show severe WMI (orange arrows) with reduced conspicuity at TEA but with some volume loss. C, Early MR imaging at day 3 of life shows diffusion restriction in WM (blue arrows), which has resolved at TEA. D, Isolated unilateral cerebellar hemorrhage (encircled in yellow) with eventual disparity in cerebellar hemispheric sizes and bilateral cerebral WM volume loss at TEA. E, Early IVH (blue arrow) with dilation resulting in periventricular WMI (orange arrows) with cyst formation (green arrows) and volume loss (yellow arrows) at TEA.
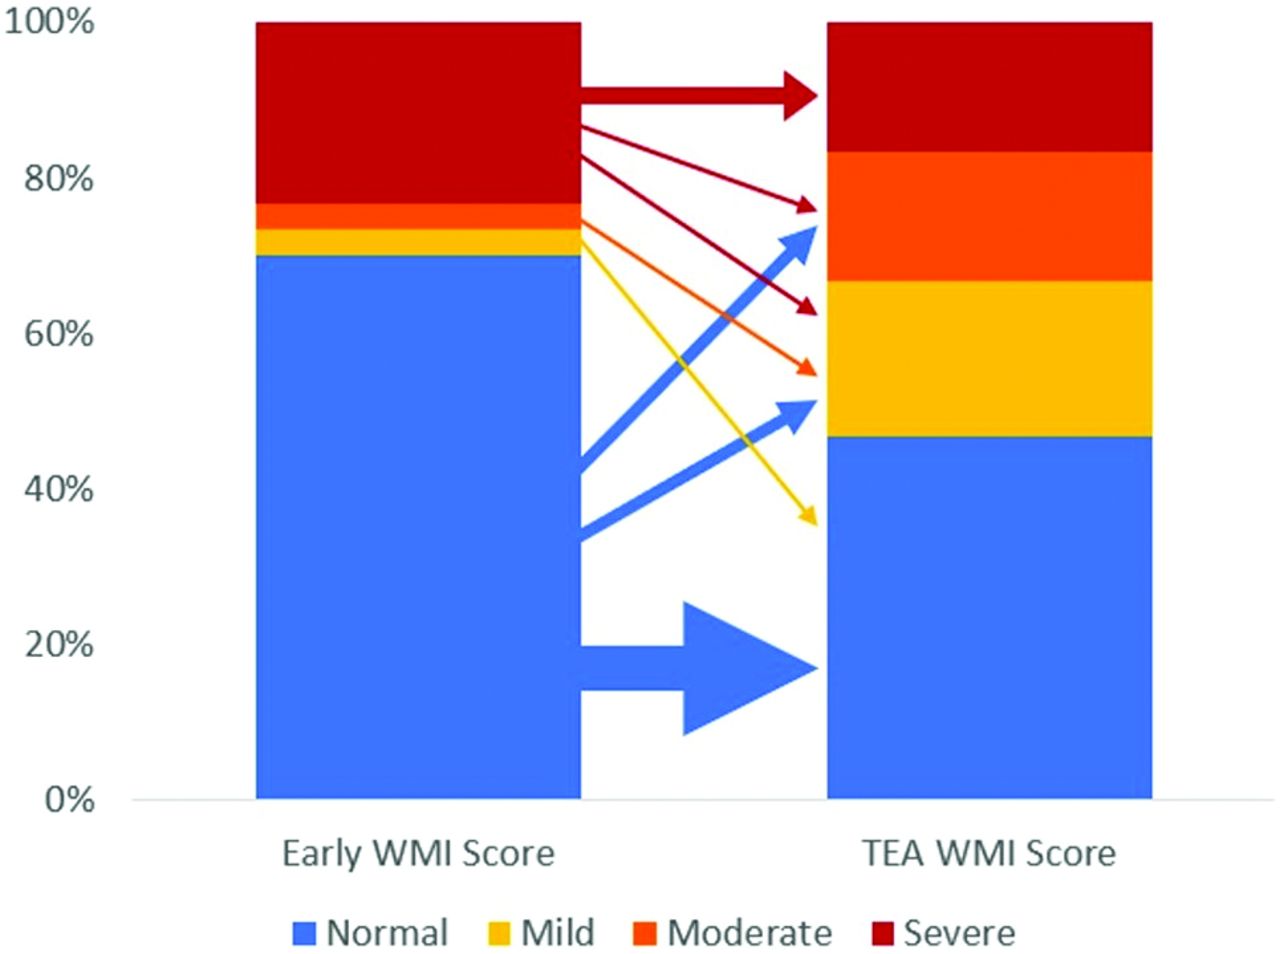
- FIG 2.
Evolution of WMI severity categories from early to TEA MRI. The thickness of arrows is proportional to the number of cases.


Tables
Study Participants (n = 30) Gestational age (mean) (SD) (wk) 28.7 (2.8) Male sex (No.) (%) 16 (53.3) Twin birth (No.) (%) 6 (20.0) Cesarean delivery (No.) (%) 16 (53.3) Birth weight (median) (range) (g) 1220 (515–1930) Birth weight z score (mean) (SD) 0.23 (0.98) Head circumference at birth (median) (range) (cm) 26 (20–31) Head circumference z score at birth (mean) (SD) 0.07 (1.06) WMI Severity on TEA MR Imaging Normal-Mild (n = 20) Moderate-Severe (n = 10) WMI severity on early MR imaging Normal-Minimal (n = 22) 18 4 Moderate-Severe (n = 8) 2 6 Global Severity on TEA MR Imaging Normal-Mild (n = 19) Moderate-Severe (n = 11) Global severity on early MR imaging Normal-Mild (n = 19) 18 1 Moderate-Severe (n = 11) 1 10


