
Abstract
BACKGROUND AND PURPOSE: Resting brain tissue perfusion in cerebral steno-occlusive vascular disease can be assessed by MR imaging using gadolinium-based susceptibility contrast agents. Recently, transient hypoxia-induced deoxyhemoglobin has been investigated as a noninvasive MR imaging contrast agent. Here we present a comparison of resting perfusion metrics using transient hypoxia-induced deoxyhemoglobin and gadolinium-based contrast agents in patients with known cerebrovascular steno-occlusive disease.
MATERIALS AND METHODS: Twelve patients with steno-occlusive disease underwent DSC MR imaging using a standard bolus of gadolinium-based contrast agent compared with transient hypoxia-induced deoxyhemoglobin generated in the lungs using an automated gas blender. A conventional multi-slice 2D gradient echo sequence was used to acquire the perfusion data and analyzed using a standard tracer kinetic model. MTT, relative CBF, and relative CBV maps were generated and compared between contrast agents.
RESULTS: The spatial distributions of the perfusion metrics generated with both contrast agents were consistent. Perfusion metrics in GM and WM were not statistically different except for WM MTT.
CONCLUSIONS: Cerebral perfusion metrics generated with noninvasive transient hypoxia-induced changes in deoxyhemoglobin are very similar to those generated using a gadolinium-based contrast agent in patients with cerebrovascular steno-occlusive disease.
ABBREVIATIONS:
- BOLD
- blood oxygen level–dependent
- CNR
- contrast-to-noise ratio
- ΔS
- BOLD signal change
- dOHb
- deoxyhemoglobin
- GBCA
- gadolinium-based contrast agents
- PETO2
- end-tidal partial pressure of oxygen
- PO2
- partial pressure of oxygen
- rCBF
- relative CBF
- rCBV
- relative CBV
- THx-dOHb
- transient hypoxia-induced deoxyhemoglobin
Angiography can characterize disease-related structural change in major cerebral arteries that can impede blood flow, but it has a limited ability to determine hemodynamic effects at the tissue level.1 However, DSC MR imaging can measure resting perfusion metrics such as MTT, relative CBF (rCBF), and relative CBV (rCBV) by tracing the passage of a susceptibility contrast agent through the cerebral vasculature.
Gadolinium-based contrast agents (GBCA) are commonly used because they are strongly paramagnetic and generate robust susceptibility signal changes. Nevertheless, possible long-term risks2,3 and measurement inaccuracies4,5 when using GBCA indicates the need for new alternative contrast agents.
Consequently, the paramagnetic properties of intrinsically generated changes in deoxyhemoglobin (dOHb)6 have recently been explored as an MR imaging contrast agent.7,8 Normally, breathing room air oxygenates the mixed venous blood, resulting in fully oxygenated blood returning in the pulmonary veins and into the systemic circulation. Reductions in dOHb in the arteries can be generated by administering a hypoxic inspired gas mixture. In this case, the mixed venous blood fails to fully oxygenate, allowing an increase in dOHb to pass into the arterial blood. Subsequent breathing of a normoxic gas mixture reoxygenates the hemoglobin in subsequent recirculation of the blood. The unsaturated blood generated during transient hypoxia acts as a transient change in susceptibility contrast with pharmacokinetics similar to that of injected GBCA7,9⇓-11 and thus lends itself to similar analysis for determining resting perfusion metrics. Indeed, in healthy volunteers, resting perfusion metrics generated with transient hypoxia-induced dOHb (THx-dOHb) have been shown to be similar in relative magnitudes and spatial distributions to those generated with GBCA.11
The aim of this study was to evaluate the feasibility of examining cerebral resting perfusion metrics with THx-dOHb in patients with steno-occlusive cerebrovascular disease by comparing the metrics with those measured with GBCA. We hypothesized that resting MTT, rCBF, and rCBV obtained using GBCA and THx-dOHb would be comparable in the GM and WM of each participant and will likewise be able to distinguish flow deficits between affected and unaffected vascular territories.
MATERIALS AND METHODS
Participant and Ethics Approval
This study conformed to the standards set by the latest revision of the Declaration of Helsinki and was approved by the Ethics Committee of the Canton of Zurich (KEK Nr. 2020–02314), Zurich, Switzerland. All participants provided written, informed consent to partake in this study. We recruited 12 participants between the ages of 37 and 84 years with known large-vessel steno-occlusive disease through the neurosurgery outpatient clinic at University Hospital Zurich, Zurich, Switzerland. Ten participants completed the full experimental protocol, and 2 patients withdrew from the study during MR imaging due to discomfort during hypoxia. The ages, sex, and clinical profiles of those who completed the study and their MRAs are available in the Online Supplemental Data.
Experimental Protocol
The MR images were acquired using a 3T scanner (Magnetom Skyra VD13; Siemens) with a 32-channel head coil. The protocol consisted of a high-resolution T1-weighted structural scan followed by 2 identical blood oxygen level–dependent (BOLD) perfusion sequence scans. A high-resolution 3D T1-weighted spoiled gradient-echo volumetric sequence was acquired with the following parameters: TI = 942 ms, TR = 2400 ms, TE = 3.62 ms, flip angle = 12°, 176 slices, voxel size = 1.0 × 1.0 × 1.0 mm. The BOLD sequences consisted of a multi-slice 2D gradient-echo perfusion sequence with the following parameters: TR = 1800 ms, TE = 30 ms, flip angle = 80°, 50 slices, voxel size = 2.5 × 2.5 × 2.5 mm. The first perfusion scan was acquired during end-tidal partial pressure of oxygen (PETO2) manipulation while the second scan was acquired at normoxia following an IV injection of gadoterate meglumine (Dotarem; Guerbet).
Respiratory Protocol
All inspired gas was provided by a computerized gas blender running a prospective protocol12,13 to control end-tidal partial pressure of O2 (PETO2) and CO2 independently of each other and of the pattern of breathing (RespirAct; Thornhill Medical). Patients breathed exclusively via a plastic face mask affixed to the face with skin tape (OpSite Flexifix; Smith & Nephew), making an airtight seal. The respiratory protocol consisted of a 60-second baseline PETO2 of 95 mm Hg (normoxia), followed by a switch to PETO2 of 40 mm Hg (hypoxia) for 60 seconds, and then a return to normoxia for 20 seconds, followed by repeat hypoxia for 60 seconds, followed by a return to normoxia (Fig 1A). Normocapnia was maintained throughout. After free breathing of room air for at least 5 minutes, gadoterate meglumine (0.1 mmol/kg) (Dotarem; Guerbet) was injected intravenously at a rate of 5 mL/s (with a baseline delay of 30 seconds before injection) followed by 30 mL of saline at a rate of 5 mL/s (Fig 1B).

The 2 BOLD signal (a.u.) waveforms in a voxel over the MCA versus time in a representative participant for Thx-dOHb (A) and GBCA (B). A.u. indicates arbitrary units.
Data Analysis Basics
The acquired BOLD images were volume-registered, slice-time corrected, and coregistered to the T1-weighted structural scans using Analysis of Functional Neuroimaging software (National Institutes of Health).14 The GBCA and THx-dOHb acquisitions were preprocessed in an identical manner to ensure that there was no bias toward any 1 scan. A 7-mm Gaussian spatial blur was applied to the data set. The T1-weighted structural scans were segmented into GM and WM and normalized to Montreal Neurological Institute coordinates using Statistical Parametric Mapping software (SPM8).15,16 The generated probability maps of GM and WM were thresholded at 70% probability. The MCA vascular territory was delineated manually on an anatomical Montreal Neurological Institute template (Online Supplemental Data). GM and WM masks were further divided into the left-hemisphere and right-hemisphere MCA.
Contrast-to-Noise Ratio and the BOLD Signal Change
The contrast-to-noise ratio (CNR) and BOLD signal change (ΔS) were calculated for GBCA and the THx-dOHb protocol, explained in additional detail by Poublanc et al.7 A 20-second continuous baseline signal at the beginning of each protocol was selected. A linear regression between the BOLD signal in each voxel and the average whole-brain signal ( , see below) as the regressor was calculated with the slope determining the percentage
  . The whole-brain average signal (
 was used as the regressor to ensure that both perfusion acquisitions could be compared, as summarized in Equation 1.

S is the scaled signal, α is the slope of the regression (parameter of interest),  is the 1-dimensional time-series regressor,
  is the temporal linear signal drift component,
  is the signal baseline, and
  represents the residuals.
By means of the slope of the regression (α), ΔS was calculated as follows:

Max ( and min (
 ) are, respectively, the minimum and maximum of the
  time-series.
The noise was determined as the SD of the residuals from the linear regression,  As shown in Equation 3, to obtain the CNR, we calculated the ratio of a signal difference (ΔS) to the noise.

The GM and WM average CNR and ΔS values were calculated for each participant.
Resting Perfusion Metrics
For this study, perfusion metrics for GBCA and THx-dOHb were calculated in an identical manner. A standard tracer kinetic model was used to calculate MTT and rCBV, shown in Equation 4 and explained in additional detail by Poublanc et al.7

We assumed a linear relationship between the perfusion signal and the concentration of GBCA and dOHb.  accounts for the signal drift,
 accounts for the baseline, and
  represents the residuals. For each contrast agent, the strongest signal change over the MCA was selected as the arterial input function (
 ). By means of a least-squares fitting procedure, rCBV and MTT metrics were determined. To account for the stronger signal decrease seen between GBCA and THx-dOHb during bolus transit through the vasculature, a scaling factor was needed to correct for this difference to compare rCBV maps. We used the ratio between the signal generated by GBCA and THx-dOHb as the scaling factor. The higher values obtained using GBCA were divided by the scaling factor rendering equivalence between GBCA and THx-dOHb.
By means of the central volume theorem, the rCBF was then calculated as rCBV/MTT.17 GM CBF is approximately 50 mL/100 g/min based on reliable measurements using PET,18 therefore, all participant CBF values were scaled by 50 arbitrary units on a voxelwise basis to obtain values within a familiar normative range. Perfusion metrics were overlayed onto their respective T1-weigthed structural images using Analysis of Functional Neuroimaging software (AFNI; http://afni.nimh.nih.gov/afni). Resting perfusion metrics were calculated in the supratentorial cortical GM and WM for GBCA and THx-dOHb. Resting perfusion metrics in GM and WM of each cerebral hemisphere were calculated using the previously created MCA vascular territory mask.
Statistical Analysis
The CNR, ΔS, calculated perfusion metrics, and their ratios of affected and unaffected vascular territories in GM and WM were compared between GBCA and THx-dOHb using a Wilcoxon matched-pairs signed-rank test (Prism 9 software; GraphPad). Using the calculated GM and WM averages, Bland-Altman plots were generated (Prism software; GraphPad).
RESULTS
Signal Comparison
The CNR and ΔS for GM and WM are presented in the Table. The GBCA signal was 4.41 times stronger in GM (P = .002) and 5.15 times stronger in WM (P = .002) than the THx-dOHb signal. However, the GBCA CNR was only 1.77 greater in GM (P = .004) and 1.27 times greater in WM (P = .002) than the THx-dOHb CNR.
Average measures of ΔS in percentages and the CNR calculated for GBCA and THx-dOHb for the 10 participants
Comparison of Resting Perfusion Metrics in GM and WM
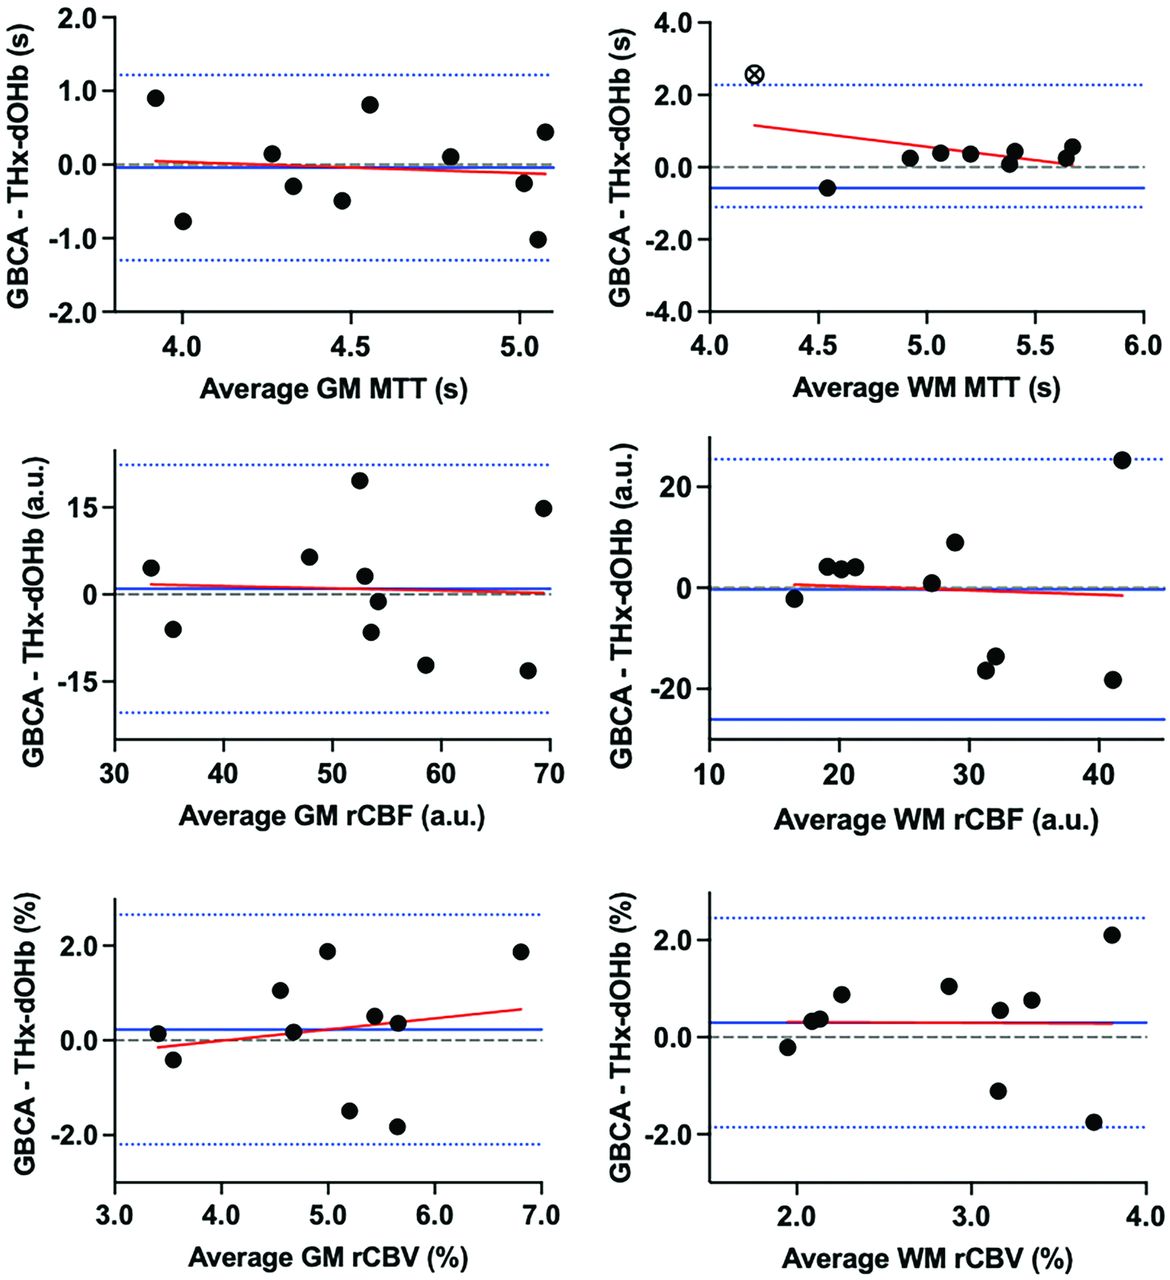
A summary of perfusion metrics between GBCA and THx-dOHb are presented in the Online Supplemental Data. A Wilcoxon matched-pairs signed-rank test did not show statistically significant differences in resting perfusion metrics between GBCA and THx-dOHb in GM or WM (P > .05), except for WM MTT (P < .05) (Online Supplemental Data). Bland-Altman plots comparing the perfusion metrics from the GBCA and THx-dOHb are presented in Fig 2. A summary of the Bland-Altman plot analysis is presented in the Online Supplemental Data. The plots have negligible constant bias or proportional bias between techniques, except for WM MTT (Online Supplemental Data).

Bland-Altman plots comparing GBCA and THx-dOHb differences for perfusion metrics MTT, rCBF, and rCBV in GM and WM. The solid blue line depicts the mean, the dotted blue lines represent the 95% limits of agreement, and the red line represents the regression line.
Comparison of Resting Perfusion Metrics in Affected and Unaffected Hemispheres
Of the 10 participants who completed the study, 8 had unilateral steno-occlusive disease, while 2 had bilateral lesions. The images of those with unilateral disease were divided into affected-versus-unaffected hemispheres. Figure 3 shows the line plots of MTT, rCBF, and rCBV in the affected and unaffected hemispheres in MCA GM and WM calculated using GBCA and THx-dOHb. The trends of hemodynamic metrics between hemispheres were very similar for both contrast agents. We compared the ratios of the affected and unaffected hemispheres in GM and WM between GBCA and THx-dOHb (Online Supplemental Data). A Wilcoxon matched-pairs signed-rank test did not show a statistically significant difference in the ratios of affected and unaffected hemispheres between GBCA and THx-dOHb in GM or WM for all metrics (P > .05), except for WM rCBV (Online Supplemental Data).

The affected-versus-nonaffected hemispheric perfusion metrics for GBCA and THx-dOHb for 8 participants who have unilateral steno-occlusive disease (patients 6 and 7 have bilateral disease and were excluded) in the MCA in the GM (on the right) and WM (on the left). The trends of affected-versus-unaffected hemispheres across both techniques are comparable. a.u. indicates arbitrary units.
Resting Perfusion Maps
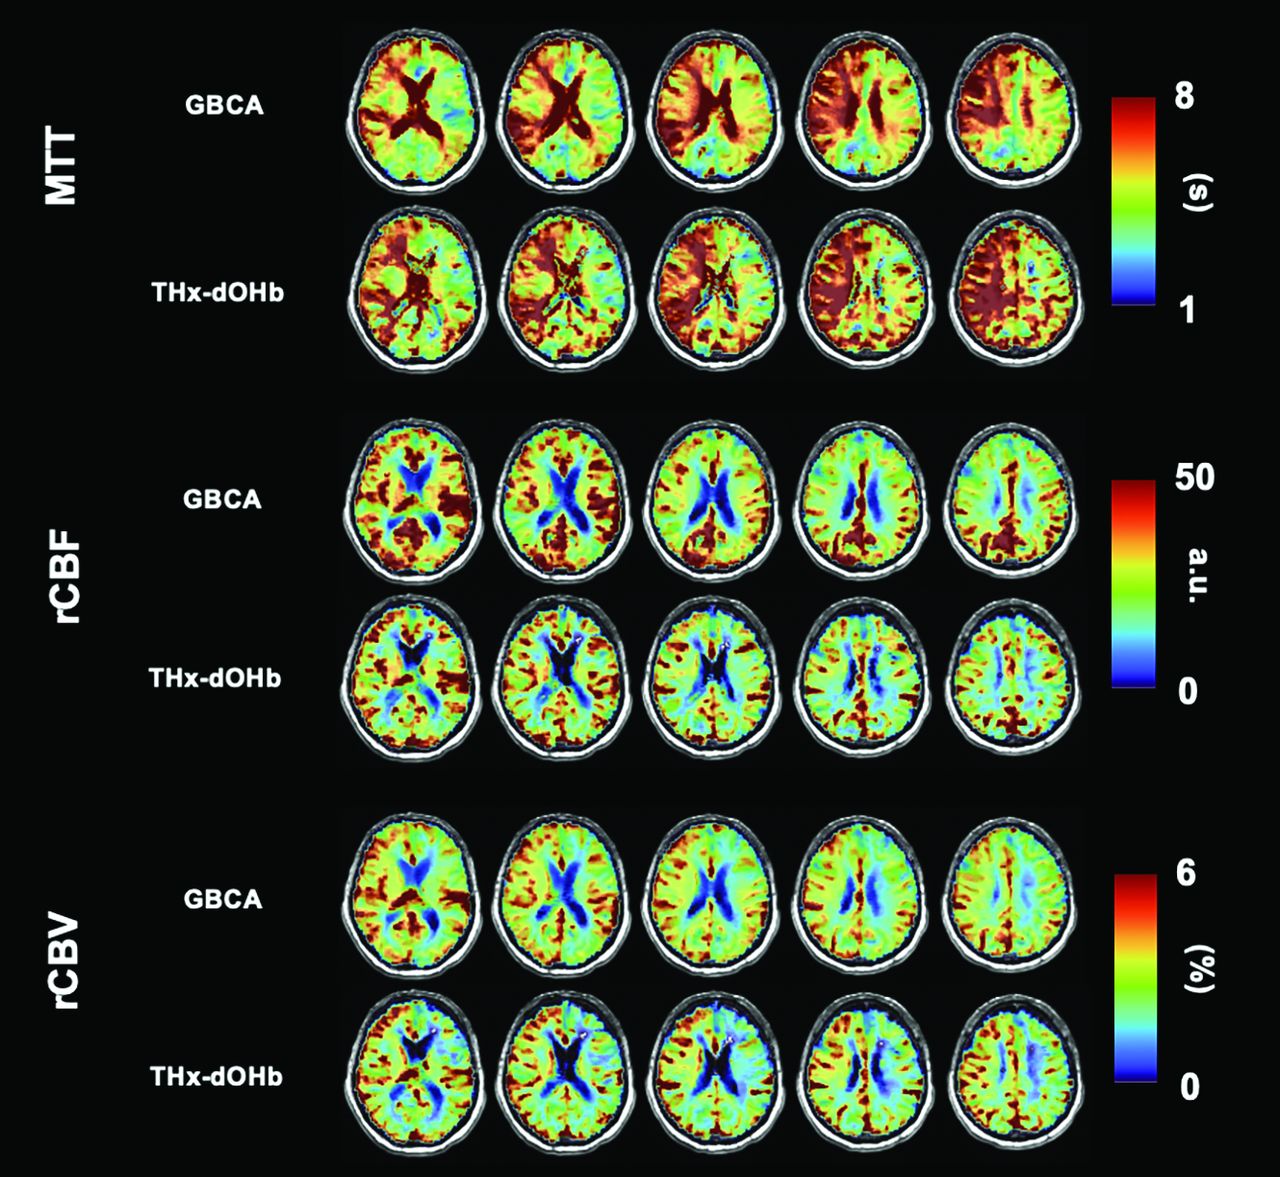
Figure 4 shows perfusion maps for a representative participant (ID 1 as found in the Online Supplemental Data). This patient had a right ICA occlusion that led to a right ischemic stroke. The MTT, rCBF, and rCBV maps for the acquired images using GBCA and THx-dOHb have a high spatial similarity showing delayed MTT, slightly lower CBF, and higher CBV in the affected right hemisphere.

Perfusion maps of MTT, rCBF, and rCBV of a 71-year-old male participant (ID 1) with a right ICA occlusion comparing GBCA (A) and THx-dOHb (B). a.u. indicates arbitrary units.
DISCUSSION
Main Findings
Resting cerebral perfusion metrics in patients with cerebrovascular steno-occlusive disease calculated with THx-dOHb contrast were similar to those generated with GBCA. In particular, the spatial distributions of the respective perfusion metrics MTT, rCBF, and rCBV were similar in both GM and WM. Both contrast agents were also similar, enabling the discrimination between the affected and the unaffected hemispheres. Furthermore, the distributions of hemodynamic metrics between hemispheres were consistent with the locations of large-vessel pathology. We note that to eliminate any methodological, temporal, and disease variability, each participant was used as his or her own control. These findings, therefore, show that resting perfusion metrics obtained noninvasively with THx-dOHb can be of clinical value, particularly after considering the benefits and risks compared with GBCA.
Summary of Findings
Perfusion metrics MTT, rCBF, and rCBV were compared between GBCA and THx-dOHb in GM and WM. The perfusion metrics generated using the 2 contrast agents were not significantly different from one another, except for WM MTT. The WM MTT for THx-dOHb was significantly lower in comparison with GBCA (P < .05). Nevertheless, the individual participant perfusion maps are spatially very similar. Indeed, the results from the Bland-Altman plot analysis showed that the average discrepancy (constant bias) between the two agents is small for all perfusion metrics, with a narrow confidence interval, except for a constant bias for WM MTT in which the GBCA MTT is consistently greater than THx-dOHb. Furthermore, the differences between perfusion metrics in GM or WM have no proportional bias, with the slope of the regression line not significantly different from zero. The ratio of affected and unaffected hemispheres were the same for all subjects, with each contrast except for WM rCBV.
We suggest that these findings support the continued exploration of THx-dOHb for DSC imaging as (i) there is high agreement between metrics obtained using DSC imaging with GBCA and (ii) THx-dOHb is able to discriminate between affected and unaffected hemispheres in patients with steno-occlusive disease.
Advances over Current Knowledge
This study in patients with steno-occlusive disease follows previous investigations that demonstrated the utility of THx-dOHb as a contrast agent. Poublanc et al7 were the first to use THx-dOHb to calculate and map voxelwise resting perfusion metrics. The investigators applied sequential gas delivery13 and prospective end-tidal gas targeting12 to generate abrupt transient isocapnic reductions in oxygen, to create pharmacokinetic profiles with dOHb that are similar to those obtained from an intravascular injection of GBCA, thereby enabling a similar approach to the calculation of perfusion metrics. Subsequently Sayin et al11 found that the perfusion metrics generated by the 2 contrast agents were similar when assessed in the same healthy individuals. In this study, we extended these observations to show similarity in pattern as well as in the interpretation of perfusion metrics in patients with cerebrovascular pathology in the form of steno-occlusive disease.
THx-dOHb has several advantages over GBCAs as a contrast agent for DSC MR imaging. GBCA is an intravascular extracellular molecule. It can leak into the interstitial fluid19 in pathologic conditions when the BBB is disrupted and, therefore, requires leakage correction. By contrast, due to dOHb being contained in red cells, it remains intravascular regardless of the state of the BBB. This capacity may be a particularly useful advantage when the BBB is disrupted, provided that there is no active bleeding.20 Furthermore, the analysis of the signal generated by GBCA can be affected during a second pass through the circulation, which will not occur with THx-dOHb unless there is a right-to-left cardiopulmonary shunt. On the contrary, THx-dOHb is cleared within 1 blood circulation time following pulmonary reoxygenation, enabling repeat measures as required. THx-dOHb may also be a suitable alternative contrast for patients with renal insufficiency who are at risk of nephrogenic systemic fibrosis if exposed to GBCA or at risk of worsening of renal function if exposed to iodinated contrast used for CTP.
During the past decade, there has been a drive to develop noninvasive techniques that are capable of identifying vascular dysfunction in individuals who are at risk. Arterial spin-labeling is a noninvasive MR imaging technique that provides quantitative measures of CBF. However, this technique has sensitivity to transit times and long collateral flow pathways associated with advanced cerebrovascular disease.21⇓-23 Currently, the only clinical standard for assessing perfusion metrics in patients with cerebrovascular steno-occlusive disease is DSC imaging with GBCA. However, future work comparing CBF measured via Thx-dOHb with arterial spin-labeling may be beneficial.
Bolus Profile Comparison
The stimulus profile we used in this study was chosen to be consistent with its antecedent studies. The arterial input function profile of THx-dOHb differs from that of GBCA by having 2 susceptibility oxygen desaturations (Fig 1). Due to the strong paramagnetic properties of GBCA and the rapid IV injection, GBCA causes a very sharp decrease in the BOLD signal. In contrast, the rate of dOHb formation is limited by the rate of deoxygenation in the lungs. This process is one of breath-by-breath dilution of the oxygen in the lungs, over about 5–7 breaths taking about 20 seconds. Thus, the THx-dOHb performed a double 60-second hypoxic exposure targeting partial pressure of oxygen (PO2) of 40 mmHg to improve the CNR. Previous studies have determined that the CNR increased marginally with repeat hypoxic stimuli. Although the susceptibility profiles of GBCA and Thx-dOHb differ, the arterial input functions can be used for both agents for the calculation of the respective perfusion metrics.7,11 Nevertheless, further changes in the hypoxic exposure profile may be considered for implementing strategies to shorten the time to reach target hypoxia.
Limitations
The tolerance of hypoxia in humans has been well-established. In formal studies, participants maintained a PO2 at about 50 mm Hg for >20 minutes.24⇓-26 In another study, a PO2 of 55 mm Hg was maintained for 8 hours.27 Hypoxia is experienced continuously by the millions who live at high altitudes, especially those with severe lung and heart disease, and intermittently by hundreds of millions throughout the world who have multiple episodes of obstructive sleep apnea nightly. Indeed, extended periods of intermittent hypoxia have even shown benefits of preconditioning against myocardial infarction,28,29 heart failure,30 hypertension,30,31 and cognitive decline.32
There is likely a range of sensitivity to hypoxia in humans and a range of its tolerability. In this study, 2 of 12 patients did not tolerate the hypoxia and aborted their study. Both participants who aborted the study did so during the second hypoxic exposure. It is possible that the low tolerance for hypoxia was related to the severity of the perfusion limitation, though there are no indications of this effect in people with severe steno-occlusive disease living at high altitudes or with concomitant severe pulmonary disease or severe, prolonged obstructive sleep apnea.
Another limitation of THx-dOHb is the issue of CBF increase in response to hypoxia, which could confound the measurement of perfusion metrics. Ellingsen et al33 had reported that a normocapnic reduction of PO2 to 65 mm Hg resulted in an increase in carotid artery blood flow velocity over a period of about 10 minutes with a halftime of about 4 minutes. More recently, Harris et al24 used pulsed arterial spin-labeling to measure the delay and time constant of a CBF increase in response to acute hypoxia. They found a delay to onset of flow change of about 3 minutes with a time constant of about 4.5 minutes. The duration of our hypoxic stimuli was only 60 seconds, repeated twice. However, the precise kinetics of CBF responses to acute severe hypoxia have not been rigorously documented.34 If acute hyperemic responses do occur, reducing the extent of hypoxia or shortening the hypoxic interval may be feasible. These measures would also increase the tolerability of hypoxia.7,35,36 A further limitation may occur in areas of misery perfusion in which blood flow is low and the oxygen extraction fraction is high, resulting in a high baseline concentration of dOHb. With the initiation of THx-dOHb, the arterial oxygen delivery is further reduced, resulting in an exaggerated fall in the BOLD signal, perhaps marking the area of misery perfusion.
The presence of steno-occlusive disease or cerebral ischemia may itself result in dispersion of the bolus of contrast37 and difficulty in accurately applying the input function. There are numerous ways to analyze perfusion data including, but not limited to, adopting a mono-/biexponential model from pharmacokinetics,38 or using a vascular model39 or a singular value decomposition.40 However, these deconvolution techniques do not account for dispersion. For that, a complex model for the vasculature is required.41 When there is no correction for contrast dispersion, caution should be used in interpreting the calculated MTT, rCBF, and rCBV metrics from either contrast. Similarly, if such peripheral late dispersion does exist, the deconvolution model would be equally offset with both GBCA and THx-dOHb profiles.
CONCLUSIONS
Cerebral perfusion metrics, including MTT, rCBF, and rCBV, using the novel contrast agent THx-dOHb show high spatial and scalar congruence with those generated by GBCA in subjects with known cerebrovascular steno-occlusive disease. In selected patients, THx-dOHb has the advantages of being needle-free and suitable for unlimited repeat examinations. These findings support the continued investigation of THx-dOHb as a noninvasive endogenous contrast agent to obtain cerebral perfusion metrics.
ACKNOWLEDGMENTS
All the authors thank University Hospital Zurich MR technologist Maria Sarioglou for all her help in acquiring the MR imaging data.
Footnotes
Disclosure forms provided by the authors are available with the full text and PDF of this article at www.ajnr.org.
Indicates open access to non-subscribers at www.ajnr.org
References
- Received July 21, 2023.
- Accepted after revision November 1, 2023.
- © 2024 by American Journal of Neuroradiology


