
Abstract
BACKGROUND AND PURPOSE: Untreated unruptured intracranial aneurysms are usually followed radiologically to detect aneurysm growth, which is associated with increased rupture risk. The ideal aneurysm size cutoff for defining growth remains unclear and also whether change in morphology should be part of the definition. We investigated the relationship between change in aneurysm size and 3D quantified morphologic changes during follow-up.
MATERIALS AND METHODS: We performed 3D morphology measurements of unruptured intracranial aneurysms on baseline and follow-up TOF-MRAs. Morphology measurements included surface area, compactness, elongation, flatness, sphericity, shape index, and curvedness. We investigated the relation between morphologic change between baseline and follow-up scans and unruptured intracranial aneurysm growth, with 2D and 3D growth defined as a continuous variable (correlation statistics) and a categoric variable (t test statistics). Categoric growth was defined as ≥1-mm increase in 2D length or width. We assessed unruptured intracranial aneurysms that changed in morphology and the proportion of growing and nongrowing unruptured intracranial aneurysms with statistically significant morphologic change.
RESULTS: We included 113 patients with 127 unruptured intracranial aneurysms. Continuous growth of unruptured intracranial aneurysms was related to an increase in surface area and flatness and a decrease in the shape index and curvedness. In 15 growing unruptured intracranial aneurysms (12%), curvedness changed significantly compared with nongrowing unruptured intracranial aneurysms. Of the 112 nongrowing unruptured intracranial aneurysms, 10 (9%) changed significantly in morphology (flatness, shape index, and curvedness).
CONCLUSIONS: Growing unruptured intracranial aneurysms show morphologic change. However, nearly 10% of nongrowing unruptured intracranial aneurysms change in morphology, suggesting that they could be unstable. Future studies should investigate the best growth definition including morphologic change and size to predict aneurysm rupture.
ABBREVIATIONS:
- IBSI
- Image Biomarker Standardization Initiative
- UIA
- unruptured intracranial aneurysm
In management decisions on unruptured intracranial aneurysms (UIAs), the risk of rupture needs to be balanced against the risk of treatment complications.1 UIAs often remain untreated if the risk of treatment complications is higher than the risk of rupture.2,3 In that case, UIAs can be monitored with follow-up imaging to detect potential aneurysmal growth, which is associated with an increased risk of rupture.4 If aneurysmal growth is detected, preventive aneurysm treatment should be reconsidered.
Substantial heterogeneity exists in the definition of UIA growth.5-7 Generally, the definition of growth includes a certain increase in aneurysm size and/or any morphologic change.8 Currently, it remains unclear which definition is most relevant and how morphologic changes relate to any change in aneurysmal size. UIA size and morphology are currently assessed with caliper measurements and visual classification by human observers, which can be prone to measurement errors and poor reproducibility.9,10 3D volumetric segmentations of UIAs enable reproducible and reliable quantification and analysis of UIA volume, morphology, and assessment of changes in morphology.5,11,12 The recent Image Biomarker Standardization Initiative (IBSI)13 has been developed to standardize quantitative radiomics extracted from medical imaging, including morphology measurements.
3D quantified morphology measurements of UIAs14,15 are more frequently used to better understand growing and unstable UIAs. Previous studies have investigated difference in morphology in growing UIAs14,16 and morphology as a predictor of UIA instability.17 However, no studies have investigated morphologic changes in stable or nongrowing aneurysms. Furthermore, various different morphology measurements are used, making it difficult to make direct comparisons between studies.
More investigation is warranted into both growing and nongrowing (stable) UIAs to understand the relationship between growth and morphologic change of UIAs using standardized morphology definitions.
This study aimed to investigate the relationship between UIA growth and morphologic change by considering continuous and categoric (dichotomous) 2D and 3D growth of growing and nongrowing UIAs.
MATERIALS AND METHODS
Study Population
From the UIA data base of the University Medical Center Utrecht, the Netherlands, we included consecutive patients of ≥18 years of age who adhered to the following inclusion criteria: 1) at least 1 saccular UIA; 2) a 3D TOF-MRA available both at the baseline admission scan and at follow-up in the period 2004–2020; and 3) the interval between the baseline scan and follow-up scan was at least 6 months. Exclusion criteria were the following: 1) fusiform or arteriovenous malformation–related aneurysm; and 2) aneurysm rupture or preventive treatment between baseline and the first follow-up scan. For each patient, we assessed both a baseline and the most recent follow-up TOF-MRA scan for the analysis. All scans were obtained between 2004 and 2020. Due to the time period, protocols varied, but either a 1T, 1.5T, or 3T scanner was used with a median TR of 23 ms and a median TE of 4 ms across all scans. The scans had a median in-plane resolution range of 0.357 mm and a median section thickness range of 0.5 mm. All scans were preprocessed and resampled to the same voxel size (0.357 × 0.357 × 0.500 mm) to account for scan protocol differences. The institutional review board of the University Medical Center Utrecht waived individual patient consent and formal ethics approval for this study because data available from routine patient care were used.
Measurements
2D Measurements.
2D measurements of the UIAs in all scans were performed manually on the IntelliSpace Portal (Philips Healthcare) by an experienced neuroradiologist (I.C.v.d.S.). The UIA length and width were measured on the TOF-MRAs on a 0.1-mm scale using electronic calipers.6,18 UIA length was defined as the maximum distance from the UIA neck to the UIA dome. UIA width was measured perpendicular to the measured length along the maximum width of the UIA. Individual length and width measurements were made on both the baseline and follow-up scans. 2D length and width changes were determined as the difference in the 2D length and width measurements between the follow-up and baseline scans of the same UIA of the same patient.
3D Measurements.
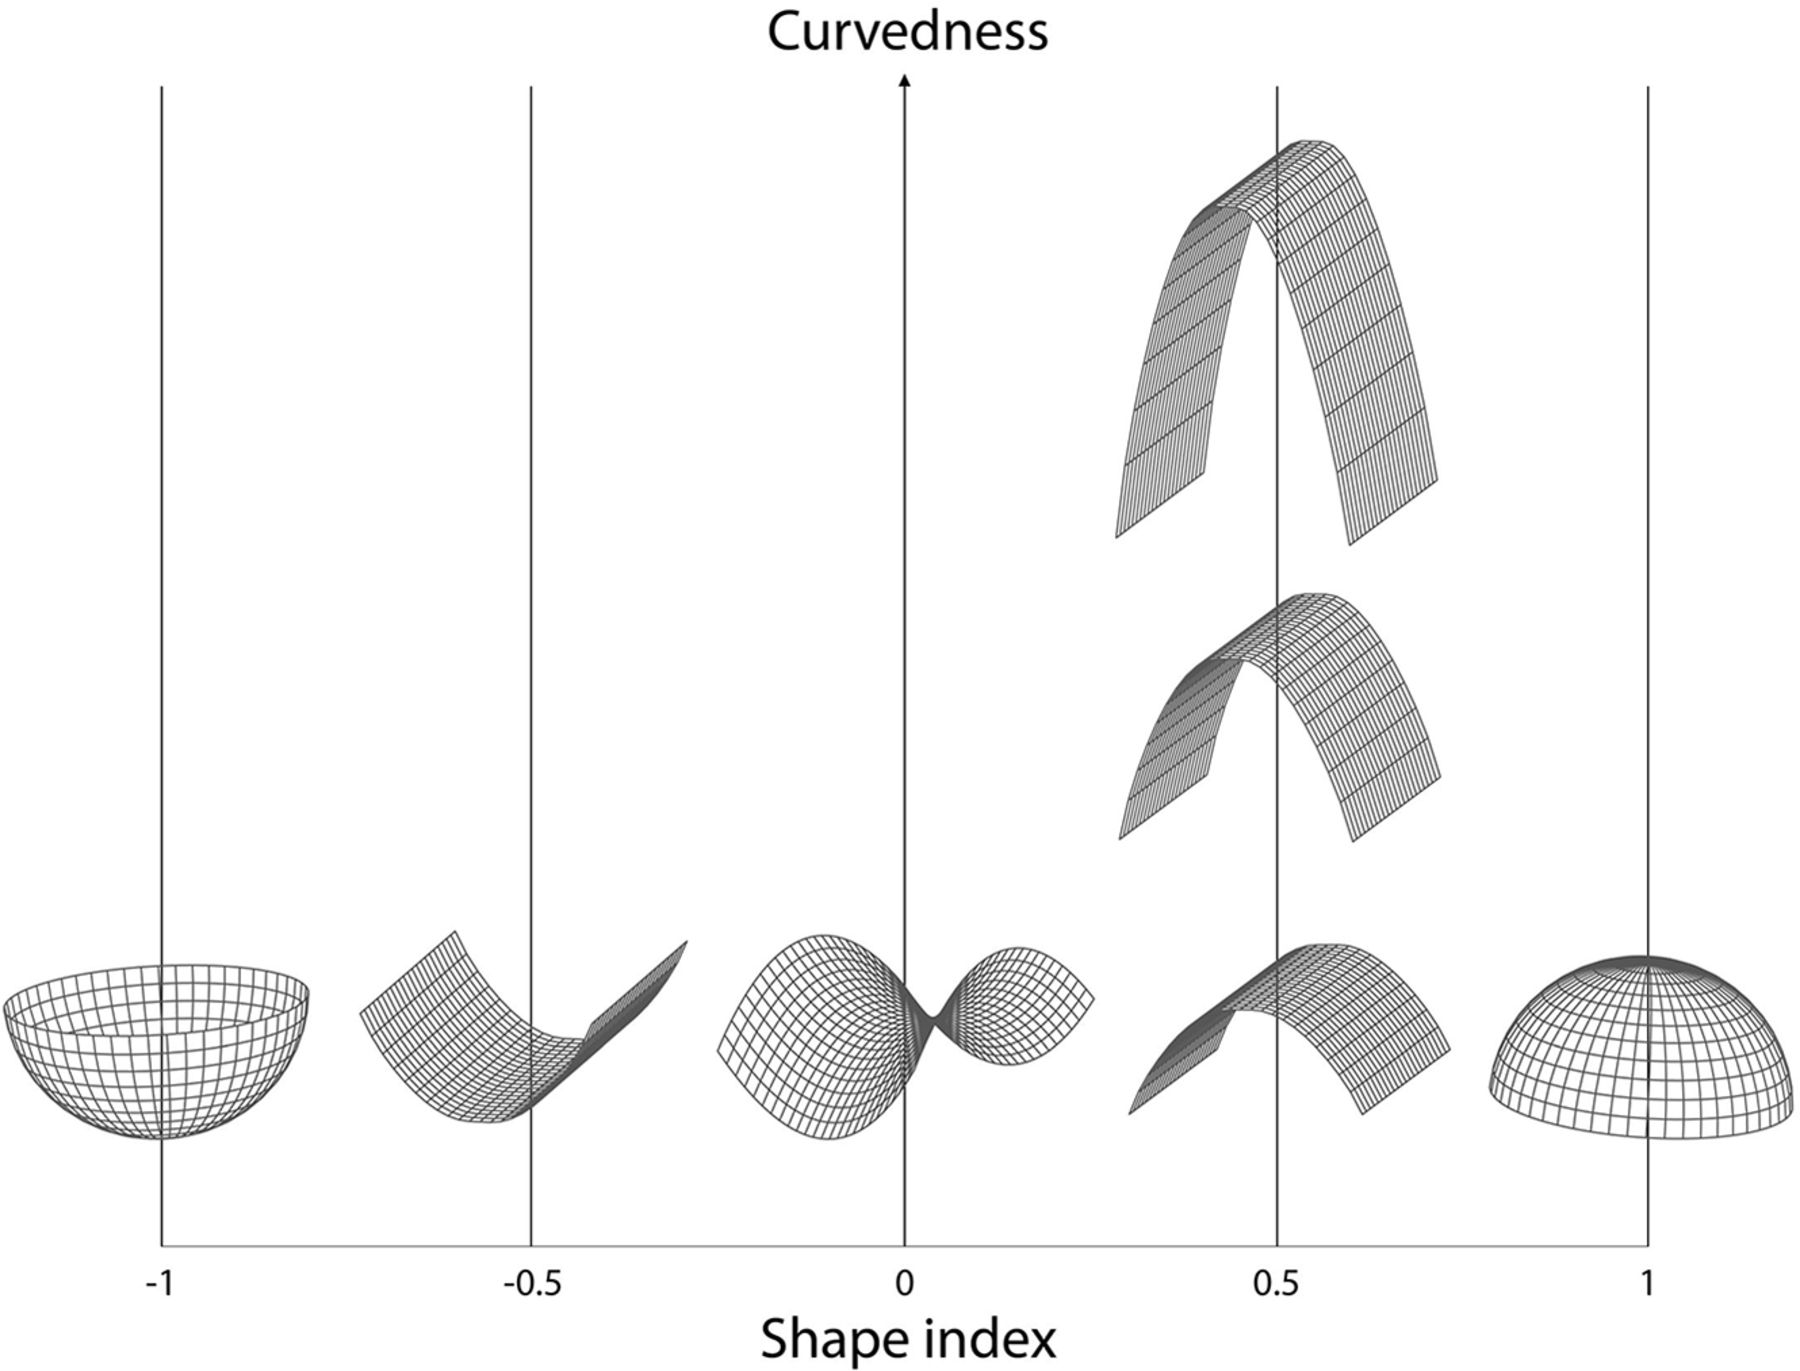
To make 3D quantified morphology measurements of the UIAs, we manually segmented the UIAs from the original TOF-MRAs using in-house-developed software implemented in MeVisLab (MeVis Medical Solutions). All annotations were made by drawing a contour around the UIA on axial slices of the original TOF-MRA by the neuroradiologist who made the 2D measurements. The annotation did not include the parent vessels. Annotations were first made on the baseline scan, followed by the follow-up scan of the same patient. The annotations were converted to binary masks in which voxels that were located >50% inside the contour were labeled as UIAs. The images and annotations were all resampled to the median voxel size of 0.357 × 0.357× 0.500 mm. Using a marching cubes algorithm,19 we automatically fitted a mesh to the outside of the segmented UIA. The volume and surface area of the UIA were determined on the basis of the mesh around the segmented UIA. 3D volume change was determined as the difference in volume between the follow-up and baseline scans. The size of the UIA was determined by performing principal component analysis on the voxels within the segmented UIA and calculating the major, minor, and least extent. From these values, various morphology measurements were calculated on the basis of definitions in accordance with the IBSI guidelines,13 including compactness 1, compactness 2, elongation, flatness, and sphericity. Compactness 1 and 2 and sphericity are different measures that all quantify how similar the morphology of the UIA is to a sphere. Elongation describes the eccentricity of the UIA by describing how long it is relative to its width. Flatness quantifies the amount the UIA is flat relative to the length. Next, on the basis of the generated 3D mesh, the mean and Gaussian curvature of the surface of the UIA was determined, allowing the principal curvatures k1 and k2 to be calculated. By means of these principal curvatures, it was possible to determine the shape index and curvedness (Fig 1).20 Shape index and curvedness were calculated for every point on the mesh, and a median over the whole mesh of the UIA was determined. The shape index is a descriptor of the local shape of the surface of an object and is scale-invariant. The curvedness is a positive value, which describes the local curvature of the surface and is dependent on the local scale of the object. These values are rotation- and translation-invariant, and Fig 1 depicts examples of how these values vary.

Shape index and curvedness. Shape index and curvedness values vary in 3D shapes. The shape index is a descriptor of the local shape of the surface of an object and is scale-invariant. Shape index values range from –1 (concave “cup”) through 0 (saddle point) to 1 (convex “dome”). The curvedness is a positive value to the local curvature of the surface, which usually lies between 0 and 1 and is dependent on the local scale of the object. These values are rotation- and translation-invariant.
All measurements and segmentations were performed on anonymized data sets by a neuroradiologist (I.C.v.d.S., with 15 years of experience). 2D measurements and the 3D segmentations were performed in a different order and several months apart to prevent bias. The observer was not blinded to the time order of the scans because this reflects the clinical setting. Morphology measurements were made on both the follow-up and baseline scans. Morphologic change was considered the difference between each morphology measurement at follow-up compared with baseline.
Statistical Analysis
Morphologic Changes in Relation to Continuous UIA 2D and 3D Growth.
The relation between morphologic change and UIA growth was investigated by assessing growth as a continuous 2D and 3D outcome measurement (2D size: length and width in millimeters and 3D volume in cubic millimeters). Correlations were assessed using the Pearson or Spearman correlation coefficient, in which normality was tested using a Shapiro-Wilk test. The threshold for statistical significance was P < .05.
Morphologic Changes in Growing and Nongrowing UIAs.
The whole study population was categorized into 2 groups, including either growing or nongrowing UIAs. Growing UIAs were defined according to the clinical definition of 2D growth of ≥1-mm increase in any direction between the baseline and follow-up scan.8 All other UIAs were categorized as nongrowing. The difference in morphology measurements between baseline and follow-up scans was determined for each UIA (morphologic change) and compared between the populations of growing and nongrowing UIAs. An unpaired Student t test was used for normally distributed data, and a Mann-Whitney U test, for non-normally distributed data, for which normality was tested using a Shapiro-Wilk test. The threshold for statistical significance was P < .05.
Morphologic Change Based on Modified z Scores.
We determined the modified z score of the morphologic change, to identify UIAs with morphologic changes that significantly differed from those in most of the study population. This allowed us to differentiate those UIAs that can be considered to change in morphology more than could be expected on the basis of the trend of morphologic change in our population. The modified z score ( ) for each morphology measurement for each UIA was determined as
  , where MAD is the median absolute deviation
  , and xi was each morphology measurement for each (ith) UIA. For this subanalysis, we selected the morphologic parameters that were statistically significantly related to growth (either as continuous or categoric variables) on the basis of the first analyses (parameters: flatness, shape index, and curvedness). Statistically significant morphologic change was defined as any change in morphology measurement that had a modified z score >3.5.21 Finally, we determined the proportion of UIAs with statistically significant morphologic change in the 2 groups of growing and nongrowing UIAs.
RESULTS
Study Population
We included 113 patients with 127 UIAs who met the inclusion criteria (Table 1). After a median follow-up time of 4.1 years (range, 0.9–13.1 years), aneurysm growth was observed in 15/127 (12%) UIAs. There was no statistically significant difference in follow-up time between the groups of growing and nongrowing aneurysms (Mann-Whitney U test, P = .48). A morphologic change that differed statistically significantly from that in most of the study population was found in 18/127 (14%) UIAs.
Patient characteristics
Morphologic Change in Relation to Continuous UIA 2D and 3D Growth
The correlation between UIA morphologic change and continuous UIA growth (2D size and 3D volume) is shown in Table 2.
Change in UIA morphology measurements in relation to continuous UIA 2D and 3D growtha
An increase in volume and surface area showed a statistically significant correlation with 2D growth. An increase in surface area and flatness and a decrease in the shape index and curvedness showed statistically significant correlation with continuous 3D volume growth. Shape index and curvedness were also seen to decrease with increasing continuous 2D length and width measurements, but not enough to be considered statistically significant.
Morphologic Change in Growing and Nongrowing UIAs
Morphologic changes in growing and nongrowing UIAs are shown in Table 3. There were 15 growing UIAs (12% of all 127 UIAs). Growing UIAs had a higher increase in volume and surface area and a larger decrease in curvedness compared with nongrowing UIAs (P < .05).
Change in UIA morphology measurements in growing and nongrowing UIAsa
Morphologic Change Based on Modified z Scores
For the parameters flatness, shape index, and curvedness, we determined the proportion of UIAs with morphologic changes that statistically significantly differed from most of the full study population. In total, 18 UIAs (14%) changed statistically significantly in ≥1 of the morphology parameters compared with most of the population. Eight of the 15 growing UIAs (53%) and 10 of the 112 nongrowing UIAs (9%) showed a statistically significant morphologic change (Fig 2).

Nongrowing UIA with statistically significant change in morphology. An example of a ROI around a UIA taken from baseline and follow-up TOF-MRAs made on a Philips 1.5T scanner (Intera/Achieva). The measured UIA shows statistically significant changes in morphology but was considered to be nongrowing (<1-mm change in length or width). The bulge (arrow) that becomes visible on follow-up results in more saddle points on the surface of the UIA, whereby the shape index decreases. The bulge also increases the curvature of the surface of the UIA, resulting in a slightly increased curvedness value.
DISCUSSION
This study showed a correlation between UIA 3D quantified morphologic changes and UIA growth, as both continuous and categoric variables. Increase in surface area and flatness and decrease in shape index and curvedness were correlated with continuous 3D volume growth. Surface area and curvedness remained statistically significant for growth as a categoric variable. In addition, nearly 1 of 10 nongrowing UIAs also showed morphologic change, suggesting that UIAs can change in morphology even if they are considered nongrowing.
Several previous studies investigated 3D quantified morphology of UIAs, in relation to UIA growth and as a predictor for UIA rupture. In 1 study, 56 growing UIAs and 81 nongrowing UIAs were included.14 UIA growth was defined as an increase of at least 0.5 mm in any direction or a visual change in shape. Only baseline scans of nongrowing UIAs were assessed. At baseline, no statistically significant morphologic differences were observed between nongrowing UIAs and UIAs with future growth. Another study included 38 growing UIAs.16 Growth was defined as 1- mm growth in 1 direction, 0.5-mm growth in 2 directions, or a significant visual change in shape. Similar to our findings, morphology of the UIA (bottleneck factor and ellipticity index) after growth was statistically significantly different from baseline morphology. A third study included 420 UIAs and investigated whether 12 different morphologic measurements of UIAs predicted UIA stability,17 which was defined as rupture within 1-month, clinically defined growth at radiologic follow-up or symptomatic UIAs with adjacent structure compressive symptoms. They found that flatness was the most important morphologic measurement to predict UIA stability.
A direct comparison with previous studies is difficult because consistent methodology and morphology measurements have not been used. Because the field of quantitative medical image analysis is developing rapidly, the IBSI guidelines provide a standardization of radiomics and morphology measurements across all medical images.13 Thus, this study incorporated the morphology measurements as defined in IBSI13 to assess the growth of UIAs on TOF-MRAs.
Our study differs from previous studies by investigating changes in morphologic measurements between baseline and follow-up of both growing UIAs and UIAs that were considered to be nongrowing. By this method, we were able to show that 9% of nongrowing UIAs also showed statistically significant morphologic changes. This raises the question of whether UIA growth and stability should be defined only by size measurements and suggests that (quantified) standard morphologic measurements could also be considered when assessing the stability of UIAs with regard to growth and potential subsequent rupture.
New in our study, compared with previous studies, was the definition of growth both as a continuous as well as a categoric variable. We found more differences that are statistically significant using continuous outcome measures for UIA growth compared with categoric outcomes. By assessing growth as a continuous measure, we consider all UIAs with any change in size or volume, without the use of a cutoff value. By dichotomizing growth into nongrowing and growing categories, precision is lost, reducing the statistical power to find relationships between growth and morphology measurements, which is especially important in smaller data sets. Growth measurements that are close to the 1-mm cutoff, for example 0.9 and 1.1 mm, can be very similar, but by means of a dichotomous measure, they are categorized as completely different. Because many of our UIA growth measurements are in this range, around the clinical definition of growth, a continuous outcome has much larger power.22 Despite a larger statistical power of continuous measurements, in the clinical setting a definition of dichotomized growth is important because it allows better interpretation of UIA growth and facilitates clinical decision-making. However, the growth definition of 1 mm is rather arbitrary, and studies suggest that the interobserver variability in growth measurements could be larger than this.5 Future studies are needed to investigate the best cutoff values for size and morphologic change and a growth definition for predicting aneurysm rupture. Change in size and morphology could aid in rupture-prediction modeling, and how this may affect treatment decisions of UIAs should be studied.
A limitation in our study was that the 3D measurements were determined from segmentations based on annotations on axial slices. This is time-consuming, and the definition of the UIA neck was difficult in some UIAs. An alternative and reproducible automatic aneurysm segmentation method could be used.23 There was variation in the time period between baseline and follow-up because the most recent follow-up MRA was always performed to ensure the longest follow-up time and potential largest proportion of growth and morphologic change. In some cases, the aneurysm was treated or ruptured after the first standard follow-up at 1 year, meaning that the time until follow-up was relatively short. The growing and nongrowing aneurysms did not have statistically significantly different follow-up times. Future studies could assess the longitudinal growth and change in morphology across time. Next, because the MRA scans were performed during a long time period, the scan protocol, scanner field strength, and scan quality differed in some patients between baseline and follow-up scans for both growing and nongrowing UIAs. This difference is realistic in the clinical setting, and we did resample all images to median voxel spacing. This step would have influenced both growing and nongrowing UIAs; therefore, we do not think it has biased our results.
CONCLUSIONS
Our study suggests that both aneurysm size and morphologic changes should be taken into account when assessing UIA growth during radiologic follow-up. However, more studies should be undertaken to develop a complete growth definition based on size and standard 3D-quantified morphology measurements.
Footnotes
This work was supported by the European Commission; Horizon 2020 Framework Program, H2020; Research and Innovation Program; European Research Council, 852173; and Hartstichting, 2018T076, CVON2015-08, CVON2018-02.
Disclosure forms provided by the authors are available with the full text and PDF of this article at www.ajnr.org.
Indicates open access to non-subscribers at www.ajnr.org
References
- Received October 4, 2021.
- Accepted after revision December 2, 2021.
- © 2022 by American Journal of Neuroradiology


Jump to section
Related Articles
Cited By...
- Intra-Aneurysmal High-Resolution 4D MR Flow Imaging for Hemodynamic Imaging Markers in Intracranial Aneurysm Instability
- Deep learning-based cerebral aneurysm segmentation and morphological analysis with three-dimensional rotational angiography
- Deep learning-based cerebral aneurysm segmentation and morphological analysis with three-dimensional rotational angiography