
Abstract
BACKGROUND AND PURPOSE: Synthetic MR imaging creates multiple contrast-weighted images based on a single time-efficient quantitative scan, which has been mostly performed for 2D acquisition. We assessed the utility of 3D synthetic MR imaging in patients with MS by comparing its diagnostic image quality and lesion volumetry with conventional MR imaging.
MATERIALS AND METHODS: Twenty-four patients with MS prospectively underwent 3D quantitative synthetic MR imaging and conventional T1-weighted, T2-weighted, FLAIR, and double inversion recovery imaging, with acquisition times of 9 minutes 3 seconds and 18 minutes 27 seconds for the synthetic MR imaging and conventional MR imaging sequences, respectively. Synthetic phase-sensitive inversion recovery images and those corresponding to conventional MR imaging contrasts were created for synthetic MR imaging. Two neuroradiologists independently assessed the image quality on a 5-point Likert scale. The numbers of cortical lesions and lesion volumes were quantified using both synthetic and conventional image sets.
RESULTS: The overall diagnostic image quality of synthetic T1WI and double inversion recovery images was noninferior to that of conventional images (P = .23 and .20, respectively), whereas that of synthetic T2WI and FLAIR was inferior to that of conventional images (both Ps < .001). There were no significant differences in the number of cortical lesions (P = .17 and .53 for each rater) or segmented lesion volumes (P = .61) between the synthetic and conventional image sets.
CONCLUSIONS: Three-dimensional synthetic MR imaging could serve as an alternative to conventional MR imaging in evaluating MS with a reduced scan time.
ABBREVIATIONS:
- DIR
- double inversion recovery
- PSIR
- phase-sensitive inversion recovery
- QALAS
- quantification using an interleaved Look-Locker acquisition sequence with a T2 preparation pulse
MS is a chronic, immune-mediated, demyelinating disorder of the CNS that usually affects young adults and leads to chronic disability.1,2 The diagnostic criteria for MS are based on the lesion number, size, and location.3 Although diffuse periventricular lesions are most commonly observed, previous studies have shown that the cortical and juxtacortical lesion load is associated with cognitive impairment.4,5 Additionally, the detection of cortical and juxtacortical lesions may contribute to early diagnosis because these lesions are characteristic of MS. MR imaging plays an integral role in the diagnosis and management of patients with MS through the in vivo detection and characterization of lesions. Although MR imaging is highly sensitive in detecting periventricular lesions and is considered as a standard biomarker in the monitoring of treatment response,6 conventional MR imaging techniques have a relatively low sensitivity for detecting (juxta)cortical lesions. Phase-sensitive inversion recovery (PSIR) and double inversion recovery (DIR) are recently developed imaging techniques useful for detecting MS lesions, especially (juxta)cortical ones.7,8 The PSIR preserves the positive and negative polarities of tissues as they recover from the inversion pulse, thus providing a T1-weighted contrast with higher SNR and GM-WM contrast. DIR is an imaging technique that suppresses both WM and CSF signals, thus significantly increasing lesion conspicuity in both GM and WM compared with FLAIR or T2-weighted images. PSIR and DIR have been shown to improve sensitivity compared with FLAIR or T2-weighted images in the detection of cortical lesions. However, the additional scanning time associated with PSIR and DIR has hindered the use of these techniques in clinical practice. Thus, a rapid imaging technique that can acquire these contrast-weighted images with high spatial resolution is desired.
Quantitative synthetic MR imaging is a time-efficient MR imaging technique that enables simultaneous quantification of T1 and T2 relaxation times and proton attenuation and allows the creation of any contrast-weighted image, including DIR and PSIR, without additional scanning time.9⇓⇓⇓–13 Previous studies have shown that synthetic MR imaging is useful for detecting and characterizing MS lesions.10,11,14 However, these studies were based on a multisection 2D acquisition, providing a relatively low resolution in the section direction. 3D quantitative synthetic MR imaging, enabling the simultaneous quantification of T1, T2, and proton attenuation of the whole brain in 3D,15⇓–17 with smaller section thickness, should allow for more detailed delineation of MS lesions. With the combination of high spatial resolution 3D acquisition and DIR as well as PSIR contrasts, 3D quantitative synthetic MR imaging could serve as a clinically useful technique for monitoring MS lesions.
Here, we assessed the utility of the recently developed 3D quantitative synthetic MR imaging for evaluating MS lesions by comparing the synthetic and conventional MR image sets. We hypothesized that 3D synthetic MR imaging would have a comparable diagnostic quality with that of a conventional image set (including 3D FLAIR and DIR) while shortening the total acquisition time.
MATERIALS AND METHODS
Study Participants
This study complied with the Declaration of Helsinki and the Health Insurance Portability and Accountability Act and was approved by the local institutional review board. Written informed consent was obtained from all participants. In this single-center prospective study, 24 patients with MS diagnosed by the McDonald criteria18 were recruited between May 2018 and September 2018. The exclusion criteria comprised contraindications to MR imaging, such as metallic implants, claustrophobia, or tattoos.
MR Imaging Settings
All participants were scanned on a 1.5-T scanner (A patched R5.3.0 Ingenia; Philips Healthcare) with a 12-channel head coil. 3D quantitative imaging was performed with 3D-quantification using an interleaved Look-Locker acquisition sequence with a T2 preparation pulse (3D-QALAS) sequence.16,17 The 3D-QALAS sequence produces 5 raw images that are used to fit relaxation curves based on a least-squares approach. From these quantitative maps, synthetic MR images could be generated by setting arbitrary TRs, TEs, and TIs. 3D-QALAS and conventional imaging (3D T1WI, 2D axial T2WI, 3D FLAIR, and 3D DIR) were performed in the same session on all participants. The acquisition parameters of the sequences are shown in Table 1. Synthetic 3D T1WI, 3D T2WI, 3D FLAIR, 3D PSIR, and 3D DIR images were generated on synthetic MR imaging software (SyMRI version 0.45.14; SyntheticMR) by virtually setting TR, TE, and TI as follows: T1WI, 650/10/- ms; T2WI, 4500/100/- ms; FLAIR, 15,000/75/3000 ms; DIR, 15,000/100/3600 ms; and PSIR, 6000/10/500 ms. All images were visually inspected by a radiologic technologist for gross movement artifacts.
Acquisition parameters for 3D-QALAS and conventional MR imaging sequences
Qualitative Assessments
All images were independently reviewed on a standard DICOM viewer, capable of window level and width adjustment and multiplanar reformation, by 2 neuroradiologists (C.A. and S.K.) with 10 and 6 years of experience, respectively. The readers were blinded to all clinical information to minimize bias. For each participant, conventional and synthetic images were assessed during 2 separate reading sessions with a 5-week memory-washout interval. Patients with MS were randomly assigned to 1 of the following groups: for the first group, a set of synthetic images (eg, 3D T1WI, 3D T2WI, 3D FLAIR, 3D DIR, and 3D PSIR) was presented in the first session and a set of conventional images (eg, 3D T1WI, 2D T2WI, 3D FLAIR, and 3D DIR) in the second session and vice versa for the second group. Each session included either all synthetic or all conventional contrast-weighted images from a case. In each reading session, the raters evaluated 3 metrics, which were overall image quality, structural delineation, and (juxta)cortical lesion count.
Overall Image Quality
The overall image quality was scored for each contrast-weighted image on a 5-point Likert scale, as follows: 1, unacceptable; 2, poor; 3, acceptable (acceptable for diagnostic use but with minor issues); 4, good; and 5, excellent. For each contrast-weighted image, readers recorded whether any of the following artifacts were present: truncation and ringing artifacts, aliasing artifacts, chemical shift artifacts, and any other artifacts (eg, spike noise, banding, and blurring).19
Structural Delineation
The structure delineation scoring was performed in addition to overall image quality scoring, intending to provide specific information about detailed visualization of anatomic regions. Each target structure was rated on a 5-point Likert scale as follows: 1, not visible; 2, not easily detectable (not easily differentiable from neighboring structures); 3, detectable (subtle differentiation from the neighboring structure); 4, easily delineated (easily differentiated from the neighboring structure); and 5, excellent delineation. The target structures included MS lesions, central sulcus, head of the caudate nucleus, posterior limb of the internal capsule, cerebral peduncle, and middle cerebellar peduncle. This approach was a modified version of the method used by Tanenbaum et al.20
Cortical Lesion Count
We did not distinguish between cortical and juxtacortical lesions as per current imaging criteria for MS.18 For simplicity, we therefore referred to both types of lesions as cortical lesions. Cortical lesions larger than 3 mm in diameter were counted by 2 neuroradiologists using all contrast-weighted images of either the synthetic or conventional image sets. Each detected lesion was retrospectively validated on all available imaging data by the other 2 neuroradiologists (S.F. and A.H., with 6 and 11 years of experience, respectively) in consensus to exclude false-positive lesions.
Quantitative Assessment
Lesion Volume Segmentation.
Because periventricular lesions were often diffuse or confluent, they were not manually counted and were assessed with semiautomated lesion segmentation. Lesions were segmented on 3D conventional and synthetic FLAIR images using the lesion probability algorithm implemented in the Lesion Segmentation Toolbox 2.0.12 (Technische Universitat Munchen) running under Statistical Parametric Mapping (https://www.fil.ion.ucl.ac.uk/spm).21 A neuroradiologist (S.F.) performed manual corrections of the automatically segmented lesions. The total volume of the lesions was calculated by each of the synthetic and conventional FLAIR imagings. The Dice similarity coefficient of lesion maps was calculated between the segmentation results of synthetic images and those of conventional images. The Dice similarity coefficient represents the percentage of spatial overlap between 2 binary segmentation results, which is defined as
 in which A and B are target segmentations and ∩ is the intersection.22 The value of the Dice similarity coefficient ranges from 0 to 1, with higher values indicating more overlap between the 2 segmentations.
Statistical Analysis
All statistical analyses were performed on the R program version 3.3.0 (http://www.r-project.org/). The nonparametric Wilcoxon signed rank test was used to compare qualitative (overall image quality, structural delineation, and lesion count) and quantitative scores (lesion volume) between synthetic and conventional images. Interrater reliability for categoric data between readers were assessed by the Kendall coefficient of concordance.23 Agreement between lesion volumes obtained with synthetic and conventional imaging were also assessed by interclass correlation coefficient. A P value of <.05 was considered statistically significant.
RESULTS
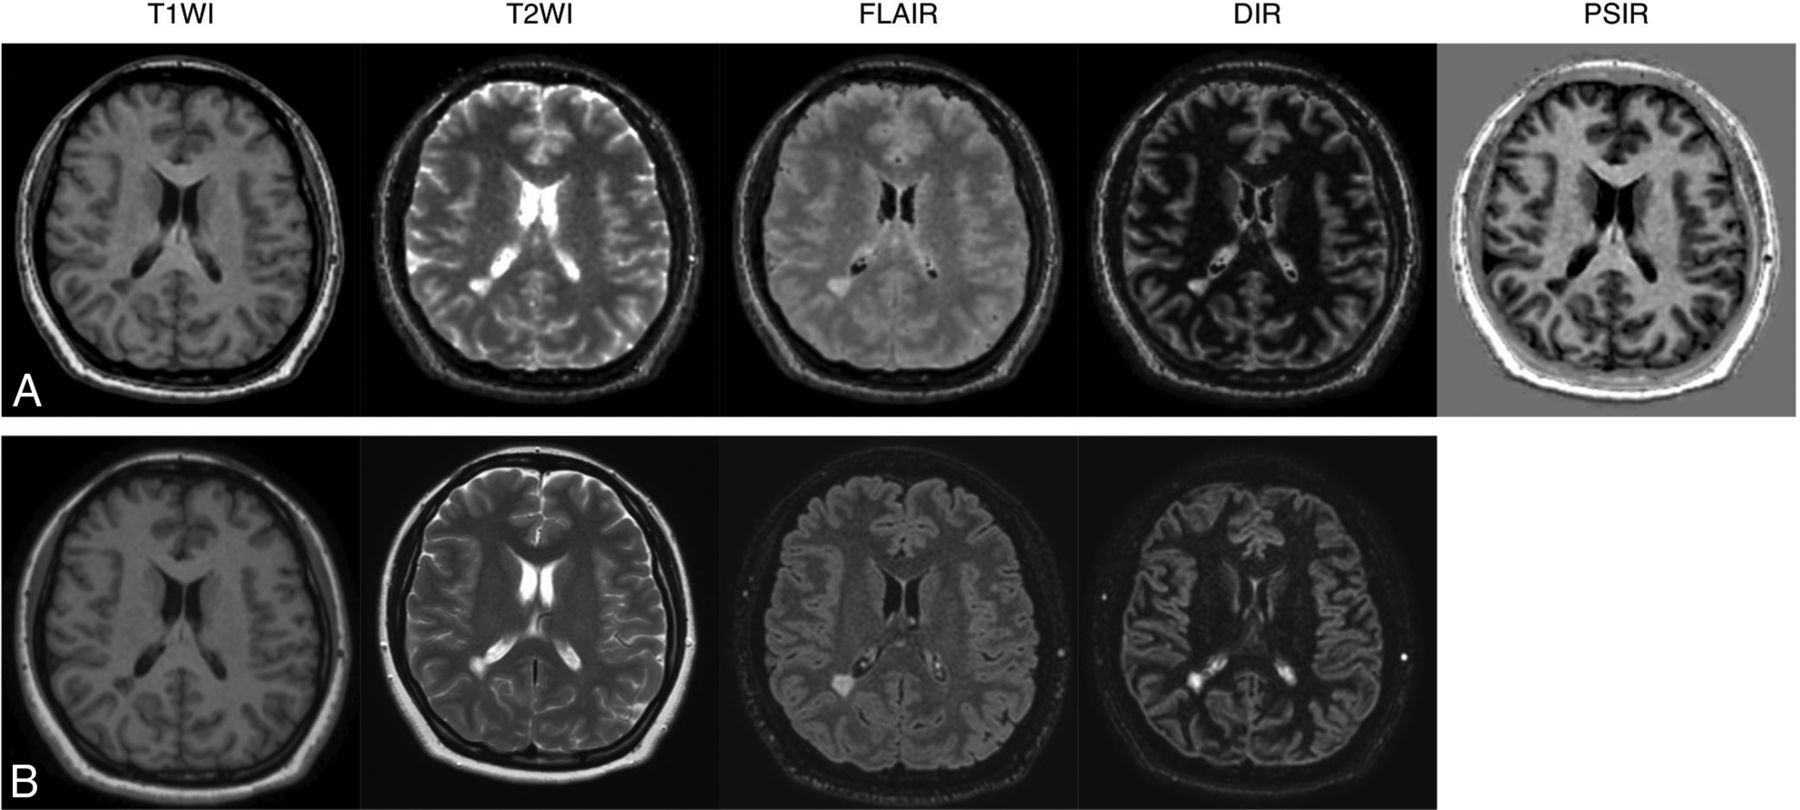
Among the 24 patients with MS, 1 patient showed severe movement artifacts on both 3D-QALAS and conventional imaging and was excluded from the study. The demographic details of the patients in this study are listed in Table 2. Fig 1 shows representative examples of 3D synthetic and conventional images of a patient with MS.
Demographics of patients with MS (n = 23)

Representative examples of quantitative synthetic (A) and conventional (B) MR imaging in a 35-year-old woman with MS. The overall image quality of synthetic T1WI, T2WI, FLAIR, DIR, and PSIR were scored as 5, 3, 3, 5, and 5 by reader 1 and 5, 3, 4, 5, and 5 by reader 2. All of the conventional contrast-weighted images were scored as 5 by both readers.
Qualitative Assessment
Overall Image Quality.
Because the interclass correlation coefficient of overall image quality between the 2 readers was high (0.883), the results were pooled for analysis. Fig 2 shows a comparison of overall image quality between synthetic and conventional MR imaging. Considering all contrast views, 97.8% (225/230) of the synthetic contrast-weighted images and 100% (184/184) of the conventional images were rated as ≥3 on the 5-point Likert scale. The overall diagnostic image quality of synthetic T1WI and DIR images was statistically noninferior to that of conventional images (P = .23 and .20, respectively). The image quality of synthetic T2WI and FLAIR was statistically inferior to that of conventional images (both Ps < .001). Of the synthetic PSIR images, 95.6% (44/46) were rated 4 (good) or 5 (excellent). High-signal artifact on the brain surface on synthetic FLAIR images (Online Supplemental Data) and DIR images (Online Supplemental Data) were observed in 13.0% (3/23) and 17.4% (4/23) of the cases, respectively. A ring-shaped artifact was observed on the brain surface in 8.7% (2/23) of cases in synthetic MR imaging (Online Supplemental Data).

Comparison of overall image quality for conventional and synthetic MR imaging in patients with MS. Each contrast-weighted image in 23 patients was rated on a 5-point Likert scale by 2 readers.
Structural Delineation.
Regarding lesion delineation, 98.7% (227/230) of the synthetic contrast-weighted images and 98.9% (182/184) of the conventional images were rated as ≥3 on the 5-point Likert scale, considering all contrast views (Fig 3). All images rated 2 were either synthetic T2WI (2/46) or synthetic FLAIR (1/46); no images were rated as 1. The lesion delineation of synthetic T2WI and FLAIR was statistically inferior to that of conventional images (both Ps < .001), whereas no significant difference was found for T1WI and DIR between synthetic and conventional images.

Comparison of structural delineations between conventional and synthetic MR imaging in patients with MS. Each target structure in 23 patients was rated for each contrast-weighted image on a 5-point Likert scale by 2 readers.
Considering all evaluated brain structures (ie, the central sulcus, head of the caudate nucleus, posterior limb of the internal capsule, cerebral peduncle, and middle cerebellar peduncle) across all contrast views, 98.1% (1128/1150) of the synthetic contrast-weighted images and 98.8% (909/920) of the conventional images were rated as ≥3 on the 5-point Likert scale (Fig 3). The contrast views that were rated 2 for any of the structures were either synthetic T2WI (14/230), synthetic FLAIR (8/230), or conventional DIR (11/230); no images were rated as 1.
Cortical Lesion Counts.
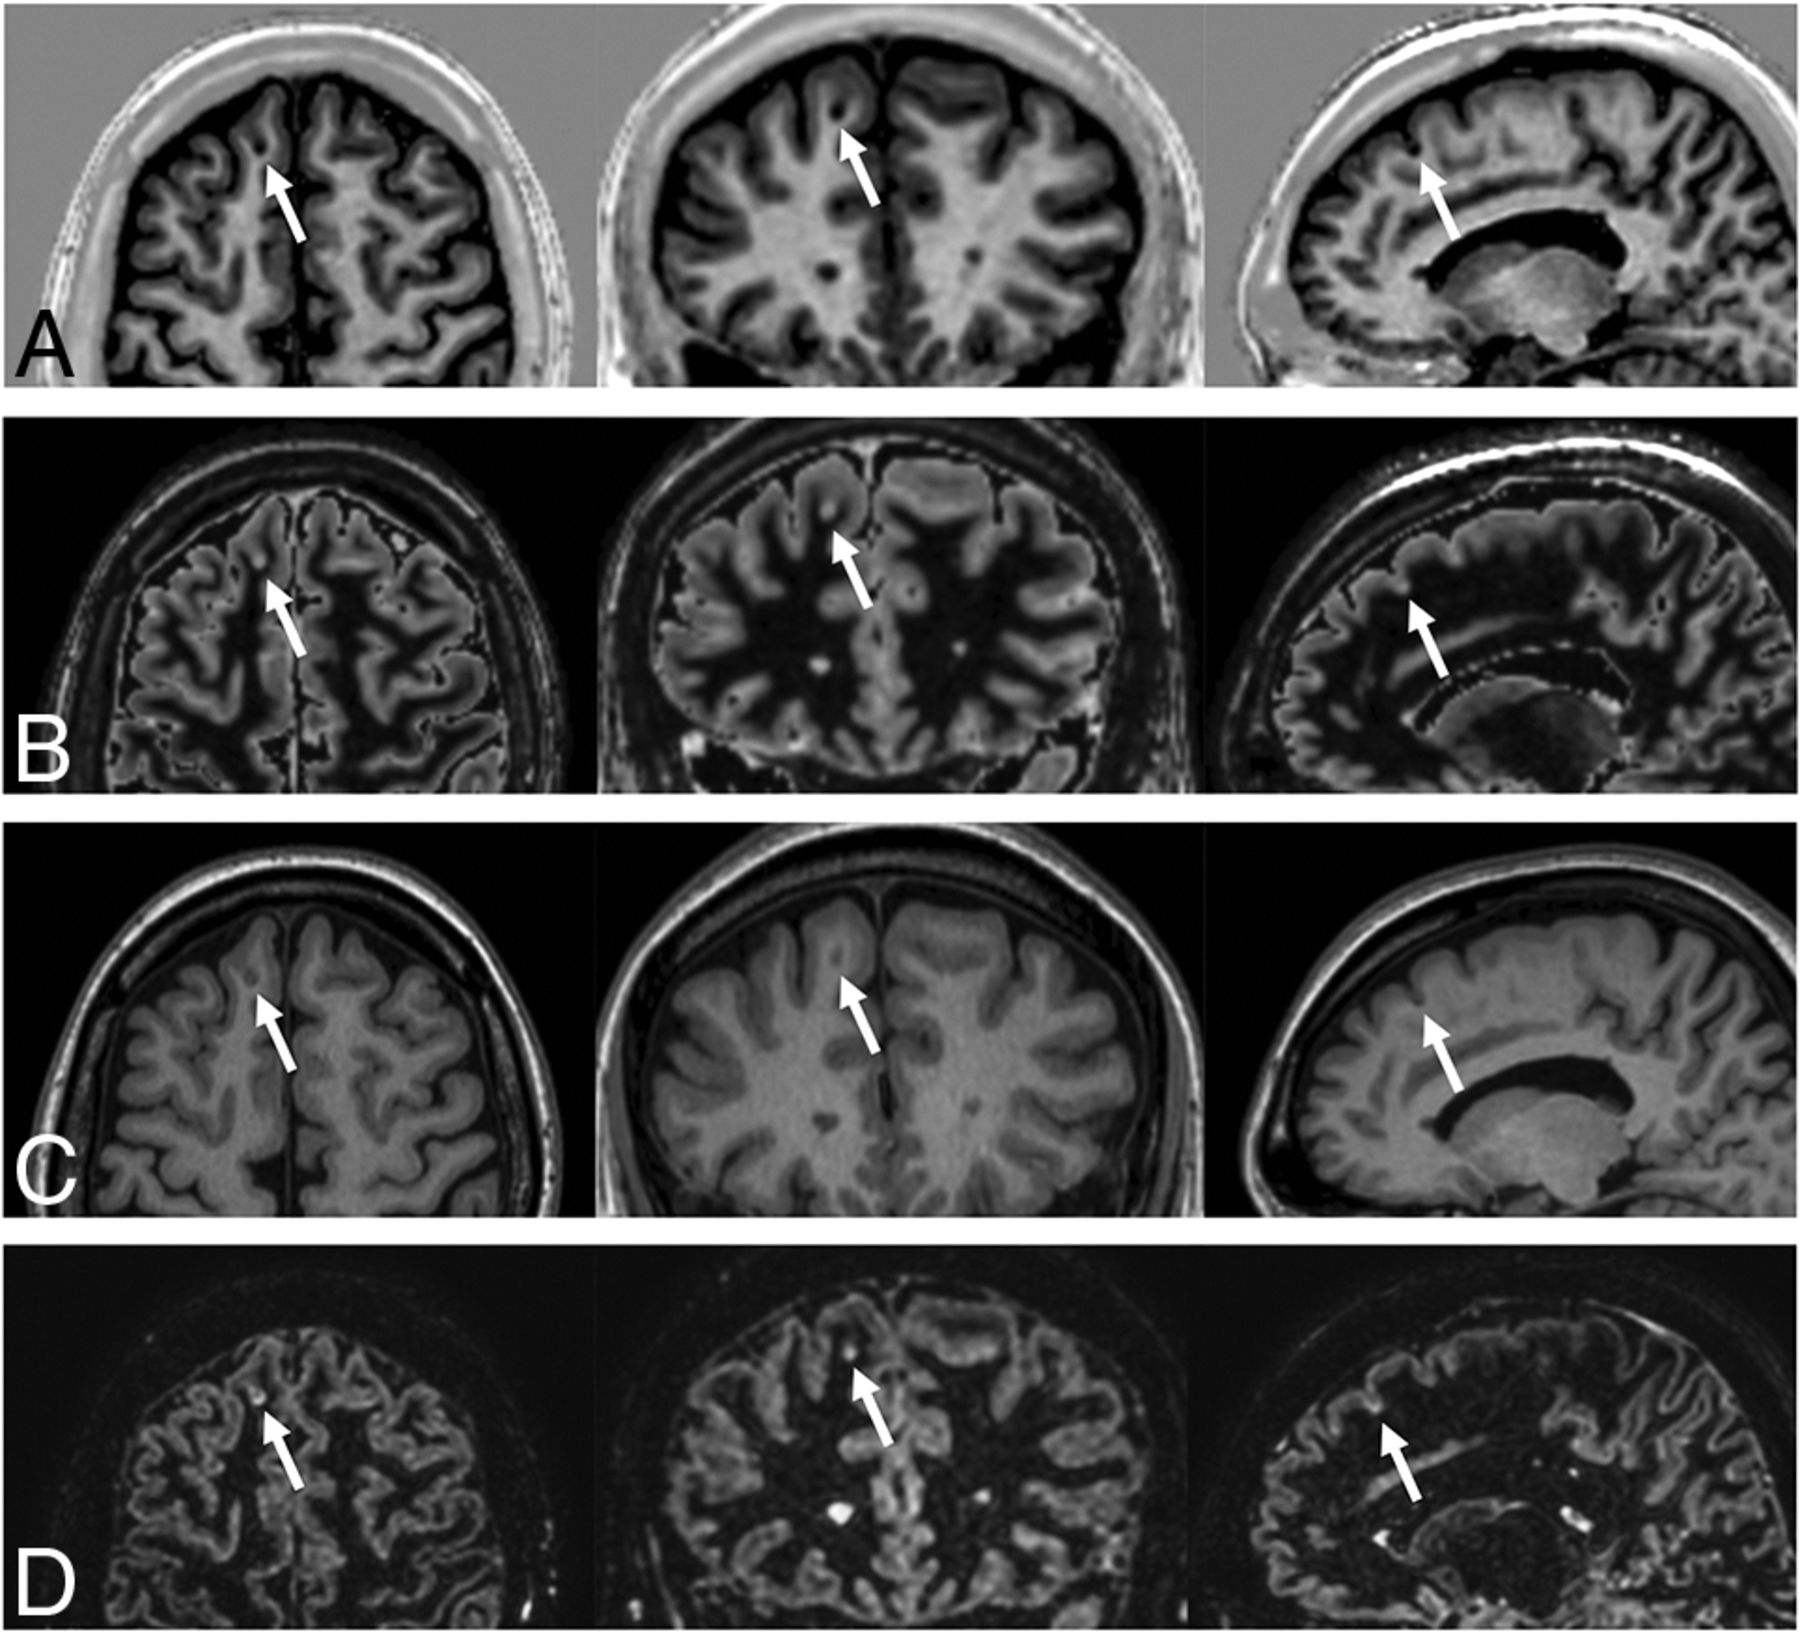
The interobserver reproducibility between the 2 readers for the number of detected cortical lesions was assessed. The interclass correlation coefficient of synthetic MR imaging was 0.90 (95% CI, 0.76–0.96); that of conventional MR imaging was 0.87 (95% CI, 0.69–0.94). Fig 4 shows a representative cortical lesion depicted by conventional and synthetic imaging. The cortical lesion counts with synthetic and conventional image sets were 2.9 ± 3.3 (range, 0–11) and 3.4 ± 3.7 (range, 0–11) by reader 1 and 2.3 ± 2.7 (range, 0–8) and 2.2 ± 3.1 (range, 0–11) by reader 2. Three false-positives were found in both the synthetic and conventional image sets. There was no significant difference in the number of cortical lesion counts between the synthetic and conventional image sets (P = .17 and .53 for each rater).

Example of an MS cortical lesion (arrows) in synthetic PSIR (A) and DIR (B) images. Conventional T1WI (C) and DIR (D) images are shown for reference. (Left) axial, (middle) coronal, and (right) sagittal views.
Quantitative Assessment
Lesion Volume Assessment.
Fig 5 illustrates a representative MS lesion segmentation map on conventional and synthetic images. There was no significant difference in the segmented lesion volumes between synthetic and conventional images: 12.0 ± 10.9 (range, 1.4–35.7) and 12.2 ± 11.9 (range, 0.8–41.0) mL, respectively (P = .61). The interclass correlation coefficient of the segmented lesion volumes was 0.98 (95% CI, 0.97–0.99), indicating excellent agreement. The Dice similarity coefficient of lesion maps between the synthetic and conventional MR imaging among all patients was 0.72 ± 0.07.

Representative examples of lesion segmentation in a 35-year-old woman with MS. Lesions were automatically segmented on synthetic and conventional FLAIR images. The segmented lesions are overlaid on the images used for segmentation. A, Lesions overlaid on 3D synthetic FLAIR images. B, Lesions overlaid on conventional 3D FLAIR images. Minimal differences are observed between segmented lesions of 3D synthetic and conventional FLAIR images.
DISCUSSION
In this study, we evaluated the image quality and utility of 3D synthetic MR imaging in the assessment of MS lesions in both qualitative and quantitative approaches. To the best of our knowledge, this article is the first report of a clinical evaluation of 3D synthetic MR imaging. The time-efficient acquisition of synthetic imaging enabled the shortening of total acquisition time by 51% (9 minutes, 3 seconds and 18 minutes, 27 seconds for 3D-QALAS and conventional sequences, respectively) while maintaining enough image quality for both cortical lesion counts and quantitative lesion volumetric analysis. The acquisition time of 3D-QALAS is even shorter than that of the combination of T1-weighted, T2-weighted, and FLAIR images, which were recently reported to be used for creating 3D DIR images with deep learning.24
Although the image quality of synthetic T2WI and FLAIR images was inferior to that of the conventional contrast-weighted images, there was no significant difference in the number of detected cortical lesions and automatically segmented lesion volumes. These findings support the notion that 3D synthetic imaging could provide essential information for clinical evaluation of MS lesions. Despite the inevitable trade-off between imaging time and image quality, 3D synthetic MR imaging is a promising method for achieving accelerated acquisition while retaining clinical utility.
Several artifacts were reported in the reading session. The high-signal artifact on the brain surface on synthetic FLAIR images is consistent with that reported in 2D imaging and seems to be caused by a partial volume effect.12 This artifact may mimic subpial lesions located at the cortex–CSF interface or make it difficult to identify them. Because no subpial lesion was observed in this study both on synthetic and conventional images, the sensitivity and specificity of synthetic MR imaging to subpial lesions remain unclear. The relatively inferior image quality of synthetic T2WI and FLAIR images is desired to be solved for synthetic MR imaging to be used in routine clinical imaging protocols.12 For 2D synthetic FLAIR, deep learning has been reported to be useful for improving the image quality of synthetic FLAIR while reducing artifacts.25 In this study, a ringing artifact was observed on the brain surface, which was also seen in the original 3D-QALAS images. These findings indicate that this artifact was not caused by the process of image synthesis but rather propagated from the artifacts presenting in the original images to all the contrast-weighted images that were synthesized from the original images. Although readers rated conventional DIR superior to synthetic DIR for overall image quality, they preferred synthetic DIR for structural delineation. One possible reason for this discrepancy is that the readers were accustomed to the appearance of conventional contrast-weighted images, and hence they may have rated familiar conventional DIR images high in terms of overall image quality.
3D acquisition can provide thin continuous sections, which reduces the effects of partial volume averaging. Datasets of isotropic voxel size permit multiplanar reformations, allowing lesions to be viewed in any conventional axial, sagittal, and coronal plane and an oblique reformatted plane after a single acquisition. Furthermore, image synthesis is not limited to 3D-QALAS and could be applied to other multiparametric approaches, such as MR fingerprinting. In addition to the quantitative values, this produces contrast-weighted images that allow radiologists to fully use their knowledge and abilities for diagnosis. The synthesis of MRA from 3D-QALAS data is also feasible.26
One of the strengths of synthetic MR imaging that remains to be studied is the possibility of adjusting the synthetic TR, TE, and TI parameters to optimize them for each pathology, which has been shown in 2D synthetic MR imaging.11 Although we have used preset parameters for creating synthetic images in this study, optimization of the contrast may improve the detection and delineation of lesions over conventional imaging. This could potentially lead to an early and accurate diagnosis of MS based on MR imaging. Another strength of 3D-QALAS is that it obtains not only multiple contrast images for visual assessment but also quantitative maps that could be useful for personalized or precision medicine.27 Blystad et al28 reported that contrast-enhancing MS lesions have significantly lower T1, T2, and proton density than nonenhancing lesions. This raises the possibility of predicting active lesions without gadolinium-based contrast agents.
The study limitations include the relatively small sample size and single-center design. Future multicenter studies evaluating the diagnostic accuracy of synthetic MR imaging in a large cohort are desired before its introduction into clinical practice. Another limitation is that the in-plane resolution of 1.30 mm in this study was lower than the recommended in-plane resolution of 1.0 mm described in the MAGNIMS guidelines.29 A 3T scanner could increase signal-to-noise ratio, enabling improved in-plane resolution. Combining with techniques such as compressed sensing30 may further increase the resolution with comparable or shorter scanning times.
CONCLUSIONS
3D synthetic MR imaging of the brain enables the creation of useful contrast-weighted images, including DIR and PSIR, in a single acquisition, thus reducing scanning time compared with conventional MR imaging. The synthetic contrast-weighted images were inferior in image quality but comparable in diagnostic power to those acquired by conventional MR imaging in patients with MS. 3D synthetic MR imaging may be considered an alternative to conventional MR imaging for generating diagnostic T1-weighted, DIR, and PSIR images, but synthetic T2-weighted and FLAIR images are currently unsatisfactory.
Acknowledgments
We acknowledge Takuya Haruyama, Yuya Nishimura, Wataru Uchida, and Masahiro Abe for their help in data handling and graphic assistance.
Footnotes
This work was supported by the Japan Agency for Medical Research and Development (AMED) under grant number JP19lk1010025h9902; JSPS KAKENHI grant numbers 19K17150, 19K17177, 18H02772, and 18K07692; a Grant-in-Aid for Special Research in Subsidies for ordinary expenses of private schools from The Promotion and Mutual Aid Corporation for Private Schools of Japan; and Brain/MINDS beyond program from AMED grant numbers JP19dm0307024 and JP19dm0307101.
S. Fujita and K. Yokoyama are co-first authors with equal contributions.
Disclosures: Akifumi Hagiwara—RELATED: Grant: JSPS; UNRELATED: Travel/Accommodations/Meeting Expenses Unrelated to Activities Listed: GE Healthcare. Koji Kamagata—RELATED: Grant: Brain/MINDS program from AMED grant number JP19dm0307024 and JP19dm0307101, Comments: This work was supported by Brain/MINDS program from AMED Grant Number JP19dm0307024 and JP19dm0307101; UNRELATED: Grants/Grants Pending: JSPS KAKENHI Grant Number JP16K10327. Osamu Abe—UNRELATED: Grants/Grants Pending: We have a grant from Canon Medical Systems, GE Healthcare, and Siemens Healthcare K.K.*; Payment for Lectures, Including Service on Speakers Bureaus: Payment for lectures, Comments: I receive a lecture fee from Canon Medical Systems, GE Healthcare, Guerbet Japan, Philips Healthcare, and Siemens Healthcare K.K. Shigeki Aoki—UNRELATED: Board Membership: Canon, Comments: Canon MR advisory board; Grants/Grants Pending: Mediphysics, Daiichi-Sankyo, Eisai, Fuji-Toyamakagaku, Guerbet, Comments: Grant for diagnostic radiology from Mediphysics, Daiichi Sankyo, Eisai, FUJIFILM Toyama Chemical co., Guerbet*; Payment for Lectures, Including Service on Speakers Bureaus: Bayer, Canon, FUJIFILM Toyama Chemical Co., Eisai, Guerbet, GE, Mediphysics, Siemens, Daiichi-Sankyo, Comments: Payment for lectures and chair from Bayer, Canon, FUJIFILM Toyama Chemical Co., Fujifilm Medical, Eisai, Guerbet, GE, Mediphysics, Siemens, Daiichi-Sankyo*; Payment for Manuscript Preparation: Miwa Shoten, Gakken Medical Shujunsha, Comments: Payment for manuscript from Miwa Shoten, Gakken Medical Shujunsha.* Kazumasa Yokoyama—UNRELATED: Other: Ohara Pharmaceutical, AbbVie, Ono Pharmaceutical, Mitsubishi Tanabe Pharma, MiZ, Asahi Kasei Medical, and Nihon Pharmaceutical, Comments: Donations for treatment and research in multiple sclerosis and neuro-intractable disease. *Money paid to institution.
Indicates open access to non-subscribers at www.ajnr.org
References
- Received July 16, 2020.
- Accepted after revision September 30, 2020.
- © 2021 by American Journal of Neuroradiology


