
Abstract
BACKGROUND AND PURPOSE: It is unknown whether deceleration of brain atrophy is associated with disability improvement in patients with MS. Our aim was to investigate whether patients with MS with disability improvement develop less brain atrophy compared with those who progress in disability or remain stable.
MATERIALS AND METHODS: We followed 980 patients with MS for a mean of 4.8 ± 2.4 years. Subjects were divided into 3 groups: progress in disability (n = 241, 24.6%), disability improvement (n = 101, 10.3%), and stable (n = 638, 65.1%) at follow-up. Disability improvement and progress in disability were defined on the basis of the Expanded Disability Status Scale score change using standardized guidelines. Stable was defined as nonoccurrence of progress in disability or disability improvement. Normalized whole-brain volume was calculated using SIENAX on 3D T1WI, whereas the lateral ventricle was measured using NeuroSTREAM on 2D-T2-FLAIR images. The percentage brain volume change and percentage lateral ventricle volume change were calculated using SIENA and NeuroSTREAM, respectively. Differences among groups were investigated using ANCOVA, adjusted for age at first MR imaging, race, T2 lesion volume, and corresponding baseline structural volume and the Expanded Disability Status Scale.
RESULTS: At first MR imaging, there were no differences among progress in disability, disability improvement, and the stable groups in whole-brain volume (P = .71) or lateral ventricle volume (P = .74). During follow-up, patients with disability improvement had the lowest annualized percentage lateral ventricle volume change (1.6% ± 2.7%) followed by patients who were stable (2.1% ± 3.7%) and had progress in disability (4.1% ± 5.5%), respectively (P < .001). The annualized percentage brain volume change values were −0.7% ± 0.7% for disability improvement, −0.8% ± 0.7% for stable, and −1.1% ± 1.1% for progress in disability (P = .001).
CONCLUSIONS: Patients with MS who improve in their clinical disability develop less brain atrophy across time compared with those who progress.
ABBREVIATIONS:
- DMT
- disease-modifying therapies
- EDSS
- Expanded Disability Status Scale
- LVV
- lateral ventricle volume
- PBVC
- percentage brain volume change
- PLVVC
- percentage lateral ventricle volume change
- PP
- primary-progressive
- RR
- relapsing-remitting
- SP
- secondary-progressive
- T2-LV
- T2 lesion volume
MS is an autoimmune disease of the central nervous system characterized by focal and diffuse inflammation1 and neurodegeneration that presents with central, peripheral, and regional brain atrophy.2,3 Brain atrophy measurement is one of the key biomarkers in MS4,5 because it can be assessed in vivo by MR imaging. Brain atrophy is accelerated in patients with MS,6 persists during the course of the disease, and is clinically meaningful since the earliest disease stages.7 Brain atrophy is related to short- and long-term physical and cognitive clinical deterioration, more robust than other measures of disease burden and lesion activity.5,8,9
A modest-to-strong link between development of brain atrophy and worsening of disability progression has been established.10⇓-12 Consequently, all recent major Phase 3 clinical trials in MS now consider brain atrophy as one of the main neurodegenerative outcomes for evaluating the efficacy of disease-modifying therapies (DMT).13⇓⇓⇓⇓-18
It has been shown that some of the available DMT can not only slow radiologic and clinical progression but also improve clinical status in a substantial proportion of patients with MS in the mid- to long-term.13,15,16,18,19 Nevertheless, only a few studies have explored the relationship between behavior of brain volume changes and improvement in clinical status,20⇓-22 and no studies examined this phenomenon in the clinical routine in a large population of patients with MS followed long term. Thus, it is unknown whether patients with MS who experience disability improvement have a decelerated brain atrophy trajectory, compared with those with stable disease or disability progression.
In the current study, we hypothesized that long-term deceleration of brain atrophy progression will be linked to disability improvement in patients followed in a clinical routine. Thus, we investigated whether patients with MS with disability improvement develop less brain atrophy compared with those who either progress in their disease or remain stable.
MATERIALS AND METHODS
Subjects
This retrospective study included 980 patients with MS, who were prospectively followed in a single MS center (Jacobs Comprehensive MS Treatment and Research Center) between 2006 and 2016.
The inclusion criteria for this study were the following: 1) being diagnosed with MS according to the McDonald criteria,23 2) availability of both 2D-T2WI-FLAIR and 3D-T1WI sequences at every MR imaging examination, 3) the presence of 1 follow-up MR imaging examination in the same subject during ≥6 months after baseline examination, and 4) the availability of demographic (race was also included for completeness of the data reporting) and clinical information at baseline and follow-up examinations. Exclusion criteria were the following: 1) having a relapse or steroid treatment in the 30 days preceding the MR imaging examination, 2) pre-existing medical conditions known to be associated with brain pathology (cerebrovascular disease, positive history of alcohol abuse), and 3) pregnancy. The selection of subjects, according to the inclusion and exclusion criteria, is shown in the On-line Figure.
The study was approved by the local institutional review board, and due to the retrospective nature of the study, the requirement for obtaining informed consent was waived.
MR Imaging Acquisition and Analysis
The MR imaging examinations used in the present study were obtained on 1.5T and 3T Signa Excite HD 12.0 Twin Speed 8-channel scanners (GE Healthcare) with head and neck coils (HDNV; GE Healthcare), which did not undergo any hardware or software changes during the study period. The 3T MR imaging sequences used in this study were the following: 1) an axial 2D-T2WI-FLAIR sequence with TE/TI/TR of 120/2100/8500 ms, flip angle of 75°, FOV of 265 × 192, acquisition matrix of 1 × 1 × 3 mm; and 2) a 3D-T1WI sequence with TR/TI/TE of 2.8/900/5.9 ms, flip angle of 10°, FOV of 265 × 192, acquisition matrix of 1 × 1 × 1 mm. Similarly, the 1.5T sequences used TE/TI/TR of 120/2000/8000 ms and TE/TI/TR of 3.7/900/7.7 ms for the 2D-T2WI-FLAIR and 3D T1WI, respectively.
MR imaging analysis and quality control were performed in a fully blinded manner. The 3D-T1WI was preprocessed using an inpainting technique to avoid tissue misclassification of T1-hypointense lesions.24 At baseline, normalized whole-brain volume was calculated using FSL SIENA or SIENAX (SIENAX; http://fsl.fmrib.ox.ac.uk/fsl/fslwiki/SIENA),25 whereas for follow-up changes, the SIENA percentage brain volume change (PBVC) method was used.25
The Neurologic Software Tool for REliable Atrophy Measurement (NeuroSTREAM; http://www.neurostream.us/) was used to assess baseline lateral ventricle volume (LVV) and percentage LVV change (PLVVC) across time on 2D-T2-FLAIR images.26
Cross-sectionally, LVV and whole-brain volume values at the first available MR imaging examination were calculated. Changes between baseline and follow-up examinations were calculated determining PLVVC and PBVC and were subsequently annualized.
In addition, we calculated T2-lesion volume (T2-LV), using a semiautomated approach.27
Clinical Outcomes
Disability progression was defined as an increase from the baseline Expanded Disability Status Scale (EDSS) score of at least 1.0 point or 0.5 if the baseline EDSS score was >5.5. Disability improvement was defined as a reduction from the baseline EDSS score of at least 1.0 point if the baseline score was 2.0–5.5, or 0.5 if the baseline score was >5.5, as previously reported.16,28 Stable disability status was defined as nonoccurrence of the disability progression or disability improvement.
Patients were also classified as having benign MS at baseline if the EDSS was ≤3.0 and disease duration was ≥15 years.29
Statistical Analysis
Analyses were performed using the Statistical Package for the Social Sciences, 24.0 (IBM). Differences between groups were analyzed using the χ2 test, Kruskal-Wallis test, and 1-way ANOVA as appropriate.
Three different models assessed the PLVVC and PBVC differences among disability status groups using ANCOVA, adjusted for the following: 1) age at first MR imaging and race; 2) age at first MR imaging, race, T2-LV, and corresponding baseline structural volume; and 3) age at first MR imaging, race, T2-LV corresponding baseline structural volume, and EDSS. Additional pair-wise comparisons between groups were performed by Bonferroni-adjusted post hoc analyses, and adjusted estimated means with 95% confidence intervals were presented. The Cohen d measure of effect size was also calculated.
Secondary analyses of only patients with a follow-up time of ≤2 years used the same statistical approach. The effects of changes in MR imaging scanner strength on the follow-up, changes of PLVVC, and PBVC were determined using mixed-effect modeling.
For all analyses, a nominal P value of ≤.05 was considered significant using 2-tailed tests. The P values presented hereafter are based on the third ANCOVA model.
RESULTS
Demographic and Clinical Characteristics of the Study Cohort
Nine hundred eighty patients with MS who met the inclusion criteria were enrolled in this study (On-line Table 1 and On-line Fig 1). Of those, 241 (24.6%) developed disability progression, 101 (10.3%) had disability improvement, and 638 (65.1%) remained stable during the follow-up period. The mean interval between baseline and follow-up was 4.8 ± 2.4 years for disability progression, 4.7 ± 2.4 years for disability improvement, and 4.8 ± 2.4 years for stable status (P = .887).
The study population consisted of 75.7% females, and their age in years at baseline was 47.1 ± 9.8 for DP, 44.7 ± 9.9 for DI and 45.4 ± 11.2 for Stable (P = .07) groups. The mean age at disease onset was 33.3 ± 9.6 years for disability progression, 31.3 ± 9.8 years for disability improvement, and 33.2 ± 10.4 years for stable status (P = .2). The mean disease duration at baseline was 13.3 ± 9.6 years for disability progression, 12.8 ± 9.5 years for disability improvement, and 11.8 ± 9.5 years for stable status (P = .1).
The median (interquartile range) EDSS at baseline was 3.0 (3.0) for disability progression, 3.5 (3.0) for disability improvement, and 2.5 (2.5) for stable status (P < .001). The median (interquartile range) EDSS at follow-up was 6.0 (3.0) for disability progression, 2.5 (2.5) for disability improvement, and 2.5 (2.5) for stable status (P < .001). The mean annualized relapse rate during the follow-up was 0.25 ± 0.55 for disability progression, 0.28 ± 0.69 for disability improvement, and 0.18 ± 0.37 for stable status (P = .02).
In the disability progression/disability improvement/stable categories at baseline, 182 (75.5%), 85 (84.2%), and 527 (82.6%) had relapsing-remitting (RR); 49 (20.3%), 14 (13.9%), and 100 (15.7%) had secondary-progressive (SP); and 10 (4.1%), 2 (2%), and 11 (1.7%) had primary-progressive (PP) MS disease subtypes (P = .29). The number of patients classified as having benign MS at baseline was 45 (18.7%) in disability progression, 8 (7.9%) in disability improvement, and 97 (15.2%) in stable groups (P = .04).
There was no significant difference in type of DMTs between the three disability groups at baseline (P = .15), but was at follow-up (0.03). However, more MS patients in the DP group started or switched DMT over the follow-up compared to the DI and Stable groups (P = .02) to: No significant differences occurred in DMT status over the follow-up (P = .2).
MR Imaging Characteristics at Baseline and during Follow-Up
In total, 527 patients had no change in MR imaging findings and 453 did. There were no significant differences in the proportion of patients with disability progression/disability improvement/stable status that either changed or remained the same on MR imaging during the follow-up (126/343/58 versus 115/295/43, P = .42).
The mean T2-LV at baseline was 21.9 ± 18.0 mL for disability progression, 17.2 ± 15.9 mL for disability improvement, and 16.8 ± 14.9 mL for stable status (P < .001). At baseline, LVV was available in all 980 (100%) subjects, and whole-brain volume, in 873 (89.1%) subjects. At follow-up, the PLVVC was available in all 980 (100%), and PBVC, in 612 (62.4%) patients. The whole-brain volume (107, 10.9%) at baseline and PBVC (368, 37.6%) during follow-up was not obtained because these measures did not pass quality control related to the use of a different scanner-strength field between baseline and follow-up, poor scan quality, and artifacts that affected calculation of these outcomes.
On-line Table 2 shows PLVVC and PBVC in disability progression, disability improvement, and stable groups. Figures 1 and 2 show representative changes of PLVVC and PBVC in disability progression and disability improvement in individual patients during follow-up, respectively. At baseline, there were no significant LVV and whole-brain volume differences among patients with MS in the disability progression, disability improvement, and stable groups.

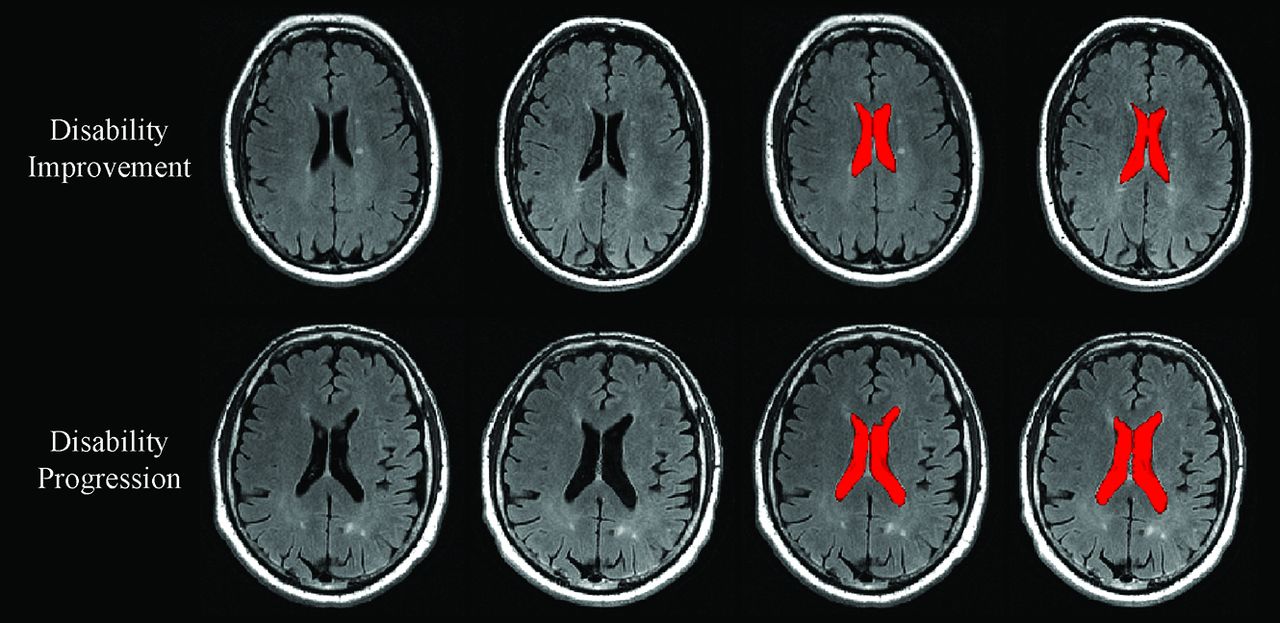
Change in lateral ventricle volume in patients with MS disability progression and disability improvement. In the upper and lower rows are shown in patients with MS with disability improvement and disability progression, respectively. From left to right are baseline and followup T2-FLAIR images and images of NeuroSTREAM LVV (highlighted in red) segmentation at baseline and at follow-up. Please note higher annualized percentage LVV change in patients with MS with disability progression (5.7%) compared with disability improvement (1.1%).

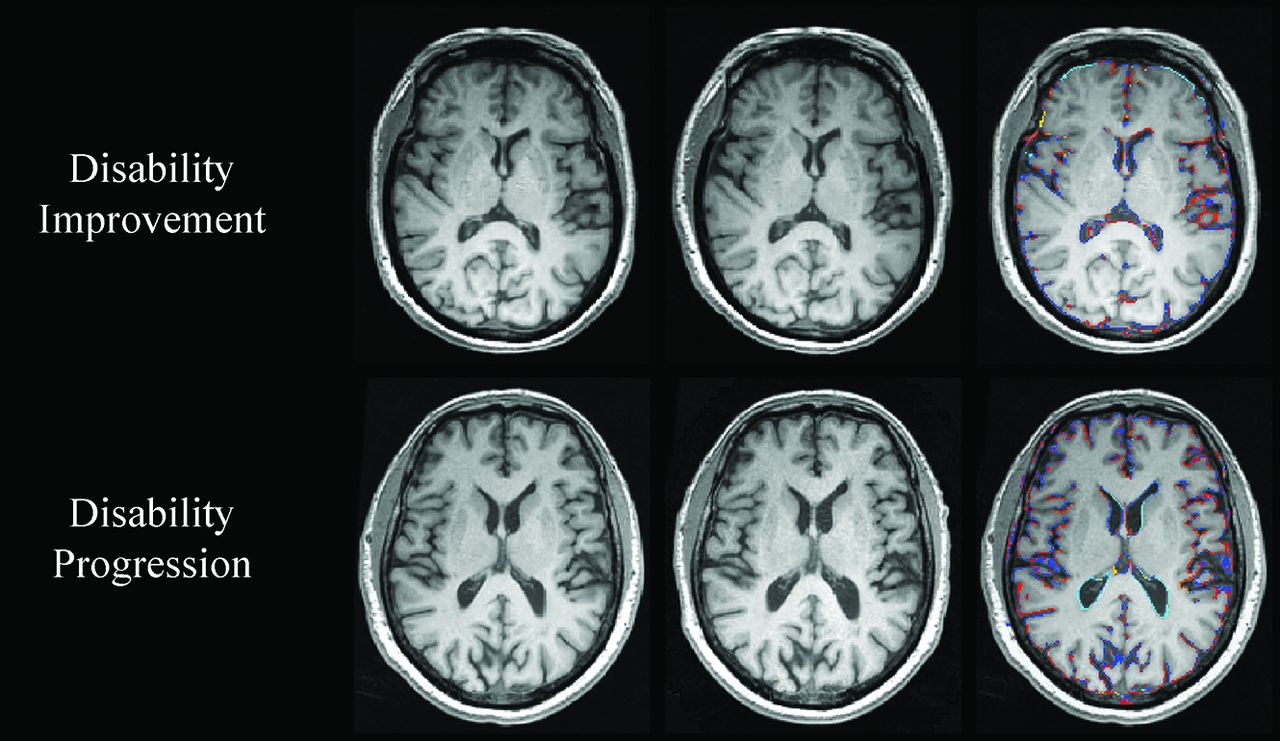
Change in whole-brain volume in patients with MS with disability improvement and disability progression. In the upper and lower rows are shown patients with MS with disability improvement and disability progression, respectively. From left to right are baseline and follow-up 3D-T1WI, and a SIENA brain volume change edge map showing areas of atrophy (in blue-light blue) and growth (in red-yellow). Please note the higher annualized PBVC rate in disability progressed (−2.4%) compared with disability improved (−0.5%).
During the follow-up period, the annualized PLVVC was 1.6% ± 2.7% in disability improvement, 2.1% ± 3.7% in stable status, and 4.1% ± 5.5% in disability progression groups (adjusted P < .001). Both disability improvement and stable groups had significantly lower total and annualized PLVVC compared with the disability progression group (adjusted P < .001). The disability improvement group did not show a significant difference in total (adjusted P = .6) or annualized (adjusted P = .92) PLVVC compared with the stable group. The estimated means and 95% confidence intervals for the analyses are shown in On-line Table 3.
The annualized PBVC was −0.7% ± 0.7% in the disability improvement, −0.8% ± 0.7% in stable, and −1.1% ± 1.1% in disability progression groups (adjusted P = .001). The disability improvement group had significantly lower total (adjusted P = .01) and annualized (adjusted P = .02) PBVC compared with the disability progression group. The stable group had significantly lower total (adjusted P < .001) and annualized PBVC compared with the disability progression group (adjusted P = .01). The disability improvement group did not show a significant difference in total (adjusted P = 1.0) or annualized PBVC (adjusted P = 1.0) compared with the stable group. The estimated means and 95% confidence intervals for the analyses are shown in On-line Table 3.
Although not significant, the data trends were seen within the smaller population of patients who were followed for ≤2 years (On-line Table 4). Similarly, the estimated means and 95% CI are shown in On-line Table 5.
MR Imaging Field Strength Effects on MR Imaging Brain Volume Changes
The main and interaction effects of the study variables on the changes in NeuroSTREAM-based PLVVC and SIENA-based PBVC were investigated. The change in MR imaging strength and time interaction was not significantly associated with PLVVC (P = .97), contributing to an opposite effect of 0.01% during the same amount of follow-up time. Similar analysis for PBVC showed a significant effect of the change in MR imaging strength and time interaction (P = .03), contributing to an opposite effect of 0.16% during the same amount of follow-up time.
DISCUSSION
The present study provides additional insight into understanding the relationship between the development of brain atrophy in patients with MS who improve in disability compared with those who remain stable or progress. Data were retrospectively evaluated from a large cohort of patients with MS prospectively collected on a routine clinical basis during 10 years. The study included about 1000 patients with MS who were selected retrospectively, according to the inclusion and exclusion criteria, from a larger pool of >2000 subjects and were followed with MR imaging and clinical examinations for a mean time of almost 5 years. To our knowledge, research studies, especially those including routine clinical data that explore brain atrophy trajectories related specifically to the improvement of disability in patients with MS, are scarce. Therefore, the present study is one of the first longitudinal studies investigating this issue to date.
We used 2 different measures of brain atrophy in this study, LVV and whole-brain volume. It has been shown that LVV correlates with disability progression and cognitive impairment,10⇓-12 and due to its feasibility, it could represent a more adequate marker of MS-related brain atrophy to be applied in the clinical routine.30,31 In fact, it was reported recently that changes in LVV act as a proxy for whole-brain volume and correlate with progression of GM and cortical atrophy in the 10-year period.12 Moreover, LVV is located in the center of the brain, an area that is relatively immune to artifacts due to imprecise positioning, gradient distortions, incomplete head coverage, and wraparound artifacts.26 We confirmed in this study, as in previous studies,30,32 that LVV measurement was feasible in patients with MS and was not affected by changes in MR imaging strength and time interaction during follow-up. In addition, the PBVC is one of the most accepted methods for quantifying neurodegeneration in MS.10 PBVC correlates with measures of central atrophy, such as LVV and GM atrophy; however, it is more difficult to obtain on routine clinical scans due to inherent changes in field strength, scanner type, software, and protocol among serial MR imaging examinations; this issue represents a difficult barrier to its adaptation for use in clinical settings.12 This was confirmed in this study because 37.6% of the patients were excluded during the follow-up because PBVC did not pass quality control related to changes in MR imaging strength, poor scan quality, and artifacts.
PBVC was significantly affected by changes in MR imaging strength and time interaction during follow-up. In the present study, we found that at baseline, there were no significant LVV or whole-brain volume differences among patients with MS with disability progression, disability improvement, and stable progression. During the follow-up period, the total and annualized PLVVC and PBVC were significantly lower for disability improvement compared with disability progression groups (all P ≤ .001). Similar trends were seen within the smaller sample of patients who were followed for ≤2 years, indicating that brain atrophy trajectory differences can be detected in the first 2 years of follow-up among patients with MS with disability progression, disability improvement, and stable status. The disability improvement group did not show a significantly different total or annualized PLVVC and PBVC compared with the stable group.
A recent study compared brain atrophy data of 1514 patients with MS, 137 patients with clinically isolated syndrome, and 164 healthy subjects collected retrospectively during 5 years. The data reported for the annualized PLVVC and PBVC for healthy individuals were 1.6% and −0.4%, respectively, using the same scanners and protocols as in the present study.30 Comparing the results from this and the previous studies,30,32 we found that the annualized PLVVC was similar and the annualized PBVC was higher compared with those observed in healthy individuals. We could therefore hypothesize that patients with disability improvement and healthy subjects undergo a similar degree of central brain atrophy and a higher degree of whole-brain atrophy accumulation. Our results also corroborate a recent study that demonstrated that the degree of brain atrophy is the lowest in stable nonrelapsing/nonworsening RRMS, greater in relapsing/nonworsening and nonrelapsing/worsening RRMS, and the highest in relapsing and worsening RRMS.33 Last, baseline whole-brain volume was the only predictor of disability progression in a recent study from the Serially Unified Multicenter MS Investigation consortium.34
Because it was shown that the rate of brain atrophy is slower in patients with MS with benign disease35 and to avoid a potential bias within the 3 disability status groups, we calculated the proportion of patients with benign MS according to the definition based on EDSS and disease duration (EDSS ≤3.0 and disease duration ≥15 years).29 Surprisingly, we found that the disability progression group had a larger proportion of patients with MS with benign disease at baseline (18.7%) compared with 7.9% of patients with MS with benign disease in the disability improvement and 15.2% in the stable groups, respectively. Because the disability improvement group had a significantly lower proportion of patients with MS with benign disease at baseline, a potential selection bias in the disability improvement sample is unlikely.
The use of DMT in our study population could have influenced disability progression or disability improvement status. In the present study, the use of DMT was present in 180 (74.7%) patients with disability progression, 79 (78.2%) with disability improvement, and 518 (81.2%) with stable status at baseline. No significant differences in the type of DMT at baseline or at follow-up among the 3 disability groups were detected. However, significantly more patients with MS in the disability progression group started or switched DMT during the follow-up, compared with patients with disability improvement or stable disease, indicating potentially more active or breakthrough disease characteristics. Given the heterogeneous status of the DMT in the disability status groups examined, we did not investigate the effect of specific DMT on the development of brain atrophy and disability progression/disability improvement/stable status during follow-up. However, our findings could be important for the design of future studies that will include a more homogeneous patient sample using specific DMT to explore disability status improvement in relation to brain atrophy trajectory changes.
A recent study showed that disability progression was associated with an annualized PBVC of 21.9% (P < .001) and a 33% increase in LVV (P = .004) in patients with MS.30 A meta-analysis of 13 clinical trials, which included >13,500 patients with RRMS and used PBVC as the brain volume measurement method of choice, showed that disability progression during 2 years correlated with both brain atrophy (P = .001) and T2-LV (P < .001).36 We used baseline T2-LV only as a covariate in this study because we did not aim to explore the effect of T2-LV on disability progression/disability improvement/stable status during the follow-up. Previous studies reported less accrual of T2-LV in patients with disability improvement, compared with those with disability progression.13,15,16,18,19
In the Comparison of Alemtuzumab and Rebif Efficacy in Multiple Sclerosis (CARE) MS-I and II3,37 randomized, controlled, 2-year studies of alemtuzumab for patients with RRMS versus patients treated with high-dose high-frequency interferon-β-1a, disability improvement was detected in a significantly higher proportion of the patients treated with alemtuzumab. There was also a significant reduction in brain volume loss in alemtuzumab compared with interferon-β-1a-treated patients. In OPERA I and II clinical trials,16 821 and 835 patients with RRMS received intravenous ocrelizumab, 600 mg (anti-CD20 humanized antibody) versus high-dose high-frequency interferon-β-1a for 96 weeks, respectively. The ocrelizumab arm showed a 33% higher proportion of disability improvement (secondary end point), which reached statistical significance compared with interferon-β-1a (pooled data). Patients receiving ocrelizumab also showed significantly lower brain volume loss compared with interferon-β-1a. However, the relationship between disability improvement and slowing down of brain volume loss in the above-mentioned studies was not explored.
The present study had some limitations. First, we did not take into consideration biologic confounding factors that may have an impact on brain atrophy, such as dehydration, diurnal brain volume changes, menstrual cycle, pseudoatrophy due to use of various DMT, and cardiovascular, environmental, and genetic risk factors and comorbidities.10,38 However, we hypothesize that due to the size and patient composition of the sample, such confounders are mitigated when assessing group effects. Another limitation is that we had to restrict disability status determination to the 5-year EDSS score change, without the 3- or 6-month confirmation of sustained effect. However, it is unlikely that true prevalence of disability progression or disability improvement was skewed by this assessment, especially because we excluded patients who had disease activity in the 30 days before clinical and MR imaging examinations. Another limitation could be related to the absence of spinal cord atrophy assessment. Therefore, future prospective, multicenter studies should confirm our preliminary findings and explore various other conventional and nonconventional MR imaging techniques in relation to development of disability improvement.
CONCLUSIONS
This is one of the first longitudinal studies to evaluate the evolution of brain atrophy in those patients with MS who improve in disability, compared with those who remain stable or progress, in a large cohort of patients followed for several years in a clinical routine. Our results suggest that there is significantly less brain atrophy development in those patients with MS who improve with time, compared with those who progress in their disability.
ACKNOWLEDGMENTS
The authors would like to thank all the subjects who participated in this study.
Footnotes
Research reported in this publication was funded by the National Center for Advancing Translational Sciences of the National Institutes of Health under award No. UL1TR001412.
The content is solely the responsibility of the authors and does not necessarily represent the official views of the National Institutes of Health.
Disclosures: Michael G. Dwyer—UNRELATED: Consultancy: EMD Serono; Grants/Grants Pending: Novartis, Celgene, Keystone Heart, Genentech, money paid to the individual. David Hojnacki—UNRELATED: Consultancy: Biogen, Genentech, EMD Serono, Bristol Myers Squibb; Payment for Lectures Including Service on Speakers Bureaus: Biogen, Genentech, EMD Serono, Bristol Myers Squibb. Channa Kolb—UNRELATED: Payment for Lectures Including Service on Speakers Bureaus: I served on speakers bureaus for Teva Pharmaceutical Industries, Biogen, EMD Serono, Alexion, Novartis, and Mallinckrodt. Bianca Weinstock-Guttman—UNRELATED: Board Membership: Biogen, Genentech; Consultancy: Biogen, Novartis, Genentech, Mallinckrodt, EMD Serono, Celgene; Grants/Grants Pending: Biogen, Novartis, Genentech, Celgene*; Payment for Lectures Including Service on Speakers Bureaus: Biogen, Novartis, Genentech, EMD Serono. Robert Zivadinov—UNRELATED: Consultancy: Celgene, Novartis, Sanofi, Immunic; Grants/Grants Pending: Celgene, Novartis, Sanofi, Mapi Pharma, Keystone Heart, V-Wave Medical, Protembis, Boston Scientific*; Payment for Lectures Including Service on Speakers Bureaus: Celgene, Novartis, Sanofi, EMD Serono. *Money paid to the institution.
Indicates open access to non-subscribers at www.ajnr.org
References
- Received November 24, 2019.
- Accepted after revision June 1, 2020.
- © 2020 by American Journal of Neuroradiology


