
Abstract
BACKGROUND AND PURPOSE: Brain metastases are a common finding on brain MRI. However, the factors that dictate their size and distribution are incompletely understood. Our aim was to discover a statistical model that can account for the size distribution of parenchymal metastases in the brain as measured on contrast-enhanced MR imaging.
MATERIALS AND METHODS: Tumor volumes were calculated on the basis of measured tumor diameters from contrast-enhanced T1-weighted spoiled gradient-echo images in 68 patients with untreated parenchymal metastatic disease. Tumor volumes were then placed in rank-order distributions and compared with 11 different statistical curve types. The resultant R2 values to assess goodness of fit were calculated. The top 2 distributions were then compared using the likelihood ratio test, with resultant R values demonstrating the relative likelihood of these distributions accounting for the observed data.
RESULTS: Thirty-nine of 68 cases best fit a power distribution (mean R2 = 0.938 ± 0.050), 20 cases best fit an exponential distribution (mean R2 = 0.957 ± 0.050), and the remaining cases were scattered among the remaining distributions. Likelihood ratio analysis revealed that 66 of 68 cases had a positive mean R value (1.596 ± 1.316), skewing toward a power law distribution.
CONCLUSIONS: The size distributions of untreated brain metastases favor a power law distribution. This finding suggests that metastases do not exist in isolation, but rather as part of a complex system. Furthermore, these results suggest that there may be a relatively small number of underlying variables that substantially influence the behavior of these systems. The identification of these variables could have a profound effect on our understanding of these lesions and our ability to treat them.
In patients with cancer, brain metastases are a common finding on MR imaging, and their presence has important implications for staging and treatment. Metastases to the brain are a well-established but incompletely understood process. Although the hematogeneous spread of tumors to the brain is widely accepted, the mechanisms responsible for malignant cell clusters establishing themselves and becoming detectable masses remain unclear. A multitude of factors may potentially play a role, including factors specific to the metastatic tumor cluster cells, those specific to the local tissues at the deposition site, and systemic factors affecting the entire patient. An increased understanding of which variables dictate the behavior of this complex system would be invaluable in advancing our knowledge of brain metastases, as well as in advancing our ability to detect, make prognoses for, and treat metastatic lesions.
We have anecdotally noted that intracranial metastases seem to present with a limited array of size distributions across all patients, regardless of age or primary tumor type. In patients with multiple intracranial metastases, there is often 1 relatively large metastasis and a number of smaller metastases. This pattern seems to be independent of the number of metastatic lesions within the brain. These findings appear to be inconsistent with a typical Gaussian distribution of lesion sizes, in which tumor sizes are evenly distributed about a mean. In this study, we attempted to elucidate the specific distribution that would best explain this observation.
MATERIALS AND METHODS
We searched all patient records between February 1, 2016, and July 1, 2017, for MR imaging reports of intracranial metastases. We then excluded patients who had previously treated metastases or metastases based in the dura. This search revealed 105 patients with untreated, parenchymal metastases. Subsequently, patients with fewer than 3 metastases were omitted because these metastases could not be accurately plotted for nonlinear distributions. This criterion reduced our study population to a total of 68 eligible patients.
For each patient, axial T1-weighted, contrast-enhanced spoiled gradient-echo sequences were examined, and a diameter was recorded for each metastatic lesion. Each lesion was measured manually by an experienced subspecialty board-certified neuroradiologist. Diameter measurements were acquired at the midpoint of each lesion in the craniocaudal plane, and the long and short axis measurements were averaged in cases of nonspherical lesions to obtain a diameter. These measurements were then used to calculate a volume for each tumor by the equation ; for these purposes, a spherical shape was assumed.
The Shapiro-Wilk test for normality was performed for each patient. The null hypothesis tested that the data were normally distributed, and significant P values reflected non-normality. Each volume measurement was then placed in a rank-order distribution and plotted for each individual patient (Fig 1). The resulting curves were then compared with 11 possible distributions using regression curve-fit analysis. The possible distributions included linear, logarithmic, inverse, quadratic, cubic, compound, power, “S,” growth, exponential, and logistic plots. Coefficient of determination values, designated by R2, were generated for each patient and curve type using SPSS software (IBM, Armonk, New York). The R2 value is a measure of the goodness-of-fit of data to a particular model and ranges from 0 to 1. This value indicates what portion of the variability seen within a given dataset can be explained using the chosen model. The curves with the highest R2 value for each patient were then collected and grouped on the basis of curve type, with power law and exponential curve types being the most common.

Example of a rank-order distribution of the volumes of intracranial metastases in 1 patient (patient 37). Used with permission from Barrow Neurologic Institute, Phoenix, Arizona.
A logistic regression was used to determine whether the number of lesions was independent of the distribution “power” versus others. We also ran this model with power and exponential dichotomized against all other distributions.
Given that power law and exponential curve types best accounted for the tumor distribution in most patients, we then sought to determine whether the power law distribution or the exponential distribution was a better fit for our observed data. We calculated likelihood ratios for each patient’s lesions comparing the power law and exponential curves. The likelihood ratio test is used to compare 2 statistical models on the basis of the ratio of the probabilities of each model accounting for the observed data. The probability that a given model accounts for the observed data is called the “likelihood” for that model. Initially, the goodness-of-fit of observed data is compared with 2 models, in this case power and exponential distributions. The logarithm of the ratio of the 2 likelihoods—the R value—is then calculated. In our study, positive R values are consistent with the power distribution providing a better fit than the exponential distribution, with more extreme values suggesting a stronger likelihood than values close to zero. Conversely, negative values confer similar implications in favor of the exponential distribution over the power distribution.
Finally, each distribution was treated as a power law type [ ], and α values were calculated for each curve. The α value represents the slope of the linear distribution obtained by plotting a power distribution logarithmically.
RESULTS
The total number of metastases per patient (n = 68) ranged from 3 to 84, with a mean of approximately 11 metastases per patient.
The tumor distribution in 39 patients best fit a power distribution, with a mean R2 value of 0.938 ± 0.050. The next most prevalent curve type was exponential, accounting for 20 patients (mean R2 = 0.957 ± 0.050). The remaining 9 cases were composed of 5 cubic distributions (mean R2 = 0.985 ± 0.006), 1 logarithmic distribution (R2 = 0.972), 2 S distributions (R2 = 0.972, 0.998), and 1 inverse distribution (R2 = 0.962).
Results from the Shapiro-Wilk test suggest that tumor distributions were normal for 17 patients. Nine of these cases also fit power (n = 2), exponential (n = 4), cubic (n = 1), log (n = 1), and S (n = 1) distributions as demonstrated by P values < .05. The remaining 8 cases had R2 values for non-normal distributions that ranged from 0.762 to 0.993; however, associated P values exceeded .05.
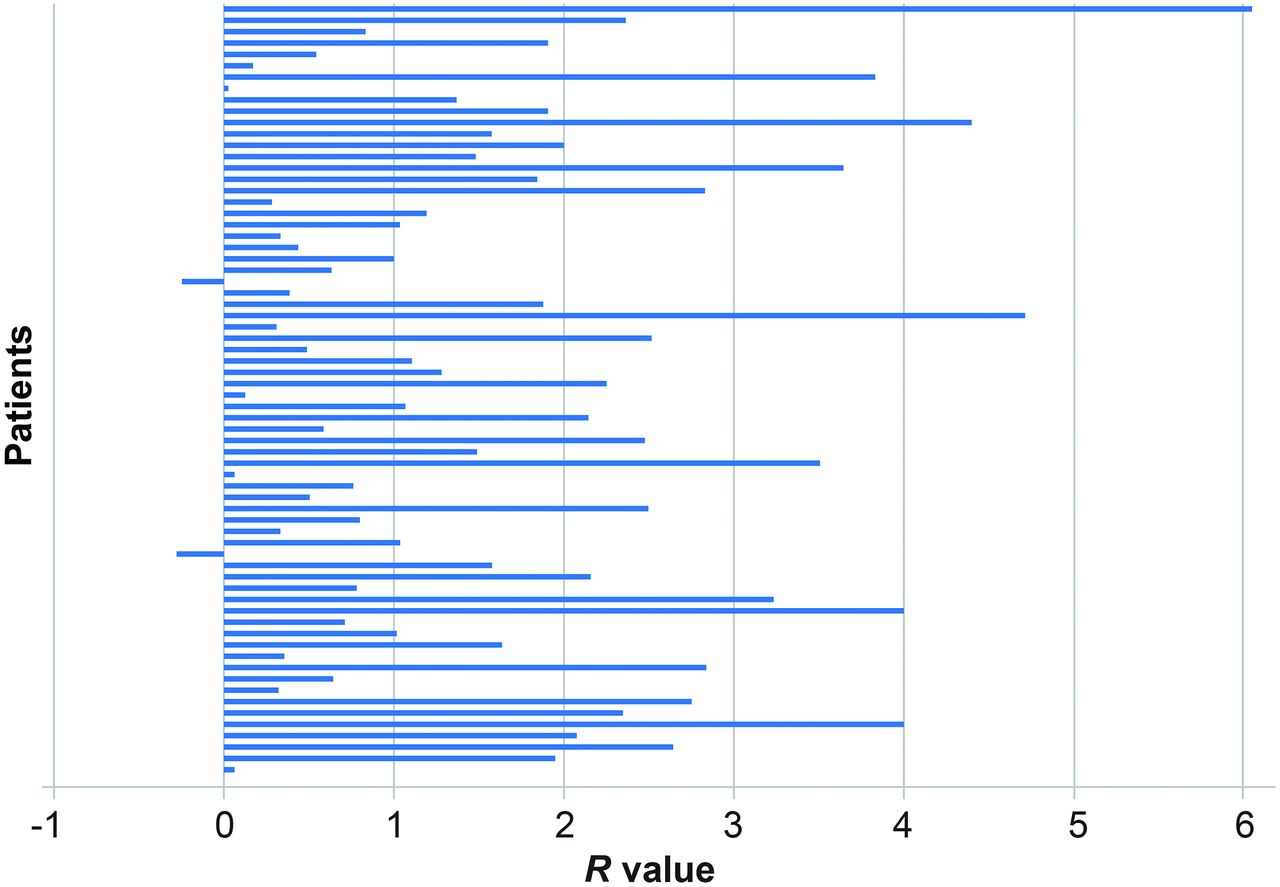
The tumor distributions in 66 of 68 patients had likelihood ratios skewed toward a power law distribution, with R values ranging from 0.020 to 6.049 (Fig 2). The mean R value was 1.596 ± 1.316.

Likelihood ratio analysis with R value distributions for all 68 patients. Values to the right of zero indicate that the distribution is more likely to fit a power law, with higher numbers indicating a stronger fit. Values to the left of zero indicate that the distribution is more likely to fit an exponential distribution. Used with permission from Barrow Neurologic Institute, Phoenix, Arizona.
Results from the logistic regression analysis regarding tumor number and distribution suggested that the number of lesions did not predict a power distribution (P = .246) or combined power and exponential distributions (P = .198).
Calculated α values ranged from 0.494 to 9.29. Data are summarized in the On-line Table.
DISCUSSION
Our results indicate that metastases within the brain largely follow a non-normal distribution, particularly in cases with >7 metastases.
These results also suggest that it is statistically reasonable to posit that brain metastases likely follow a size distribution best described by a power law. On the basis of our data, this relationship is independent of the number of metastases present.
Power law relationships exist within multiple areas of scientific inquiry, including biology, ecology, and economics. Some of the earliest work with such distributions in biology was performed by Rubner,1 in 1883, in which he found a relationship between the size and basal metabolic rate of various organisms.Nearly 50 years later, Swiss biologist Kleiber2 used a power law to relate oxygen consumption and body mass across multiple species of mammals (later dubbed the Kleiber law). Since that time, there have been many other applications of power laws. Some of the more well-known applications include the Pareto principle (regarding the distribution of wealth in a population), the Zipf law (describing the frequency of words in written language), and the Richter scale (measuring the strength of earthquakes). More recently, power laws have been used to elicit differences between “traditional” wars and modern insurgency conflicts and to assess the stability of such conflicts.3
Power law relationships can be expressed as follows:
 1)
1)
When these equations are plotted on a log-log curve, they yield a linear relationship:
 2)
2)
In Equation 2, the term α dictates the slope of the linear relationship.
Power law relationships fall broadly into 3 categories.4 The first category involves relationships that demonstrate self-symmetry. In these relationships, the α value is constrained to multiples of a single value. Examples of this type of power law relationship include Euclidian geometry (multiples of 1/3) and biologic allometries related to mass (multiples of 1/4). The second type of power law relationship is one in which the α values occur over a small range of values. Population densities of certain species of insects and birds are examples of this type of power law relationship.4 These 2 types of power laws are united in that they evidence self-similarity, which implies the presence of a small set of underlying variables accounting for the behavior of the system. The third type of power law involves those cases in which other distributions fit the data just as well as the power distribution, and although these relationships demonstrate apparent self-similarity across multiple values, this effect does not hold across multiple orders of magnitude.4
Our data suggest that the size distribution of intracranial metastases follows a power law distribution of the second type. To our knowledge, this has not yet been explained in the literature. Several previous works that have modeled tumor growth have suggested that tumor growth is more appropriately modeled using power laws, as opposed to the more commonly accepted Gompertz model.5-7 Additional work with cellular automata also supports a power law model for tumor growth in 1, 2, and 3 dimensions.8 This work was later supported with both in vivo and in vitro results, suggesting that tumor growth as a power law distribution should not be excluded.9 In addition to evidence of power law tumor growth, there is also evidence that the metastatic cell clusters released from primary tumors can also be modeled with a decaying power law.10
Our data suggest that intracranial metastases are not simply individual tumors growing in isolation but instead form part of a complex system in which these tumors are interdependent. Additionally, we suggest the possibility that a small number of variables may substantially influence the behavior of metastatic lesions within the brain. Although our study did not attempt to elucidate these factors, other work in this area has suggested multiple possibilities, including competition for local resources, host immune response, anti-angiogenic factors, or anti-cell cycle factors.11⇓⇓⇓⇓⇓-17 Recent work using mathematical modeling within this area supports a systemic effect over local factors and suggests that while the model best supports anti-cell cycle factors, a combination of anti-cell, anti-angiogenesis, and immune factors would also be a reasonable conclusion.18
This research, in combination with mathematic modeling based on these findings, could expand our understanding of the factors that influence the growth of metastases in the brain. Although work is already ongoing to identify factors that regulate metastatic growth within the brain, the addition of the insights detailed in this article may allow more focused mathematic modeling and an increased understanding of these processes. These, in turn, could have ramifications on new treatment for brain metastases or increasingly sensitive tests for the early detection of systemic metastatic disease. Furthermore, the nature of power laws may allow us to determine the stability of the system at a given point in time, thus allowing clinicians to be more selective with regard to the prognosis and efficacy of treatment.
Our methods were based on the work of Clauset et al,19 which describes a well-established and state-of-the-art method for elucidating power law relationships. However, there are limitations to the statistical methods for determining power law relationships that are particularly problematic in small datasets, which Clauset defines as n < 100. Clauset et al noted in their article: “In practice, we can rarely, if ever, be certain that an observed quantity is drawn from a power law distribution. The most we can say is that x is drawn from a distribution in the form of Eq. 1 [sic].”19
In our study, both the number of patients and the maximum number of tumors per patient are below this dataset threshold. However, single patients presenting with >100 metastases are rare, and we deemed it statistically incorrect to lump all tumors from multiple patients into a single dataset. In addition, given the limitations in orders of magnitude imposed by the fixed volume of the intracranial compartment and the minimum spatial resolution of current MR imaging technology, there is debate within the scientific community as to whether one can distinguish between the type 2 and 3 power law distributions described above.4 Within the bounds of these fundamental limitations, we believe that our findings represent a best possible scenario using current imaging techniques.
We are currently working to expand our dataset. We plan to assess whether primary tumor type has any effect on the power law relationship to determine whether size distribution could be useful in typing intracranial metastases. Data on patient outcomes could also help determine whether the magnitude of the α value could indicate the stability of the system and may help to predict the rapidity of disease progression in a manner similar to the conclusions of Bohorquez et al3 regarding the stability of insurgency conflicts. Furthermore, mathematic modeling using cellular automata is currently underway to preliminarily identify some of the potentially limited variables for targeted study based on our hypothesis.
CONCLUSIONS
We found that intracranial metastases follow a size distribution consistent with a power law distribution. This distribution pattern implies that these tumors are not growing in isolation but are rather interconnected parts of a complex system. Given the small range of α values, it is possible that a small number of variables may markedly influence the variance within this system and that identification of these variables could be valuable for making prognoses and treating patients with metastatic cancer. Further work, both theoretic and experimental, will be required to identify these factors. To this end, we intend to pursue mathematic modeling using cellular automata to preliminarily identify possible variables for more targeted investigation.
Acknowledgments
The authors thank the staff of Neuroscience Publications at Barrow Neurologic Institute for assistance with manuscript preparation. We also thank Rebecca Freed and Morgan Snopko of the School of Mathematical and Statistical Sciences at Arizona State University for assistance with likelihood ratios.
References
- Received July 22, 2019.
- Accepted after revision February 12, 2020.
- © 2020 by American Journal of Neuroradiology


Jump to section
Related Articles
Cited By...
- No citing articles found.