
Abstract
BACKGROUND AND PURPOSE: The basal forebrain contains multiple structures of great interest to emerging functional neurosurgery applications, yet many neuroradiologists are unfamiliar with this neuroanatomy because it is not resolved with current clinical MR imaging.
MATERIALS AND METHODS: We applied an optimized TSE T2 sequence to washed whole postmortem brain samples (n = 13) to demonstrate and characterize the detailed anatomy of the basal forebrain using a clinical 3T MR imaging scanner. We measured the size of selected internal myelinated pathways and measured subthalamic nucleus size, oblique orientation, and position relative to the intercommissural point.
RESULTS: We identified most basal ganglia and diencephalon structures using serial axial, coronal, and sagittal planes relative to the intercommissural plane. Specific oblique image orientations demonstrated the positions and anatomic relationships for selected structures of interest to functional neurosurgery. We observed only 0.2- to 0.3-mm right-left differences in the anteroposterior and superoinferior length of the subthalamic nucleus (P = .084 and .047, respectively). Individual variability for the subthalamic nucleus was greatest for angulation within the sagittal plane (range, 15°–37°), transverse dimension (range, 2–6.7 mm), and most inferior border (range, 4–7 mm below the intercommissural plane).
CONCLUSIONS: Direct identification of basal forebrain structures in multiple planes using the TSE T2 sequence makes this challenging neuroanatomy more accessible to practicing neuroradiologists. This protocol can be used to better define individual variations relevant to functional neurosurgical targeting and validate/complement advanced MR imaging methods being developed for direct visualization of these structures in living patients.
ABBREVIATIONS:
- DBS
- deep brain stimulation
- DRT
- dentatorubrothalamic tract
- PLIC
- posterior limb of the internal capsule
- STN
- subthalamic nucleus
- SUDC
- sudden unexplained death of childhood
- Vim
- thalamic ventrointermedius nucleus
- ZI
- zona incerta
Deep to the cortical surface, the basal ganglia, thalamus, and subthalamus are vital basal forebrain structures involved in the regulation of autonomic, motor, sensory, limbic, and endocrine functions.1,2 The metabolic demand of the basal forebrain exceeds the cerebral cortex in the resting state.3 Focal pathologic functional or structural changes can have serious clinical consequences due to the compact organization of the basal forebrain. The thalamus is a complex hub receiving subcortical sensory and motor input that projects to both the cortex and striatum.4 Thalamic infarction, demyelination, tumors, and other pathologies can cause chronic pain,5 sensory loss in multiple modalities, amnesia,6 dystonia,7 and other disorders.8,9 The subthalamus modulates basal ganglia output.10 Ischemic and hyperglycemic injuries of the subthalamic nucleus can result in hemiballism.11,12 The basal ganglia have complex connections to the cortical motor areas, including the precentral gyrus, supplementary motor area, and frontal eye fields.13 Basal ganglia pathologies cause movement disorders (eg, Parkinson, Huntington, and Wilson diseases), developmental disorders (eg, autism), or neuropsychiatric disorders (eg, Tourette syndrome and obsessive-compulsive disorder).14⇓⇓–17
Functional neurosurgery is a rapidly evolving field with multiple basal forebrain targets to reversibly inhibit selected structures with deep brain stimulation (DBS) or ablate those structures using MR imaging–guided focused sonography. The subthalamic nucleus (STN), globus pallidus internus, and thalamic ventrointermedius nucleus (Vim) are common targets to treat medically refractory hypo- and hyperkinetic movement disorders.18 Exploratory targets include the habenulopeduncular pathway or nucleus accumbens for treating refractory depression and substance abuse.19,20 Chronic electrical stimulation of selected thalamic subnuclei can reduce seizures in patients with epilepsy.21 Despite therapeutic successes, the mechanisms of DBS remain incompletely explained, partially due to limited anatomic and functional understanding of key structures. For example, DBS of the STN is used to treat Parkinson disease, though some suggest zona incerta stimulation may also be clinically important.22,23
Imaging tools to precisely define basal forebrain structures remain relatively unchanged despite rapid advances in therapeutics. To better understand the best anatomic targets and the actual mechanism for clinical improvement observed with functional neurosurgery, we need to directly visualize the relevant functional anatomy before and ideally after treatment. Conventional MR imaging has limited contrast resolution for basal forebrain anatomy; this is an active goal of MR imaging research. Susceptibility-weighted MR imaging,24⇓–26 ultra-high-field in vivo MR imaging,27⇓–29 and advanced diffusion techniques30⇓–32 can improve localization of key basal forebrain structures but are challenging to implement into routine clinical practice. Independent validation of diffusion methods has been limited.33 We developed a rapid 3T postmortem anatomic MR imaging protocol34 using an optimized 2D-TSE sequence with a clinical 3T MR imaging system and head coil available at most institutions. This protocol produces exquisite anatomic contrast for subcortical structures comparable to neuroanatomic atlases with histologic stains.2,35⇓–37 Here, we demonstrate how this TSE sequence can precisely delineate basal forebrain anatomy across multiple samples. This can inform future translational research efforts to better identify these structures using in vivo MR imaging.
Materials and Methods
Sample Procurement and Preparation
Whole-brain samples were obtained from an institutional review board–approved and Health Insurance Portability and Accountability Act–compliant multisite research study, the Sudden Unexplained Death of Childhood (SUDC) Registry and Research Collaborative,38 which used ex vivo MR imaging screening before gross pathologic assessment, brain cutting, and histopathology for forensic investigation. For each subject, the postmortem brain was removed intact by the local medical examiner, then suspended in a 4% formaldehyde solution for at least 21 days to reach near-equilibrium from presumed fixative-induced nervous tissue T2 changes.39 The brain was shipped to our institution, then washed continuously in water for 48 hours to eliminate MR imaging relaxation changes from the free aldehyde fixative solution.40 Individual brains with MR imaging data included for the figures (n = 13) in this study met the following criteria: 1) minimal injury to cerebral hemispheres or callosum from procurement, 2) no MR imaging or pathologic abnormality (outside the hippocampus) identified by a board-certified neuroradiologist and neuropathologist, respectively, 3) no T1-hyperintense fixation bands in the basal forebrain structures due to variable fixation penetration,41 and 4) a prerefrigeration postmortem interval of <24 hours.42 One of 14 consecutive SUDC samples was rejected due to procurement-induced division of the midbrain. The mean postnatal age for included specimens was 47.3 ± 34.8 months with a range between 22 and 142 months (10/13 specimens were between 24 and 48 months of age); 6/13 specimens were from male subjects with SUDC. After imaging was completed, brains were returned to the SUDC research study for brain cutting within 7–10 days.
Whole-Brain MR Imaging Protocol
Each brain was immersed in water inside a custom 3D-printed container specifically designed to conform to a 64-channel head and neck coil on a 3T Prisma MR imaging scanner (Siemens, Erlangen, Germany). Sealed water-filled disposable powderless latex medical gloves were gently wedged between the container and brain to prevent motion. Scout sequences identified the brain position, and then 2D, high-resolution TSE MR imaging sequences of the whole brain were obtained in coronal, sagittal, and axial planes relative to the intercommissural plane. Optimization of sequence parameters for contrast resolution of small structures in the postmortem brain using TSE sequences with 3T MR imaging was reported separately.34 T2-weighted TSE sequence parameters were the following: TR = 5380 ms, TE = 53 ms, echo-train length = 7, echo spacing = 10.8 ms, bandwidth = 415 Hz/pixel, slice thickness and number = 0.8 mm × 116 (no interslice gap), in-plane resolution = 0.35 × 0.35 mm, concatenations = 2, averages = 10, total time = 2 hours (full protocol available on request). The current scanner software limits the number of slices to 128, so whole-brain imaging with isotropic 350-μm voxels was not possible. In selected cases, additional images were obtained empirically by stepwise angular rotations relative to the cardinal image planes to illustrate specific anatomic relationships within the basal forebrain.
MR Image Analysis
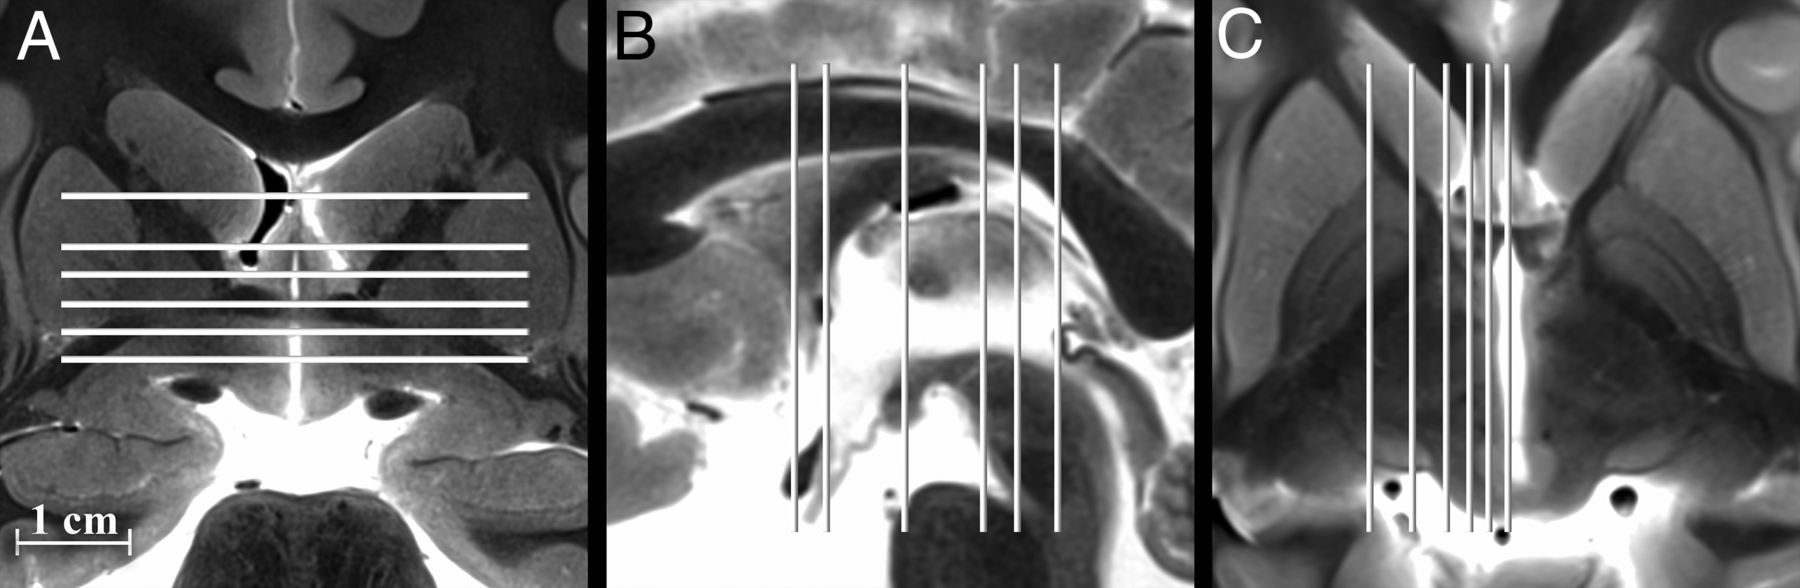
For each subject, we identified basal forebrain structures at 6 axial, sagittal, and coronal levels (Fig 1). The MR images were labeled with standard nomenclature.35,36,43,44 All figures used radiologic image orientation, and only structures identified in all samples by consensus between 2 board-certified neuroradiologists were reported. Terminology for the relative course and spatial positions of adjacent structures was limited to superior versus inferior, medial versus lateral, and anterior versus posterior to avoid confusion. Measurements of the right and left subthalamic nucleus and selected left hemisphere structures were obtained by a single board-certified neuroradiologist for 11 samples (2 samples did not have coregistered sagittal images). The anterior-posterior and left-right dimensions were measured in the axial plane for the left mammillothalamic tract, column of the fornix, and postcommissural fornix (above and below the anterior commissure, respectively). The anteroposterior and superoinferior dimensions of the left ansa lenticularis were measured in the sagittal plane 5 mm off midline. For these measurements, the area of an ellipse was calculated. The largest in-plane dimension of the left and right subthalamic nuclei was measured in each cardinal plane using the image in which the subthalamic nucleus appeared largest. Similarly, the angle formed by the long axis of the subthalamic nucleus in each cardinal image plane relative to the orthogonal plane was measured; the structure was oriented inferomedial to superolateral in the coronal plane, anteromedial to posterolateral in the axial plane, and anterosuperior to posteroinferior in the sagittal plane.

Selected coronal, sagittal, and axial images of the postmortem basal forebrain illustrating the serial imaging planes for Fig 2 and On-line Figs 1 and 2, respectively. Table 1 provides a complete list of labeled anatomy for all figures, indicated by the numbers in parentheses in the legends. The familiarity of T2 contrast and multiple imaging planes provided in this study should help facilitate learning the complex neuroanatomy of the basal forebrain.
The neuroradiologist determined the stereotactic coordinates relative to the intercommissural point for the most inferior, lateral, and posterior point of the subthalamic nucleus where it forms a discrete border with the more hyperintense inferior zona incerta. Note that this fiducial will usually be inferior and lateral to the desired deep brain stimulator (DBS) electrode tip target but was chosen because it can be precisely measured to assess right-left and individual variability in the STN position. The within-sample differences between each of the above right and left measurements were compared using paired-sample Wilcoxon signed rank tests, with P < .05 considered significant. The mean difference detectable with 80% statistical power for n = 11 samples was estimated by multiplying the SD of the difference by 0.94. A global coefficient of variation was calculated (right- and left-sided data combined, n = 22) to estimate variability for each of these features. In addition, the neuroradiologist identified which segment of the subthalamic nucleus was targeted by using the a priori coordinates for DBS electrode tip placement in the medial-posterior-inferior subthalamus at our institution (11 mm lateral, 4 mm posterior, and 5 mm inferior to the intercommissural point); for this, the long axis of the subthalamic nucleus was divided into thirds, and the short axis was divided into quadrants defined as inferior-superior and medial-lateral (hence, 12 potential segments).
Results
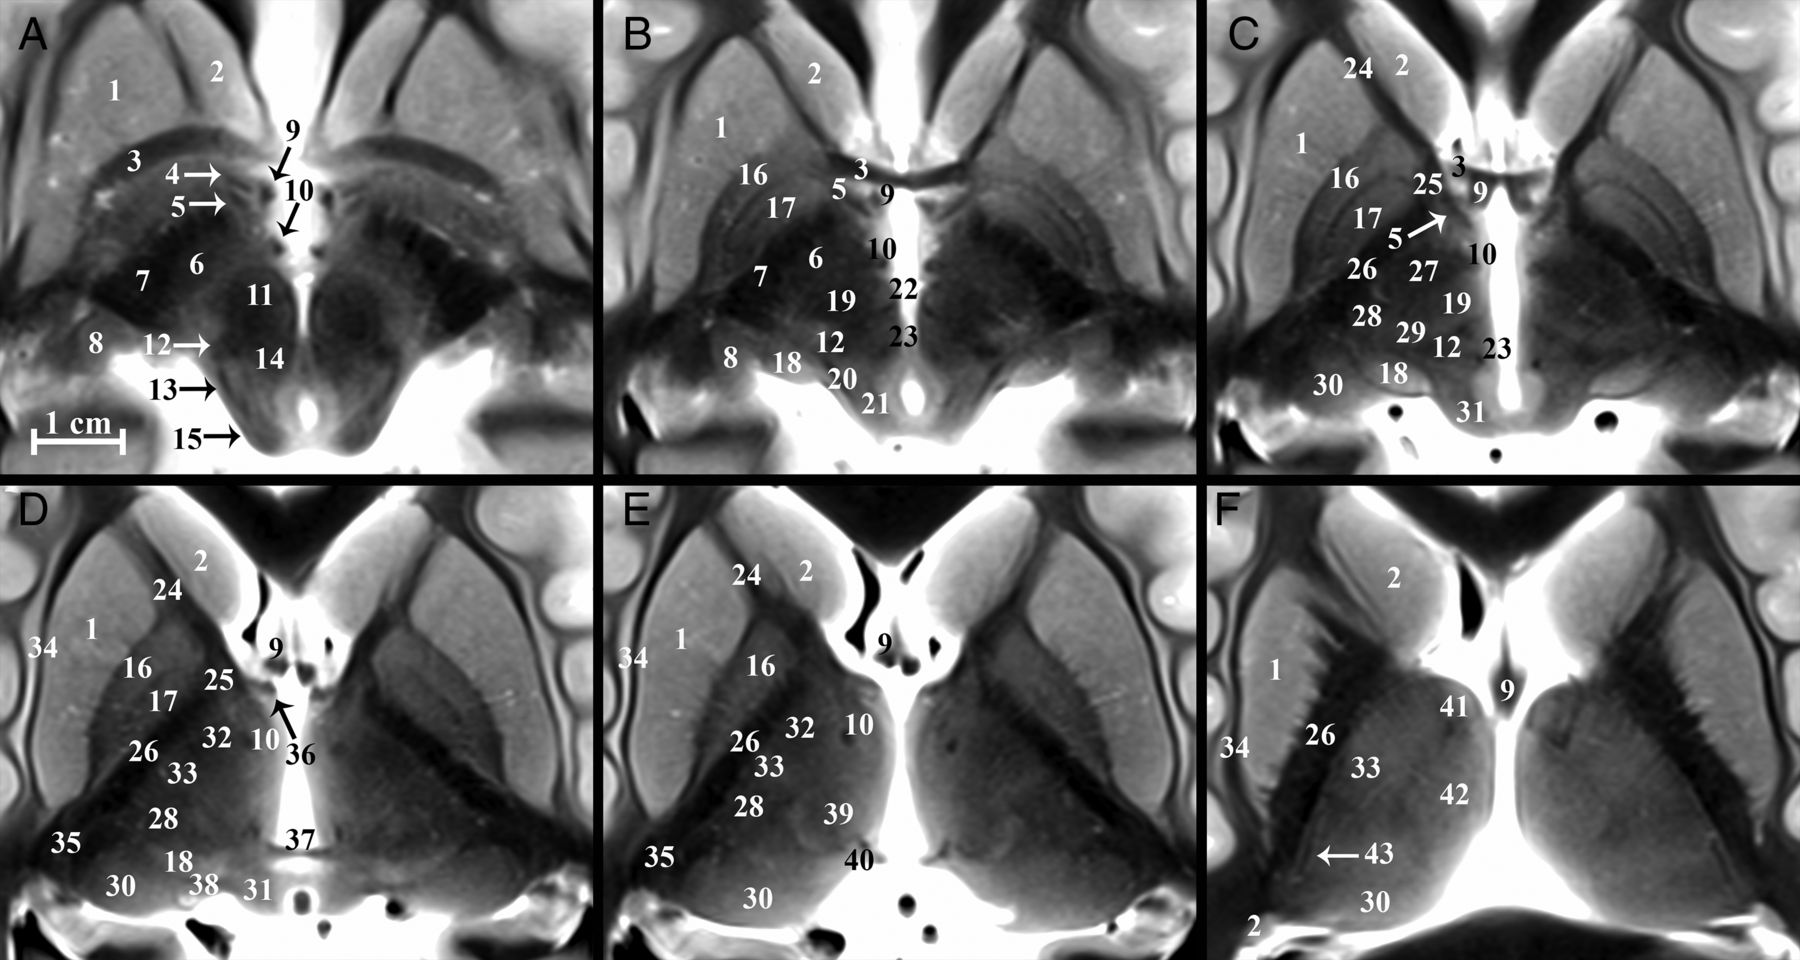
Diencephalic structures are shown in selected axial, coronal, and sagittal images (Fig 2 and On-line Figs 1 and 2). On-line videos also are provided for all 3 planes. On-line Fig 3 demonstrates the reproducibility of anatomic contrast for 4 specimens in selected axial and coronal planes. All labeled structures were identified for each subject by both board-certified neuroradiologists (Table 1), and the numbers in parentheses from this point on refer to Table 1. The TSE MR imaging contrast qualitatively correlated inversely with myelin staining for basal forebrain structures in histologic atlases.2,35,36,37 The darkest structures included the internal capsule (79), callosum (71), lenticular fasciculus (58), and postcommissural fornix (9). Intermediate hypointensity was observed in other myelinated structures, including the distal mammillothalamic tract (10), the thalamic internal medullary lamina (63), and the dentatorubrothalamic tract (19). The brightest structures included the posterior hypothalamus (54), geniculate nuclei (8 and 18), substantia nigra (59), and zona incerta (asterisk). We briefly describe and illustrate the complex anatomy of several basal forebrain structures of particular interest as current and emerging functional neurosurgery targets (all measurements are reported as mean ± SD for n = 11 specimens).

Serial inferior-to-superior axial images of the postmortem basal forebrain parallel to the commissural plane (A–F, −4, −2, 0, 2, 4, and 8 mm relative to the intercommissural plane, respectively). The globus pallidus internus (17) is a therapeutic DBS target for Parkinson disease and dystonia.18 The globus pallidus internus is separated from the externus (16) by a thin hypointense band, the internal medullary lamina (55 in On-line Fig 1). Note the 2 divisions of the globus pallidus internus (medial and lateral) separated by the accessory medullary lamina in B and C. Contrast is less conspicuous in the more superior thalamus.
Basal forebrain structures
Subthalamic Nucleus
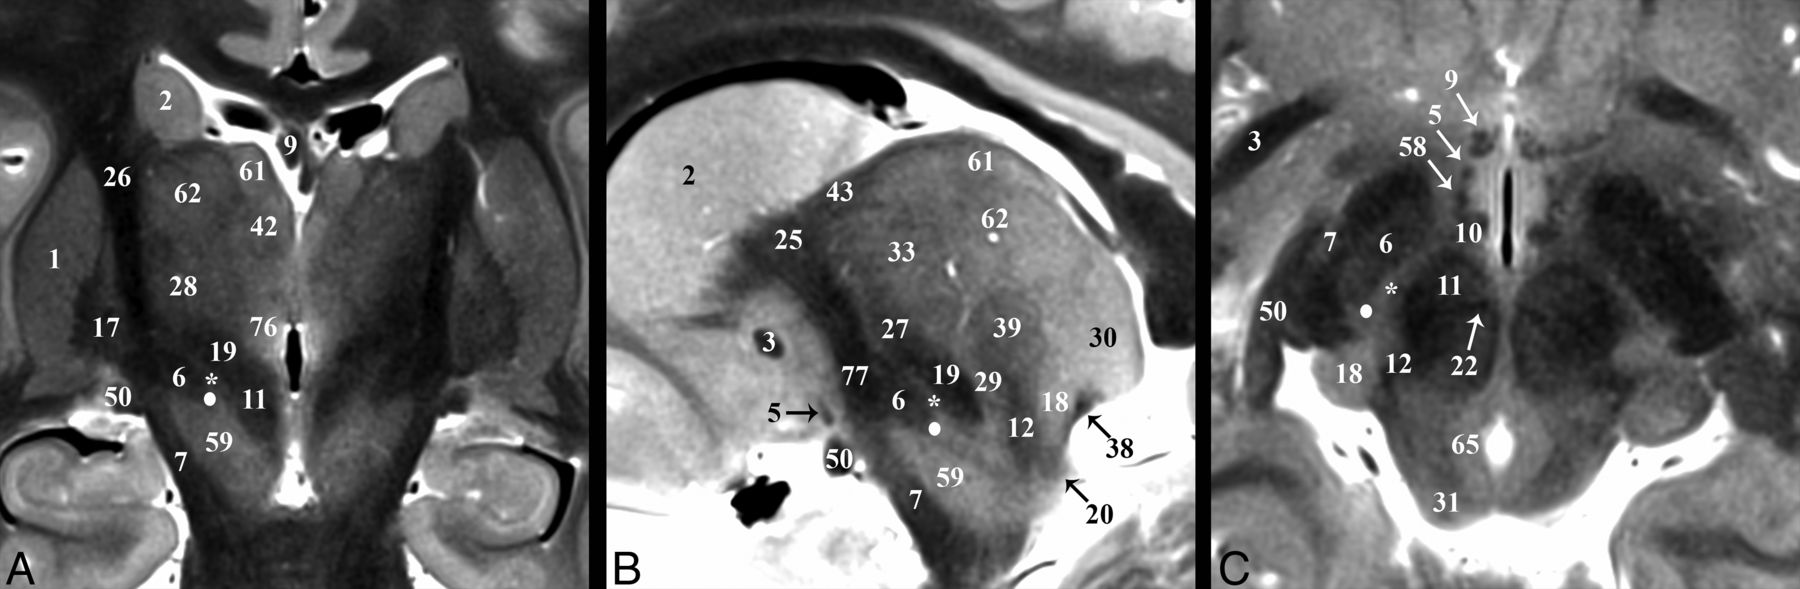
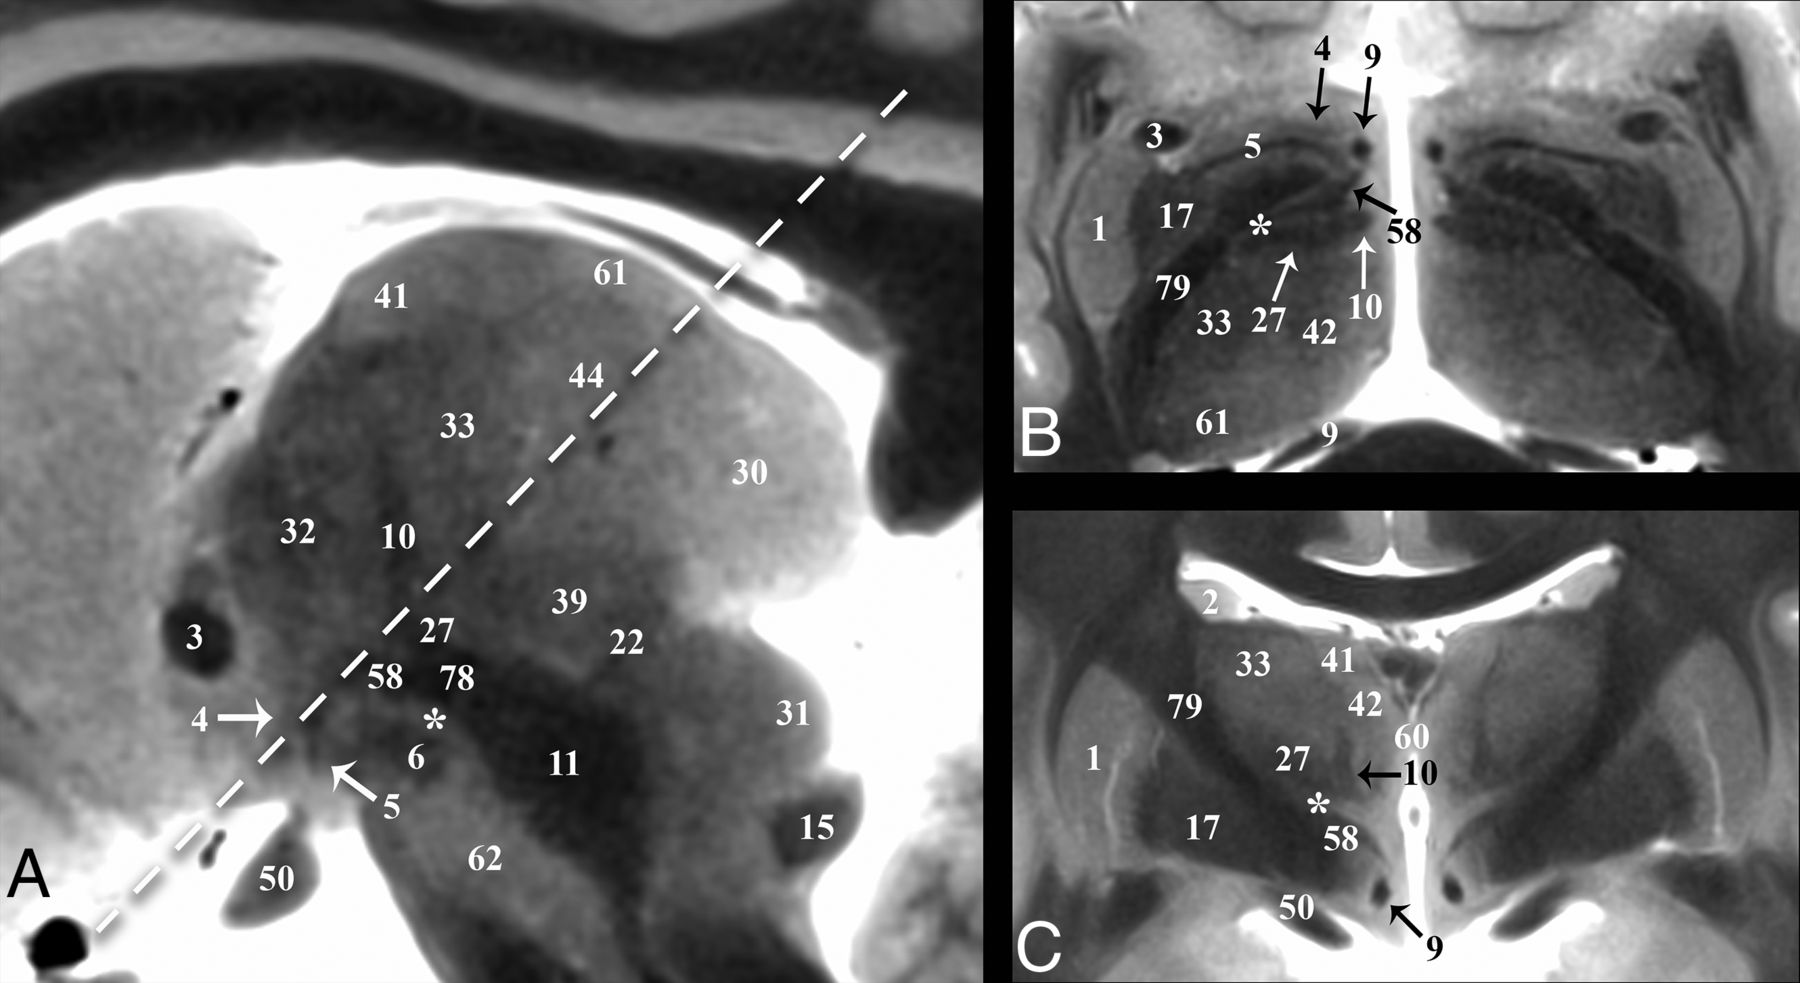
The subthalamic nucleus (6) modulates basal ganglia output and is the most common target of DBS for Parkinson disease.10 The STN is a biconvex hypointense structure at the mesencephalic-diencephalic junction, oriented oblique to all 3 standard planes (Fig 3). The anterolateral STN border is the more hypointense internal capsule, whereas the zona incerta (asterisk) is a thin hyperintense structure abutting the posterior and medial borders of the STN. The substantia nigra (59) is the inferomedial margin of the STN. Together, the corticonigral, pallidonigral, and nigrostriatal fibers appear as a thin, dark bundle dividing the posterolateral third of the substantia nigra as they course inferior, posterior, and lateral from the posterior inferior tip of the STN (Fig 2A and On-line Fig 1E). The subthalamic fasciculus (81) arises from the inferolateral STN border with bidirectional fibers that cross the internal capsule, connecting the STN and globus pallidus (17) (Fig 4D). Table 2 reports measurements of the STN and its oblique orientation relative to imaging planes defined by the commissures, along with stereotactic coordinates for its easily defined lateral-posterior-inferior border. There appeared to be 0.2- to 0.3-mm right-left differences in the anterior-posterior and superior-inferior lengths of the STN (P = .084 and .047, respectively); otherwise, no significant differences were observed. Individual variability for the subthalamic nucleus (ie, coefficient of variation) was greatest for long-axis angulation in the sagittal plane (range, 15°–37°), largest transverse dimension (range, 2–6.7 mm), and most inferior border (range, 4–7 mm below the intercommissural plane). The a priori institutional coordinates for targeting the electrode tip into the subthalamic nucleus were centered in the inferior-posterior third for 21/22 subthalamic nuclei and the inferior-middle third in 1/22 (right and left data combined; no anterior third targeting was identified). Lateral-half targeting was present in 6/11 nuclei both for right and left subthalamic nuclei (or 55% of targets).

Selected images illustrating the subthalamic nucleus (6) in the basal forebrain. Coronal, sagittal, and axial images show the subthalamic nucleus as a biconvex hypointense structure nestled along the medial margin of the internal capsule (26). B, The darkest portion of the internal capsule just anterior to the subthalamic nucleus represents the Edinger comb system (77) containing the pallidosubthalamic, pallidonigral, and nigrostriatal tracts. The small white circle represents the potential DBS electrode tip placement site (Table 2) in the inferior portion of the zona incerta (asterisk), which corresponds with a better therapeutic profile according to Plaha et al.22

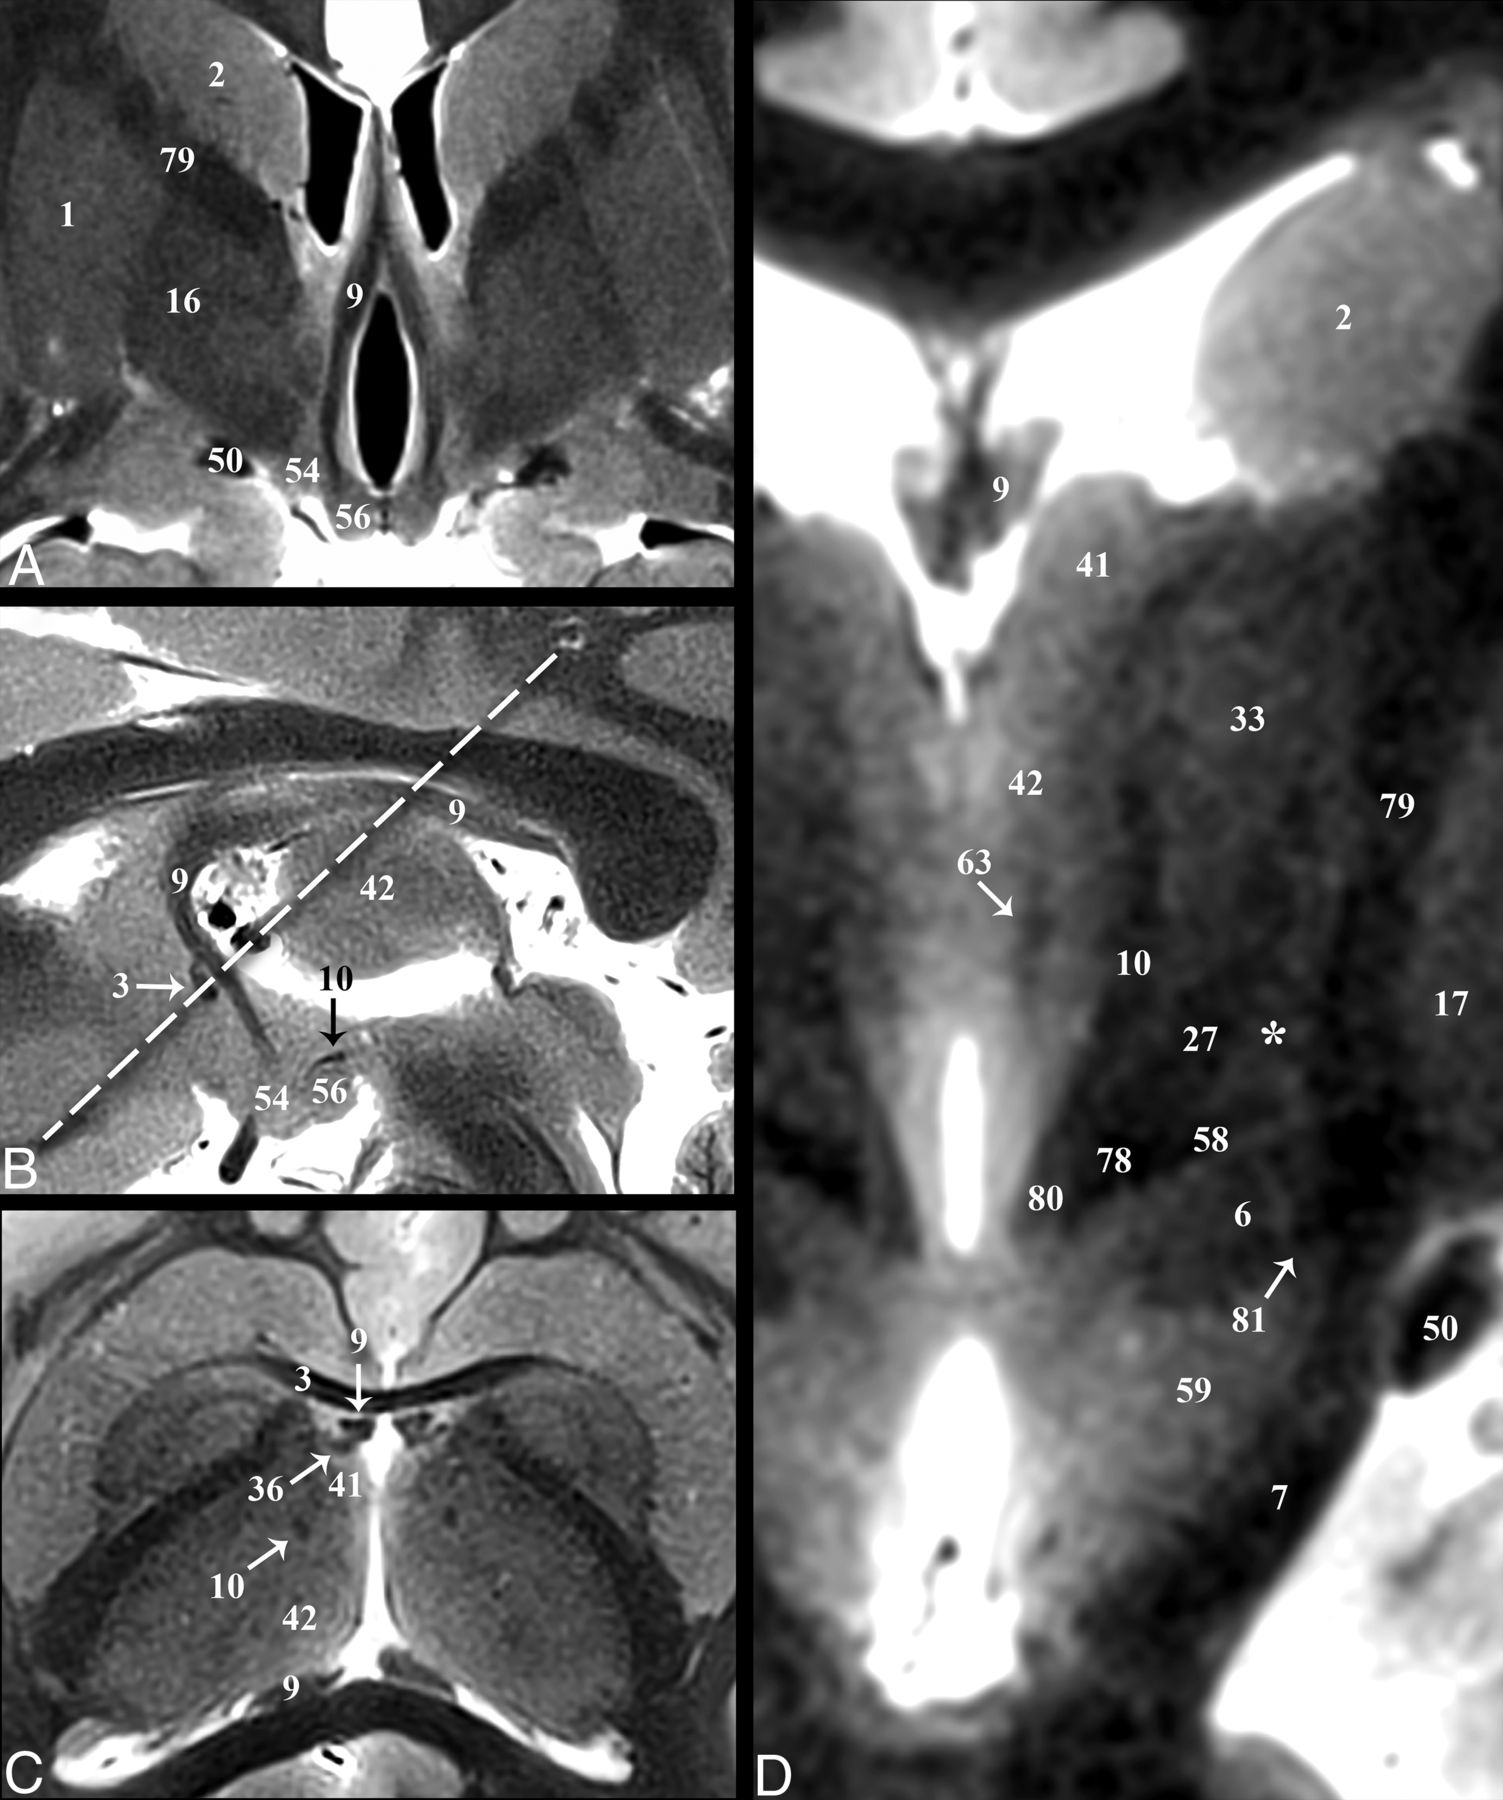
Selected images illustrating the hippocampal-thalamic pathways. Coronal, sagittal, oblique axial (the dashed line in B represents the oblique imaging plane for C), and magnified coronal images of the fornix (9) and mammillothalamic tract (10). A and B, The decreased size of the postcommissural fornix as it approaches the mammillary bodies (56) is likely due, in part, to the direct hippocampal pathway (36) in C, which bypasses the mammillary bodies to reach the anterior thalamic nuclei (41). D, Just medial to the Fields of Forel (78) and pallidofugal tracts, the principal mammillary tract (80) gives rise to the ascending mammillothalamic tract. Note the subthalamic fasciculus (81) and zona incerta (asterisk).
Measurements of the subthalamic nucleus in SUDC brains using TSE MRI contrast (n = 11)a
Zona Incerta
The functions of the zona incerta (ZI) are poorly understood, but it appears to involve sensory processing.45 We have used an asterisk to denote the ZI to visually emphasize that this structure is better defined by bordering structures and changes in shape at different points along the neuroaxis. The superior portion of the ZI appears as a thin hyperintense band on the TSE sequence superomedial to the inferior portion of the genu of the internal capsule (79), superior to the lenticular fasciculus (58), inferior to the thalamic fasciculus (27) (Figs 3 and 5B), and anterolateral to the dentatorubrothalamic tract (19) (Fig 6A). DBS inhibition of the mid- and inferior portions of the ZI may represent therapeutic targets for Parkinson disease.22,46 The midportion of the ZI appears as a thin hyperintense band medial to the STN and lateral to the red nucleus (Fig 3C). The medial border of the ZI in this region cannot be distinguished from the preleminscal radiation by TSE MR imaging; histology shows that the latter abuts the lateral margin of the red nucleus. The most inferior portion of the ZI is a round hyperintense region in the axial plane (Fig 3C) that is posterior to the STN and medial to the posterior internal capsule.

Selected images illustrating the pallidothalamic tracts. Sagittal, oblique axial (the dashed line in A represents the oblique imaging plane for B), and coronal images illustrating the complex 3D shapes and spatial relationships of the ansa lenticularis (5), lenticular fasciculus (58), and thalamic fasciculus (27). B, The ansa lenticularis originates from the inferomedial globus pallidus internus (17) and joins the lenticular fasciculus (H2 field of Forel) in the very hypointense prerubral H Fields of Forel (78). These pallidal efferents then ascend as the thalamic fasciculus (H1 Fields of Forel) to the ventral thalamus. The zona incerta (asterisk) is the bright signal intensity region in between lenticular and thalamic fasciculi in B and C. The subthalamic nucleus (6) can be seen in relationship to these structures in A. Note the dark structure just inferior to the 44 label and the dashed line is a thalamic perforating vessel.

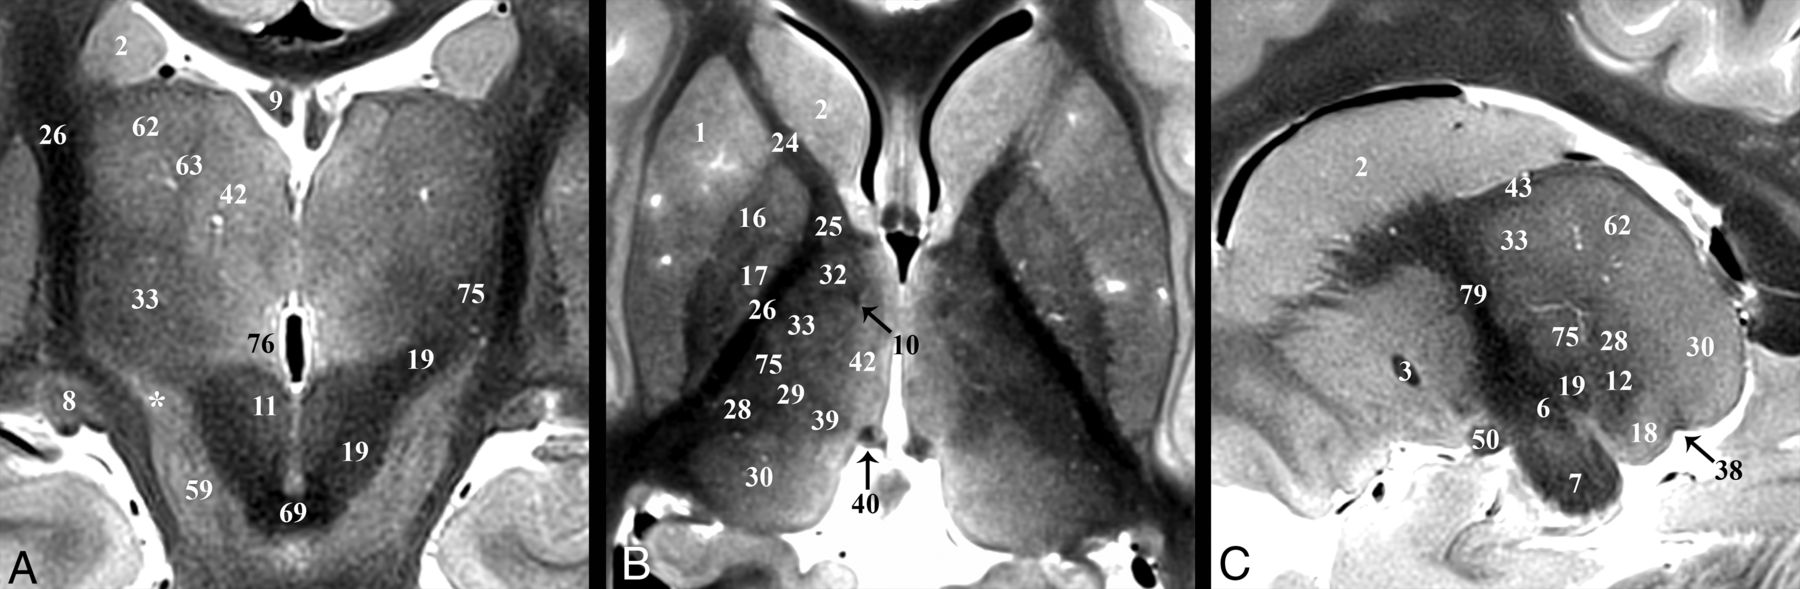
Coronal, axial, and sagittal images illustrating the superior ascent of the dentatorubrothalamic tract (19) to the Vim nucleus (75). A, Slight obliquity of the image allows depiction of the Vim and DRT on the left and the posterior aspect of the relatively more hyperintense nucleus ventrooralis (33) on the right (zona incerta labeled with asterisks). The relationship of the PLIC (26), nucleus ventrocaudalis anterior (28), and nucleus ventrocaudalis posterior (29) nuclei to the Vim is also illustrated. For completeness, the interested reader can find the proximal or prerubral component of the dentatorubrothalamic pathway also demonstrated in On-line Fig 3 of the previous report.57
Pallidothalamic Tracts
The pallidothalamic tracts carry efferents from the globus pallidus to the ventral thalamic nuclei (Fig 5).47 The ansa lenticularis (5) consists of fibers from the inferior globus pallidus internus (17) passing immediately inferior to the internal capsule genu, (79), which turns from an anterolateral to posteromedial position (Fig 5B) and ascends slightly to meet the descending lenticular fasciculus (58) just anterolateral to the proximal ascending portion of the mammillothalamic tract (10). The ansa lenticularis measured 1.8 ± 0.3 by 0.8 ± 0.1 mm in the sagittal plane (or a 1.1 ± 0.3 mm2 area). The lenticular fasciculus (field H2) represents confluent projections from the more central and superior portions of the internal globus pallidus that pass through the posterior limb of the internal capsule (PLIC) (this aspect is difficult to visualize because both structures are dark on TSE). These fibers become confluent along the medial border of the anterior third of the PLIC (Fig 3A, 4D, and 5B) and course inferomedially to meet the ansa lenticularis and form the thalamic fasciculus (27; field H1). Notably, this prerubral junction within the field of Forel (78; H) is one of the most hypointense structures visualized in the basal forebrain, suggesting dense myelination. The thalamic fasciculus fibers project posteriorly (lateral to the mammillothalamic tract) and then curve posterolaterally and superiorly to reach the lateropolaris (32) and ventrooralis (33) thalamic nuclei. The thalamic fasciculus is posterior and slightly superior to the lenticular fasciculus, but almost parallel, and the 2 structures are separated by the hyperintense superior portion of the ZI.
The ansa peduncularis (4) is a functionally unrelated but spatially proximate pathway to the pallidothalamic tracts that represents confluent projections from the amygdala, temporal, and olfactory cortex to the dorsomedial thalamic nucleus.48,49 This structure appears continuous with the anterior inferior thalamic peduncle, appearing as a sheet-like vertically oriented structure lateral to the postcommissural fornix, anterosuperior to the ansa lenticularis, posteroinferior to the anterior commissure, and superior to the optic tract (Fig 2A, On-line Fig 2D, and Fig 5). It is less compact and hypointense compared with the ansa lenticularis.
Thalamus and Dentatorubrothalamic Tract
Major thalamic nuclei, especially inferior and lateral ones, can be identified with TSE contrast. The medial PLIC border (26) was easily discriminated from the adjacent lateral sensorimotor thalamic nuclei: from anterior to posterior: nucleus lateropolaris (32), nucleus ventrooralis (33), Vim (75), nucleus ventrocaudalis posterior (29), and nucleus ventrocaudalis anterior (28) (Fig 6B). Functional neurosurgeons traditionally use a nomenclature for the thalamic nuclei whereby the ventralis lateralis (VL) nucleus is subdivided into an anterior nucleus ventrooralis posterior (Vop) and posterior Vim nucleus. Extending from the contralateral brain stem via the decussation of the superior cerebellar peduncle (69) is the dentatorubrothalamic tract (19, DRT), which envelops the red nucleus (11) before terminating in the Vim (75) (Fig 6A). An additional cerebellar thalamic connection that bypasses the red nucleus can be seen in On-line Fig 2E, -F and Fig 3B between the cerebellothalamic tract (inseparable from the DRT [19] with TSE) and the thalamic fasciculus (27). The Vim is an intermediate-intensity nucleus located in the midportion of the inferolateral thalamus and serves as a common target for DBS treatment of essential tremor.18 It is posterior to the inferior half of the relatively more hyperintense nucleus ventrooralis (33) (Fig 6A, -B). The hyperintense nucleus dorsalis oralis (62) sits along the superior border of the Vim (Fig 6A, -C). The nucleus ventrocaudalis anterior and nucleus ventrocaudalis posterior make up the posterior and posteromedial borders of the Vim and are slightly more hypointense and hyperintense, respectively (On-line Fig 2E, -F and Fig 6B, -C).
The internal medullary lamina is visible as a thin dark sheet that envelops the centralis nucleus (39) (Fig 2E and On-line Fig 1F) and the anterior nucleus (41) anterosuperiorly (Fig 2F and On-line Fig 1E). The dark fibers of the medial lemniscus (12) define the inferior margins of the nucleus ventrocaudalis anterior and the anterior margin of the hyperintense medial geniculate nucleus (18) (On-line Fig 2F). The medial geniculate nucleus is further bordered inferomedially and superolaterally by the brachium of the inferior colliculus (20) and superior colliculus, respectively (38) (Fig 2B, -C). The hyperintense lateral geniculate nucleus (8) is best identified in the coronal plane at the terminations of the hypointense optic tract (50) (On-line Fig 1D, -F).
Fornix and Mammillothalamic Tract
The fornix (9) is the major output pathway from the hippocampus to the medial diencephalon and serves episodic memory.50,51 The fornix originates from the fimbria of the hippocampus and then curves superiorly and then anteriorly (posterior and/or superior to the medial thalamus and third ventricle). Anteriorly, the compact hypointense fornix columns are superior to the anterior commissure (3), forming the anteromedial margins of the foramen of Monro (Fig 4). Projections of the precommissural fornix are not distinct from the septal and other nuclei. The diagonal band of Broca (52) appears as a faint dark band anterior to the commissure but does not appear continuous with the fornix columns (On-line Fig 1A). The fornix and postcommissural fornix immediately above and below the anterior commissure measured 3.5 ± 0.9 by 1.8 ± 0.4 mm and 2.4 ± 0.4 by 1.8 ± 0.2 mm, respectively, (anterior-posterior by left-right in the axial plane). Below the commissure was a 1.4-mm2 or 39% decrease in cross-sectional area (t test, P = .001). Posterior and slightly superior to where this focal narrowing occurs (Fig 4A, -B) is a separate hypointense compact lateral projection (Fig 4C). This represents the less well-understood direct hippocampal-diencephalic pathway (36) that bypasses the mammillary bodies and may be important for recollective recognition memory.50 The proximal aspect of this projection abuts the inferolateral margin of the stria medullaris. It then ascends superiorly and spreads/thins across the anterior surface of anterior thalamic nucleus (41). The postcommissural fornix descends and curves posteriorly to envelope the superolateral surface of the hyperintense mammillary bodies (56) (On-line Figs 1C and 2B and Fig 4A).
The mammillothalamic tract (10) is a separate hypointense white matter bundle originating from the anteromedial and superomedial surfaces of the mammillary bodies, which first courses posterolaterally for 8–10 mm (with a concave appearance directed anterior and lateral) (On-line Fig 2B, -C). Medial to the thalamic fasciculus (27), the mammillothalamic tract turns sharply upward and ascends vertically to envelope the most inferior and inferolateral surfaces of the anterior nucleus of the thalamus (Fig 4D). The proximal vertical portion of the mammillothalamic tract measured 1.8 ± 0.4 by 1.4 ± 0.2 mm in the axial plane (or a 1.9 ± 0.5 mm2 area) with the more distal portion becoming less compact and distinct.
Discussion
We used a standard clinical 3T MR imaging system and 2D-TSE sequence to generate excellent contrast resolution of basal forebrain anatomy from multiple ex vivo whole-brain specimens. Previous postmortem MR imaging microscopy studies have benefited from ultra-high-field MR imaging (>3T)29,52,53 but required dissected samples, long acquisition times, special radiofrequency coils, and a dedicated research support staff, which limits widespread application. Excellent anatomic contrast was derived from the MR imaging sequence without time-consuming off-line mathematic analysis or model-based reconstructions for relaxation mapping54,55 or advanced analytical diffusion representations.30,56 Validation of tractography and other advanced diffusion contrasts remains limited,33 whereas TSE contrast largely recapitulates contrast observed over the past 100+ years in histology atlases of the human brain. The current TSE protocol can be used to both validate and complement diffusion MR imaging and tractography for visualizing these structures (or other novel advanced MR imaging methods). Our protocol can be used by many readers using available clinical equipment with reasonable scan times. We are currently developing a similar 3D-TSE approach that overcomes coverage limitations of the 2D sequence, facilitates higher isotropic spatial resolutions, and can more efficiently generate multiplanar reformats from a single acquisition.
We sought to create an accessible introduction to the subcortical anatomy poorly visualized with current clinical MR imaging protocols. This TSE sequence was previously applied to brain stem anatomy.57 Here, we focused on potential functional neurosurgery targets that are not well-understood by clinical neuroradiologists. Almost all clinical brain MR imaging protocols include T2-weighted contrast so that neuroanatomy using this TSE protocol may be easier to learn, retain, and mentally map onto clinical MR imaging scans obtained at lower spatial resolution. Compared with using postmortem brains for gross dissection for teaching neuroanatomy, MR microscopy quickly produces “digital specimens” that do not degrade with time or repeated use. The same specimen can be scanned orthogonally or in many different oblique planes and at different spatial resolutions without tissue destruction. Furthermore, these specimens can be reviewed using clinical PACS or other readily available software tools and can be easily shared across individual teaching sites. Finally, it is straightforward to apply this protocol to multiple whole-brain samples, increasing trainee exposure to normal individual anatomic variations (On-line Fig 3).
The direct or indirect imaging identification of target basal forebrain structures is a key requirement for modern functional neurosurgery. However, conventional MR imaging poorly displays internal anatomic boundaries of several clinically targeted structures. Functional surgery therefore relies on indirect targeting using measurements of intercommissural distances, third ventricle widths, or other calculations from stereotactic atlases58 originally derived from internal landmarks on pneumoencephalography.59 A common concern is that indirect targeting methods are vulnerable to individual variability in subthalamic and thalamic nuclei positions, or even right-left asymmetries within the same individual.60⇓⇓⇓⇓–65 This vulnerability may result in a decreased therapeutic profile and increased risk for adverse effects such as motor contractions, perioral numbness, and imbalance when targeting the thalamic Vim in patients with essential tremor.66
A previous study reported a large range of coronal angulations for the long axis of the subthalamic nucleus in the sagittal plane (range, 15°–57°) that resulted in the DBS electrode tip sometimes terminating in the zona incerta instead of the inferomedial subthalamus. This zona incerta stimulation was associated with potentially better therapeutic outcomes, but different adverse events.22 Hence, 1- to 2-mm targeting differences can be quite clinically important in the complex, compactly-organized basal forebrain. In 11 SUDC brains, we only observed small 0.2- to 0.3-mm right-left differences for superior-inferior and anterior-posterior lengths in the STN (P = .047 and .084, respectively) (Table 2). The results had an estimated 80% statistical power to detect a right-left difference of greater than 0.3- to 0.6-mm length, 5.1°–5.5° angulation, or 0.3–0.5 mm in stereotactic coordinates. Institutional coordinates resulted in similar target locations for right and left nuclei, but with equal placement of the electrode tip in either the medial or lateral segment of the posterior third of the STN. The medial-lateral dimensions of the subthalamic nuclei also showed the largest coefficient of variation (Table 2). This may be because of less contrast resolution between the STN and adjacent inferior internal capsule. The angulation in the sagittal plane and the most inferior stereotactic point for the subthalamic nucleus also showed larger individual variation as reflected by the coefficient of variation. Similarly, Morel67 reported greater individual variation in lateral measurements for thalamic structures relative to the midsagittal plane and recorded a ∼1.5-mm variation in microelectrode depth for entering the posterior subthalamus in 20 patients. Other measurements showed little individual variability, and we observed much less angular variation in the coronal plane (range, 48°–69°) compared with a previous report.22 These data illustrate that postmortem MR imaging with high-resolution TSE sequences facilitates performing these types of measurements in many brain samples, and further research using this paradigm may be used to better understand stereotactic targeting.
Size measurements for selected myelinated structures within the basal forebrain reflect dark structure to bright background contrast. These measurements may be affected by the degree of myelination and the number and diameter of axons. The postcommissural fornix was continuous with the column of the fornix, but 39% smaller just below the anterior commissure. This caliber change appears posterior to the commissure in Fig 4B. Despite axonal projections from the fornix to the anterior septal nuclei (eg, diagonal band of Broca),50 we did not visualize a discrete projection from the fornix columns on TSE contrast, whereas a large portion of dark, presumably myelinated fibers project from the fornix columns first lateral and then arching superiorly into the anterior nucleus of the thalamus just above the commissure (Figs 2D and 4C) (the “direct” pathway).50 Because this projection has a similar MR imaging appearance to the column and postcommissural fornix, we suggest that this projection may be the dominant source of reduced caliber instead of projections to the precommissural fornix and thus a major efferent projection.
The ansa lenticularis, a key projection from the globus pallidus internus, is easily recognized on TSE MR imaging contrast (Figs 4B and 5E). In the axial plane the lateral two-thirds of this structure gently arcs with posterior concavity inferior to the globus pallidus, then near the midline the terminal aspects of the structure sharply and compactly curve posterior and superiorly to meet the lenticular fasciculus in a complex configuration that is challenging to appreciate with individual 2D images. The ansa lenticularis is relatively small with a cross-sectional area of 1.1 ± 0.3 mm2 when the lateral proximal portion is measured transverse to its long axis in the sagittal plane. If we calculate the ansa lenticularis volume as a cylinder, this implies that even if centered and linearly oriented within a 2-mm isotropic voxel, this structure would only occupy 28% of the volume. This small occupancy and its true looping course illustrate the difficulty of resolving internal medial forebrain pathways with lower SNR techniques such as diffusion MR imaging, for which acquiring isotropic voxels below 2 mm is challenging on current MR imaging systems. TSE or other non-diffusion-weighted sequences can be used to complement and validate future diffusion-based methods to resolve these functionally important structures with emerging clinical interest.
The external validity of the contrast and reported measurements may be affected by formaldehyde fixation,39⇓–41 postmortem interval,42 agonal changes,68 SUDC pathology,69 pediatric brains,70,71 or distortion/relaxation of the brain by removal during postmortem examination. Preliminary experiments have not identified contrast differences between pediatric and elderly cadaver brains using the TSE sequence, though this requires future investigation. SUDC brain measurements may not reflect larger right-left asymmetries or individual variability that develop later in adulthood. However, the anterior-posterior commissure distance in 11 SUDC samples was 23.8 ± 2.4 mm, similar to adult brains.67,72 Previous work in adult brains also demonstrated that this distance only differed by 2%–4% between premorbid in vivo MR imaging and postmortem measurement following formaldehyde fixation, sectioning, and histologic staining67(note, these latter 2 steps were not performed prior to imaging SUDC brains). Several of the potential confounding factors listed above may also affect histology data in stereotactic atlases currently used for functional neurosurgery planning in living patients.58,67 In previous atlases, anatomic assignments were determined on the basis of perceived semiquantitative changes to cell shape, size, volume fraction, staining affinity, and the density of myelin present.64 The boundaries were often determined by a single experienced individual (eg, Dr Hassler).58 The location and area/volume of anatomic assignments based on TSE appear largely concordant with histology atlases, but there may be differences between anatomic assignments using TSE MR imaging and existing atlases, particularly for regions with less contrast such as the internal thalamic nuclei.37,64,73,74 A detailed correlation of postmortem TSE contrast and measurements to histology is planned. The inherent portability of MR imaging data, multiplanar capabilities, reproducibility across multiple samples, and a more quantifiable basis for image contrast suggest that TSE MR imaging data could be used to create a compelling complementary atlas of the basal forebrain.
Conclusions
A modified TSE T2-weighted sequence generated excellent contrast resolution of basal forebrain structures relevant to emerging functional neurosurgery applications using relatively short scan times and a widely available 3T MR imaging system. Multiplanar images provided excellent visualization of specific nuclei and small internal myelinated pathways not well-understood by clinical neuroradiologists.
Acknowledgments
The authors thank the medical examiners, coroners, and the SUDC families for their support of this research. The senior author thanks Jim Babb, PhD, for assistance with the statistical analysis.
Footnotes
Disclosures: Laura Crandall—RELATED: Grant: SUDC Foundation and Finding a Cure for Epilepsy and Seizures*; Support for Travel to Meetings for the Study or Other Purposes: SUDC Foundation, Comments: travel reimbursement only for meetings attended on behalf of the Foundation; Other: Lange Shaw Donor-Advisor Fund, Comments: Funds support my effort in the study*; UNRELATED: Board Membership: SUDC Foundation, Comments: volunteer position; Travel/Accommodations/Meeting Expenses Unrelated to Activities Listed: SUDC Foundation, Comments: travel reimbursement only for meetings attended on behalf of the Foundation. Thomas Wisniewski—RELATED: Grant: National Institute on Aging, National Institutes of Health grant No. AG08051.* Orrin Devinsky—UNRELATED: Board Membership: SUDC Foundation, Comments: research grants to New York University Langone Health*; Other: National Institute of Neurological Disorders and Stroke, Comments: research support for Sudden unexpected death in epilepsy (SUDEP) research. Timothy M. Shepherd—RELATED: Grant: SUDC Foundation, Taylor McKeen Shelton Foundation, Finding a Cure for Epilepsy and Seizures fund, National Institutes of Health–National Institute on Aging AG048622.* Alon Y. Mogilner—UNRELATED: Consultancy: Medtronic, St. Jude, Brainlab, Boston Scientific, Alpha Omega, Comments: consulting for issues related to deep brain stimulation; Stock/Stock Options: ElectroCORE, Comments: Stock warrants were not exercised. *Money paid to institution.
This study was funded by the SUDC Foundation, the Taylor McKeen Shelton Foundation, and the Finding a Cure for Epilepsy and Seizures fund. T.M.S. received research support from the National Institute of Aging (grant AG048622). T.W. and A.F. received research support from the National Institute of Aging (grant AG008051). This work was supported, in part, by the Center for Advanced Imaging Innovation and Research, a National Institutes of Health–National Institute of Biomedical Imaging and Bioengineering Biomedical Technology Resource Center (Grant P41EB017183).
Indicates open access to non-subscribers at www.ajnr.org
REFERENCES
- Received March 9, 2019.
- Accepted after revision April 22, 2019.
- © 2019 by American Journal of Neuroradiology


Jump to section
Related Articles
Cited By...
- The Subcortical Atlas of the Marmoset ("SAM") monkey based on high-resolution MRI and histology
- Multimodal anatomical mapping of subcortical regions in Marmoset monkeys using high-resolution MRI and matched histology with multiple stains
- High-resolution mapping and digital atlas of subcortical regions in the macaque monkey based on matched MAP-MRI and histology