
Abstract
BACKGROUND AND PURPOSE: Chordoid meningiomas are uncommon WHO grade II primary intracranial neoplasms that possess unique chordoid histology and follow an aggressive clinical course. Our aim was to assess the utility of qualitative MR imaging features and quantitative apparent diffusion coefficient values as distinguishing preoperative MR imaging metrics to identify and differentiate chordoid histology from other meningioma histologic subtypes.
MATERIALS AND METHODS: Twenty-one patients with meningiomas with chordoid histology, which included both chordoid meningiomas (>50% chordoid histology) and meningiomas with focal chordoid histology (<50% chordoid histology) with available preoperative MR imaging examinations, including diffusion-weighted imaging, were identified. Qualitative imaging features and quantitative ADC values were compared between meningiomas with chordoid histology and 42 nonchordoid meningiomas (29 WHO grade I, eleven WHO grade II, and 2 WHO grade III).
RESULTS: The median ADC (10−3mm2/s) of meningiomas with chordoid histology was significantly higher than nonchordoid meningiomas (1.16 versus 0.92, P < .001), as was the median normalized ADC (1.60 versus 1.19, P < .001). In subgroup analysis, the median and normalized ADC values of chordoid meningiomas (n = 11) were significantly higher than those in meningiomas with focal chordoid histology (n = 10, P < .001 and P < .001, respectively) or nonchordoid meningiomas (n = 42, P < .001 and <0.001, respectively). Median and normalized ADC values were not significantly different between the meningiomas with focal chordoid histology and nonchordoid meningiomas (P = .816 and .301, respectively). Among the qualitative imaging features, only DWI signal intensity was significantly associated with meningiomas with chordoid histology diagnosis.
CONCLUSIONS: ADC values are higher in chordoid compared with nonchordoid meningiomas and may be used to discriminate the degree of chordoid histology in meningiomas. While qualitative MR imaging features do not strongly discriminate chordoid from nonchordoid meningiomas, DWI may allow preoperative identification of chordoid meningiomas.
ABBREVIATIONS:
- IQR
- interquartile range
- MCH
- meningiomas with chordoid histology
- nADC
- normalized ADC
Chordoid meningiomas are a rare subtype of atypical, WHO grade II meningioma.1 By histopathology, chordoid meningiomas are composed of spindled-to-epithelioid cells with eosinophilic cytoplasm arranged in chains and cords within a basophilic extracellular matrix. This myxoid stroma is rich in acidic mucin and stains with mucicarmine, periodic-acid-Schiff, and Alcian blue. Chordoid meningiomas are associated with higher rates of recurrence than benign WHO grade I meningiomas and have thus been designated as a grade II variant in the WHO classification, even in those examples lacking increased mitotic activity, brain invasion, or other atypical criteria.2⇓⇓–5 Thus, preoperative imaging identification of chordoid meningiomas could provide valuable information to guide surgical planning, adjuvant therapy, and patient counseling.
Several studies have sought to define imaging features that can reliably distinguish low- and high-grade meningiomas. In that regard, features such as larger size and irregular shape are associated with a higher meningioma grade.6⇓⇓–9 Although sensitive, these associations have poor specificity and are thus unreliable for identifying atypical and anaplastic meningiomas.10 Investigators have addressed these limitations by analyzing advanced MR imaging with quantitative metrics, including diffusion, perfusion, and MR spectroscopy.11⇓⇓⇓⇓⇓–17 To date, the most promising MR imaging feature for differentiating WHO grades in meningiomas is the apparent diffusion coefficient, a measure of the degree of diffusion of water molecules within tissue.11,12 Prior meningioma studies have revealed a significant correlation between whole-tumor ADC histogram metrics and tumor histology and corresponding WHO grade.18,19 However, only 1 study, which was limited to 4 patients, has specifically addressed the utility of ADC in identifying chordoid meningiomas on preoperative imaging.13
Given the relative paucity of imaging studies focused on chordoid meningiomas and the unmet need to identify high-grade meningiomas preoperatively, our study assessed whether qualitative or quantitative MR imaging features such as ADC can be used as preoperative MR imaging metrics to differentiate chordoid meningiomas from other meningioma subtypes. Our data revealed that ADC can delineate chordoid meningiomas from other meningioma histologies and can also identify the degree of chordoid histology within an individual meningioma.
Materials and Methods
Patient Population and Study Information
We identified 24 patients who underwent resection for meningiomas with chordoid histology at our institution from 2000 to 2018. All resection specimens were re-reviewed by an expert neuropathologist (D.A.S.) to confirm the presence and extent of chordoid histology. Chordoid meningiomas (>50% chordoid histology, n = 11) were considered separately from meningiomas with focal chordoid histology (<50% chordoid histology, n = 10), but for some analyses, these groups were combined as meningiomas with chordoid histology (MCH, n = 21). A cohort of 42 patients with histologically confirmed nonchordoid meningioma were randomly selected from a consecutive institutional cohort of patients with meningiomas for comparison using a random number generator. Clinical variables, including patient age, sex, and meningioma grade, were extracted from the medical record. Only patients with preoperative MR imaging examinations with available diffusion-weighted imaging and complete clinical records were included in the analysis. Patients who underwent preoperative meningioma embolization before MR imaging were excluded. This retrospective study was approved by the institutional review board.
MR Imaging Protocol
MR imaging was performed within a week before surgical resection using a 1.5T or 3T MR imaging scanner. While the acquired MR imaging pulse sequences varied during the course of the study, at a minimum, the standard neuronavigation MR imaging protocol consisted of the following pulse sequences encompassing the entire brain: precontrast T1 and T2, T2 FLAIR, DWI (b-values, 0 and 1000 s/mm2), and gadolinium-enhanced 3D echo-spoiled gradient-echo T1-weighted images.
MR Imaging Analysis
A board-certified neuroradiologist (J.E.V.-M.) evaluated MR images for qualitative imaging features, including lesion location, focality, size, T1/T2/DWI signal intensity, the presence of a dural tail or CSF cleft sign, bony involvement, parenchymal edema, tumor location, dural venous sinus involvement, arterial narrowing, and the presence of sunburst vessels using a clinical PACS. Signal intensity was characterized relative to gray matter for T1- and T2-weighted imaging and relative to brain for DWI. ADC maps were exported to MIM Software (MIM Software, Cleveland, Ohio), in which meningiomas were contoured by a board-certified radiation oncologist with expertise in tumors of the central nervous system (D.R.R.). All contours were initially defined around the tumor on gadolinium-enhanced T1 images and individually verified to ensure that they accurately preserved meningioma borders. The contoured ROIs from gadolinium-enhanced T1 images were automatically coregistered with corresponding ADC maps to obtain whole-tumor mean ADC values. Control ADC values were measured from contralateral normal-appearing white matter. Normalized ADC (nADC) was calculated by dividing the meningioma ADC value by the respective control ADC value.
Data Analysis
All statistical analyses were performed in STATA 15.0 (StataCorp, College Station, Texas). Differences in overall ADC and nADC values between MCH and nonchordoid meningiomas were compared using Wilcoxon rank sum tests. Additional subgroup analysis was performed to investigate the difference in overall ADC and nADC values among chordoid meningiomas, meningiomas with focal chordoid histology, and nonchordoid meningiomas. Previously published cutoff values of ADC ≥ 1.4 and nADC ≥ 1.9 for identifying the chordoid histology were evaluated.13 Subsequently, a receiver operating characteristic analysis was performed to define optimal cutoff values for the ADC and nADC. Univariate logistic and exact logistic regressions were performed to assess the predictive value of selected imaging features in preoperative chordoid meningioma diagnosis.
Results
Of the 24 identified patients with MCH, 21 met the inclusion criteria and were compared with 42 patients with nonchordoid meningiomas, which included 29 WHO grade I, eleven WHO grade II, and 2 WHO grade III meningiomas. Among the 10 meningiomas with focal chordoid features, the predominant meningioma histology included 6 WHO grade I, three WHO grade II, and WHO grade III. Approximately 70% of both MCHs and nonchordoid meningiomas were supratentorial. Similarly, both histologic groups predominantly presented as solitary lesions instead of as multifocal tumors. The proportions of MCHs and nonchordoid meningiomas observed to have a dural tail, bony involvement, a cystic component, CSF cleft sign, dural venous sinus involvement, arterial narrowing, sunburst vessels, irregular margins, and parenchymal edema on imaging were 95% versus 100%, 52% versus 26%, 24% versus 12%, 62% versus 79%, 14% versus 10%, 5% versus 9.5%, 24% versus 24%, 24% versus 5%, and 62% versus 60%, respectively. T1 signal hyperintensity was observed in approximately 62% of MCHs and 55% of nonchordoid meningiomas. T2 signal hyperintensity was observed in 76% of MCHs and 52% of nonchordoid meningiomas. Marked T1 contrast enhancement was observed in 100% of MCHs and 81% of nonchordoid meningiomas. Qualitative facilitated diffusion (hyperintensity on ADC with hypointensity on DWI) was seen in 48% of MCHs and 18% of nonchordoid meningiomas. On univariate logistic and exact logistic regressions, only ADC hyperintensity was found to be significantly associated with MCH diagnosis (P = .016) (Table).
Univariate analysis of qualitative MR imaging features for chordoid meningioma
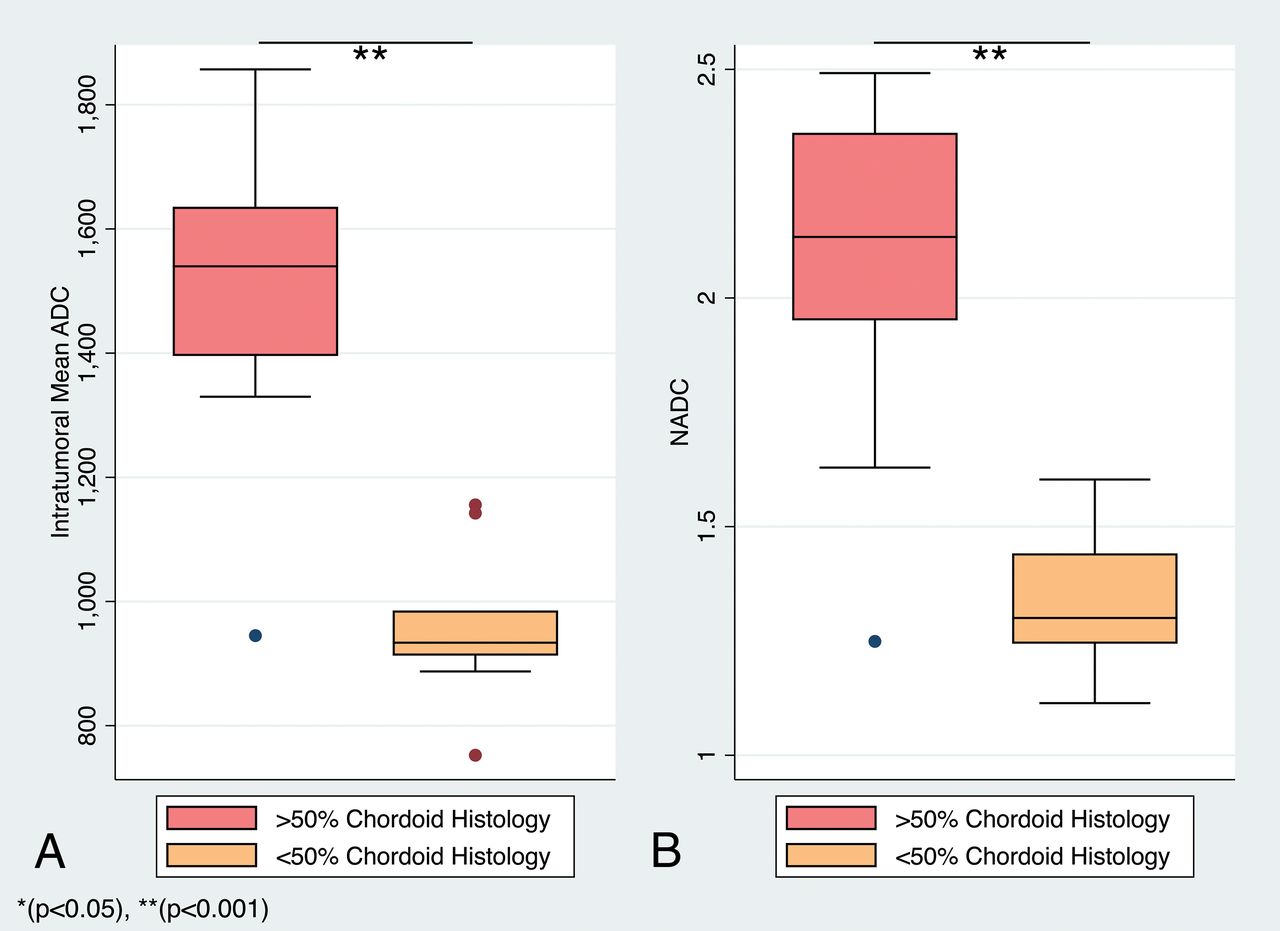
Intratumoral ADC values (10−3mm2/s) in MCHs ranged from 0.75 to 1.86, and the corresponding nADC values ranged from 1.11 to 2.49 (Figs 1 and 2). In nonchordoid meningiomas, the intratumoral ADC values ranged from 0.79 to 1.09, and the corresponding nADC values ranged from 1.01 to 1.42 (Fig 3). The median ADC of all MCHs (1.16; interquartile range [IQR] = 0.60) was significantly higher than that in nonchordoid meningiomas (0.92, IQR = 0.12, P < .001) (Fig 4A). Similarly, the median nADC of MCHs (1.60, IQR = 0.86) was significantly higher than that of the nonchordoid meningiomas (1.19, IQR = 0.13, P < .001) (Fig 4B). Subgroup analysis revealed a significant difference in the median ADC between chordoid meningioma (1.54, IQR = 0.24, n = 11) and meningiomas with focal chordoid features (0.93, IQR = 0.07, n = 10, P < .001) (Fig 5A). The median nADC of chordoid meningioma (2.13, IQR = 0.41) was also significantly higher than that in meningiomas with focal chordoid features (1.30, IQR = 0.20, P < .001) (Fig 5B). Consistently, chordoid meningiomas had significantly higher median ADC compared with nonchordoid meningiomas (0.92, P < .001), while the median ADC in meningiomas with focal chordoid features was not significantly different from that in nonchordoid meningiomas (P = .816) (Fig 6A). Furthermore, the median nADC values were significantly higher in chordoid meningiomas versus nonchordoid meningiomas (1.19, P < .001) (Fig 6B). There was no statistically significant difference in median nADC values between meningiomas with focal chordoid features and nonchordoid meningiomas (P = .301).

Meningiomas with chordoid histology. A–D, Chordoid meningioma. Axial T2-weighted image (A) demonstrates a T2 hyperintense falcotentorial meningioma with facilitated diffusion on the ADC map (B, white arrow). Hematoxylin-eosin (H&E) stained sections at 20× (C) and 40x (D) magnification demonstrate chains and clusters of epithelioid cells in a basophilic myxoid stroma characteristic of chordoid meningioma. E–H, Meningiomas with focal chordoid features. Axial T2-weighted image (E) demonstrates a T2-hyperintense left posterior parasagittal meningioma. The corresponding ADC map (F) demonstrates a dominant area of signal isointensity (black arrow) with focal facilitated diffusion (white arrow). H&E-stained sections at 40× magnification demonstrate regions of chordoid (G) and conventional meningothelial (H) histology. I–L, Anaplastic meningioma with focal chordoid features. Axial T2-weighted image (I) demonstrates a heterogeneous right sphenoid wing meningioma. The corresponding ADC map (J) demonstrates regions of reduced diffusion (black arrow), suggesting increased tumoral cellularity, with a small focus of facilitated diffusion (white arrow). H&E-stained sections at 40× magnification demonstrate focal regions of chordoid histology (K), with a predominant component of anaplastic meningioma lacking chordoid features (L).

Left frontal chordoid meningioma. A, Postcontrast T1-weighted image of a 5.5 × 3.6 cm chordoid meningioma shows clear enhancement with areas of nonenhancement. B, T2-weighted image shows moderate-to-hyperintense signal. C, DWI shows hypointense signal. D, A corresponding ADC map demonstrates marked hyperintense signals from the tumor with resulting ADC and nADC values of 1.84 × 10⁻³mm2/s and 2.36, respectively.

Left cerebellopontine angle nonchordoid meningioma, WHO grade I. A, Postcontrast T1-weighted image shows homogeneous enhancement in the 3.0 × 2.8 cm nonchordoid meningioma. B, T2-weighted image shows moderately intense signals. C, DWI shows isointense signals. D, A corresponding ADC map demonstrates isointense signal with resulting ADC and nADC values of 0.94 × 10⁻³mm2/s and 1.26, respectively.

Distribution of ADC and nADC values between chordoid and nonchordoid meningiomas. Boxplots of ADC (×10−6mm2/s) (A) and nADC (B) values of nonchordoid (gray) and chordoid meningiomas (red).

Distribution of ADC and nADC values by an intratumoral proportion of chordoid histology. Boxplots of ADC (×10−6mm2/s) (A) and nADC (B) values of chordoid meningiomas (red) and meningiomas with focal chordoid features (orange).

ADC and nADC values among chordoid meningioma, meningiomas with focal chordoid histology, and nonchordoid meningiomas. Boxplots of ADC (×10−6mm2/s) (A) and nADC (B) values of chordoid meningiomas (red), meningiomas with focal chordoid features (orange), and nonchordoid meningiomas (green).
The median ADC (1.16, IQR= 0.60) and nADC (1.60, IQR = 0.86) of MCH WHO grade II tumors were significantly higher than the median ADC (0.89, IQR = 0.22, P = .005) and nADC (1.21, IQR = 0.15, P = .001) of nonchordoid WHO grade II meningiomas. Similarly, the median ADC and nADC of MCHs were significantly elevated compared with the median ADC (0.86, IQR = 0.04, P = .038) and nADC (1.15, IQR = 0.14, P = .038) of WHO grade III meningiomas.
The overall diagnostic accuracy of the previously defined cutoff value of ADC ≥ 1.39 ×10⁻³mm2/s to identify chordoid meningioma on preoperative imaging was 96.8%, with a sensitivity and specificity of 96.3% and 100%, respectively.13 The overall diagnostic accuracy of the previously defined cutoff value of nADC ≥ 1.9 was 96.8%, with a sensitivity and specificity of 96.3% and 100%, respectively. On receiver operating characteristic analysis, cutoff values at ADC ≥ 1.33 ×10⁻³mm2/s and nADC ≥ 1.63 were identified with resulting identical overall accuracy, sensitivity, and specificity of 96.8%, 96.3%, and 100%, respectively.
Discussion
We found that both ADC and nADC values are significantly higher in MCHs compared with nonchordoid meningiomas. Moreover, our data reveal that chordoid meningiomas have significantly higher ADC and nADC values than either meningiomas with focal chordoid features or nonchordoid meningiomas. This finding remains true at a qualitative level, at which high ADC signal intensity and corresponding low DWI signal intensity are enriched in the MCH group.
Typically, WHO grade II and III meningiomas have greater intratumoral cellularity, increased tissue density, and decreased extracellular space, all of which are thought to contribute to decreased free water diffusion.11,12 Despite their WHO grade II classification, chordoid meningiomas have been found to have elevated ADC values.13 Increased water diffusivity within chordoid meningiomas is believed to be linked to an extracellular network composed of hyaluronic acid and chondroitin sulfate-rich mucoid matrix, which can be observed on microscopic evaluation and is unique to the chordoid subtype of meningioma.4 Most interesting, several studies have found associations between elevated ADC values and other types of tumors that are enriched with myxoid stroma, such as myxoid soft-tissue tumors, chordomas, and chondrosarcomas.14,15 Overall, our findings coincide with those reported in the only other investigation of DWI in chordoid meningioma.13 The overall mean ADC and nADC values for MCHs in our study were lower compared with those found in the previous study (1.62 ± 0.33 ×10⁻³mm2/s and 2.22 ± 0.47, respectively). However, the mean ADC and nADC values of the chordoid meningioma group in our study are similar to the mean values of the previous study. Given that ADC values were studied in only 4 chordoid meningiomas in the previous report, it is possible that all the chordoid meningiomas in that sample were of chordoid-predominant histology. Nonetheless, their previously defined ADC and nADC cutoff values of 1.39 × 10⁻³mm2/s and 1.93 had the same diagnostic accuracy as the defined cutoff values of our study with identically high sensitivity and specificity.
While there have been prior clinicopathologic studies on the proportion of chordoid meningioma histology,4,5 our study is the first to investigate imaging features associated with chordoid meningiomas on the basis of the relative proportion of chordoid histology. Mean ADC and nADC values were highest in chordoid meningiomas, consistent with the theorized greater water diffusivity in meningiomas with >50% chordoid composition. Indeed, chordoid meningiomas had ADC and nADC values that were significantly increased compared with both meningiomas with focal chordoid features and nonchordoid meningiomas. In contrast, the mean ADC and nADC values were not significantly different between meningiomas with focal chordoid histology and nonchordoid meningiomas. With <50% chordoid histology, the degree of water diffusivity in meningiomas with focal chordoid histology seems to be principally driven by the prevailing histology within the tumor. These findings highlight not only the heterogeneity of meningioma histology but also the potential limitation of ADC in identifying meningiomas with <50% chordoid histology.
Qualitative assessment of ADC hyperintensity proved useful in distinguishing MCH from nonchordoid meningiomas. ADC hyperintensity with corresponding DWI hypointensity was observed in a greater proportion of MCHs than in nonchordoid meningiomas and was significantly associated with approximately 4 times the odds of chordoid meningioma diagnosis. Our findings support the utility of qualitative assessment of DWI sequences in identifying MCHs, which is more feasible in routine clinical practice compared with quantitative ADC analysis. Otherwise, most qualitative imaging features were not significantly associated with MCH diagnosis. Of note, while chordoid meningioma histology is rich with mucoid matrix that is typically associated with increased T2 signal, especially in other tumors such as chordomas or chondrosarcomas,4,15 T2 signal hyperintensity did not achieve statistical significance in this study. Overall, the scarcity of statistically significant qualitative imaging features associated with chordoid histology in meningioma diagnosis further highlights the importance of quantitative metrics like DWI in preoperative meningioma diagnosis.
There are several limitations to our study. As a retrospective study, our data were limited not only by the availability of suitable preoperative imaging including DWI but also by the rarity of chordoid meningioma. Despite the small number of cases in our study, it is the largest study of its kind to date. Another limitation may be in the measurement of ADC values. While our study did not use 2 independent extractions of ADC values to assess interobserver reliability, all of the contours were individually assessed to guarantee precise adherence to meningioma borders while avoiding areas of signal loss that could alter quantifications. Consistently, all contours were derived from postcontrast imaging and further cross-referenced with T1/T2 sequences for accurate coverage of the meningioma area. Last, because contours of the whole tumor were used, there is greater reproducibility as opposed to simply using a single-slice ROI within the tumor. Using whole-tumor data allows more accurate representation of the total diffusion profile that may vary within the microarchitecture of a single tumor, as demonstrated by prior ADC histogram analyses on meningiomas.18 Most interesting, using whole-tumor measurements and histogram analysis may also better quantify morphologic imaging metrics such as signal intensity for predicting tumor histology, as shown by some studies.20,21
Conclusions
Our study demonstrates statistically significant elevations of ADC and nADC values in chordoid meningiomas compared with meningiomas with focal chordoid features and nonchordoid meningiomas. Our study also reveals that quantitative ADC may have additional utility in classifying the proportion of intratumoral chordoid histology on preoperative imaging. Cutoff values of ADC ≥ 1.33 ×10⁻³mm2/s and nADC ≥ 1.63 can be used to help identify potential chordoid meningiomas on preoperative imaging with considerable diagnostic accuracy. Preoperative identification of chordoid meningiomas could provide valuable information to guide subsequent surgical planning, adjuvant therapy, and patient counseling.
Footnotes
Joe D. Baal, William C. Chen, David R. Raleigh, and Javier E, Villaneurva-Meyer contributed equally to this work.
Disclosures: Joe D. Baal—RELATED: Grant: National Institutes of Health TL1 TR001871.* *Money paid to the institution.
This work was supported by a grant from the Linda Wolfe Meningioma Research Fund to D.R.R. This publication was also supported by the National Center for Advancing Translational Sciences, National Institutes of Health, through University of California San Francisco Clinical & Translational Science Institute grant No. TL1 TR001871.
The content of this work is solely the responsibility of the authors and does not necessarily represent the official views of the National Institutes of Health.
Indicates open access to non-subscribers at www.ajnr.org
References
- Received October 3, 2018.
- Accepted after revision January 14, 2019.
- © 2019 by American Journal of Neuroradiology


Jump to section
Related Articles
Cited By...
- No citing articles found.