
Abstract
BACKGROUND AND PURPOSE: Finding a reliable biomarker to thoroughly assess the brain structure changes in posttraumatic epilepsy is of great importance. Our aim was to explore the value of diffusional kurtosis imaging combined with dynamic contrast-enhanced MR imaging in the evaluation of posttraumatic epilepsy.
MATERIALS AND METHODS: A modified weight-drop device was used to induce traumatic brain injury. Rabbits were exposed to traumatic brain injury or sham injury. Diffusional kurtosis imaging and dynamic contrast-enhanced MR imaging were performed 1 day after injury. Posttraumatic epilepsy was investigated 3 months after injury. The traumatic brain injury group was further divided into 2 groups: the posttraumatic epilepsy and the non-posttraumatic epilepsy groups. Mean kurtosis and volume transfer coefficient values in the cortex, hippocampus, and thalamus were analyzed. After follow-up, the experimental animals were sacrificed for Nissl staining.
RESULTS: The posttraumatic epilepsy group comprised 8 rabbits. In the ipsilateral cortex, the volume transfer coefficient in the traumatic brain injury group was higher than that in the sham group; the volume transfer coefficient in the posttraumatic epilepsy group was higher than that in the non-posttraumatic epilepsy group. In the ipsilateral hippocampus, the volume transfer coefficient in the posttraumatic epilepsy group was higher than that in the non-posttraumatic epilepsy and sham groups. No difference was observed between the non-posttraumatic epilepsy and sham groups. In the ipsilateral cortex, mean kurtosis in the traumatic brain injury group was lower than that in the sham group, and mean kurtosis in the posttraumatic epilepsy group was lower than that in the non-posttraumatic epilepsy group. In the ipsilateral thalamus and hippocampus, mean kurtosis in the traumatic brain injury group was lower than that in the sham group, and mean kurtosis in the posttraumatic epilepsy group was lower than that in the non-posttraumatic epilepsy group. In the contralateral thalamus, mean kurtosis in the traumatic brain injury group was lower than that in the sham group; however, no difference was observed between the posttraumatic epilepsy and non-posttraumatic epilepsy groups.
CONCLUSIONS: Diffusional kurtosis imaging and dynamic contrast-enhanced MR imaging could be used to predict the occurrence of posttraumatic epilepsy in rabbits exposed to experimental traumatic brain injury.
ABBREVIATIONS:
- DCE
- dynamic contrast-enhanced
- DKI
- diffusional kurtosis imaging
- Ktrans
- volume transfer coefficient
- MK
- mean kurtosis
- PTE
- posttraumatic epilepsy
- TBI
- traumatic brain injury
- THRIVE
- T1 high-resolution isotropic volume excitation
During the past 30 years, given the continuous development of medical technology, the mortality rate from traumatic brain injury (TBI) has decreased from 50% to 25%.1 Additionally, with the development of brain injury rehabilitation, most patients with limb function impairment exhibit a certain degree of recovery of function.2 However, a fraction of patients in the rehabilitation process and chronic injury period exhibit neurologic abnormalities with great impact on quality of life.3 The occurrence of neurologic abnormalities after TBI is still not well-understood; this issue makes treatment difficult.4
Posttraumatic epilepsy (PTE) is a common neurologic abnormality after TBI, which can not only increase patient disability and severely affect quality of life5 but also cause damage to neurons and increase the degree of brain tissue damage, leading to disease progression and increased mortality.6 Posttraumatic seizures are divided into 3 types: those occurring 24 hours after trauma, those occurring within the first week after trauma, and those occurring later than 1 week after trauma. In multivariate analysis, risk factors for later seizures were brain contusion with subdural hematoma, skull fracture, loss of consciousness or amnesia for >1 day, and age 65 years or older. Only patients with advanced seizures developed PTE.7 The incidence of PTE ranges from 5% to 30% after TBI.8,9 Therefore, it is important to identify a difference between PTE and posttraumatic seizures in the early stages. Age, penetrating brain injury, intracranial hemorrhage, midline shift of >5 mm, coma time of >24 hours, loss of consciousness, delayed memory time, or multiple bilateral parietal brain contusion and frontal temporal lobe lesions are risk factors for PTE.10 Additionally, the cumulative incidence of PTE is approximately 2.1%, 4.2%, or 16.7% after 30 years in mild, moderate, or severe traumatic brain injury, respectively.7,11 Therefore, the degree of injury is an important factor that influences the occurrence of PTE.
The above-mentioned risk factors for PTE align with factors that can be regularly used in the medical history and physical examination. However, determining the extent of damage after TBI requires a more objective method. In clinical work, the Glasgow Coma Scale score is used to evaluate the degree of injury in TBI.12 Although the Glasgow Coma Scale score can be a more objective evaluation of a patient's function after injury, it does not adequately predict the development of PTE. An electroencephalogram can detect electrical activity of the brain in normal and abnormal conditions, especially in patients with epilepsy, and can find abnormal discharge of brain neurons to locate the lesion and evaluate its extent. However, a fraction of patients with epilepsy have electroencephalogram analysis that is negative for abnormal electrical discharge.13 Moreover, Jennett and Van De Sande13 found that 20% of patients with PTE had normal electroencephalogram results 3 months after brain injury. Therefore, the clinical evaluation of TBI in the prediction of PTE is limited.14
An important pathophysiologic event after TBI is the disruption of the blood-brain barrier, allowing movement of restricted components into the brain extracellular space, causing a series of secondary pathophysiologic changes, including PTE.15 Imaging studies of traumatic brain injury are of great importance in the discovery of minor trauma and identification of biomarkers that facilitate diagnosis, prognosis, and treatment evaluation. Several previous studies using multimodal MR imaging technology, including T2 mapping,16 T1ρ,17 and diffusion-weighted imaging,18 to quantitatively assess brain tissue changes after TBI showed that some of these parameters could predict the occurrence of PTE.19
Several studies have shown that dynamic contrast-enhanced (DCE) MR imaging and the associated volume transfer coefficient (Ktrans) values could be used to quantitatively determine the permeability of the BBB.20 Therefore, DCE MR imaging and Ktrans values may have predictive value for PTE. As a new technique, diffusional kurtosis imaging (DKI) primarily focuses on the intracellular and extracellular components of the nervous system, and its structural characteristics are reflected by the degree of tissue diffusion, such as gray matter and white matter diffusion. In the case of random motion, the diffusion motion of water molecules satisfies the Gaussian distribution. For real biologic tissue, the diffusion of water molecules occurs between the intercellular spaces and cells. This movement is not necessarily free movement; therefore, the true movement of the water molecules is non-Gaussian in distribution. The greater the degree of water molecule diffusion in the surrounding environment is, the more complex the constituent elements in the body are and the more obvious the non-Gaussian dispersion is. The initial goal of the DKI model was to quantify the extent of dispersion from the Gaussian distribution. The DKI model of organization of diffusion components was created without the assumption of benefits of model variables and stability calculations; therefore, it reflects various microstructural changes. DKI provides a new perspective and thereby enhances clinical applications. DKI has been used in the assessment of TBI.21 In this study, we aimed to investigate the value of DCE MR imaging and DKI technology in detecting brain microstructural changes and the prediction of PTE.
Materials and Methods
Experimental Animals and Treatment
We obtained 38 clean-grade New Zealand white rabbits (2.5–3 kg; age, 2–4 months; 19 males and 19 females) from Shanghai Jiao Tong University Affiliated Sixth People's Hospital Experimental Animal Center. Animals were housed at 22°C ± 1°C with humidity controlled at 50%–60%, lights on from 18:00–06:00, and free access to food and water. After 2 weeks of environmental adaptation, the animals fasted for 6 hours before the TBI operation. The experimental study was approved by Shanghai Jiao Tong University Affiliated Sixth People's Hospital.
The TBI group was further divided into PTE and non-PTE groups according to the final outcome. MR imaging was performed at 1 day after trauma, and the scan sequences included T2-weighted, T1-weighted, DCE MR imaging, and DKI.
TBI Model
The TBI model we used is an adaptation of a previously published model.13,20 The rabbits were subjected to auricular vein puncture, insertion of a venous indwelling needle, and injection of 2.5% pentobarbital sodium at 1 mL/kg, to achieve deep anesthesia (disappearance of conjunctival reflex) before being heparinized (25 U/mL) and fixed in a prone position on the experiment table. The bilateral parietal and frontal bones were exposed with blunt forceps, and a round bone window of approximately 8 mm to 1 cm in diameter was created with a dental drill at the right parietal bone. The integrity of the dura should not be breached. TBI group rabbits were later subjected to brain injury by dropping a 60-g weight onto the dura from a height of 20 cm, as previously described.14 We used 1200-g × cm intensity in our model, which causes a degree of damage similar to that caused by middle and heavy brain trauma. Sham group animals were subjected to craniotomy, but no impact. The bone window was sealed with solid paraffin, and the fascia and scalp were sutured. The operation was performed under sterile conditions. We followed standard aseptic practices, such as washing hands, wearing surgical clothes, wearing gloves, disinfection of skin at the operation site, and performing a single operation throughout the procedure. Animals were later allowed to recover from anesthesia.
Follow-Up and PTE Evaluation
The rabbits were randomly divided into 2 groups: the sham-operated group (sham group, n = 8) and the injured group (TBI group, n = 30). During the follow-up, all rabbits from the injured group were observed for 6 hours a day for 1 week; then, for 1 week every 4 weeks; and then, for a total of 3 times for 3 months. During the follow-up period of 3 months, 2 rabbits died on the third and fifth days after injury in the injured group of 30 rabbits, and the exact cause of death is unknown. Finally, 28 rabbits in the injured group were used for follow-up for 3 months. According to the improved method of Racine,22 animals were assessed for seizure behavior for 1 week to 3 months following the trauma. Seizure behavior was scored as follows: 0, no seizure behavior; 1, staring; 2, nodding or wet dog shakes, with or without facial tics; 3, limb jitters; 4, standing, jitters, and persistent double forelimb nods; 5, bilateral limb fibrillation, loss of balance and falling, and tonic-clonic seizures; and 6, fatal seizure. The experimental rabbits that scored ≥3 points were defined as having epilepsy. In the experimental group, there was at least 1 seizure in the 8 animals that were assigned to the PTE group. Therefore, the final grouping was as follows: a PTE group of 8, a non-PTE group of 20, and sham group of 8.
MR Imaging
MR imaging was performed at 24 hours after TBI on a 3T MR imaging scanner (Intera Achieva SMI-2.1; Philips Healthcare, Best, the Netherlands) with a special, small animal 8-channel head coil. The MR imaging sequence included T1, DKI, T2, and DCE MR imaging. The middle of the rabbit bilateral inner canthus connection was used as a positioning mark. The scanning parameters were as follows: T1: TR/TE = 500/20 ms, number of signal averages = 6, layer thickness = 2 mm, FOV = 100 × 100 mm, matrix = 224 × 270; T2: TR/TE = 1600/100 ms, number of signal averages = 6, layer thickness = 2 mm, FOV = 100 × 100 mm, matrix = 200 × 192; DKI: 6 b-values (b=0, 500, 1000, 1500, 2000, 2500 s/mm2), FOV = 100 × 100 mm, TR/TE = 1128/75 ms, layer thickness = 2 mm, number of signal averages = 4. Then, 3D T1 high-resolution isotropic volume excitation (THRIVE) was used to complete the DCE MR imaging. First, a basic THRIVE sequence was performed at flip angles of 4° and 8°, respectively. Next, animals were injected with Gd-DTPA (0.1 mmol/kg) with the specific method, and parameters were as follows: TR/TE = 6.8/3.2 ms, flip angle = 8°, spatial resolution = 3 × 3 × 3 mm, and continuous scanning of thirty 3D-THRIVE sequences to obtain T1 maps. Normal saline was injected 2 minutes after injection of the contrast agent. The total scan time for thirty 3D-THRIVE sequences was 7.5 minutes. Total scan time for all MR imaging was approximately 22 minutes.
Data Processing
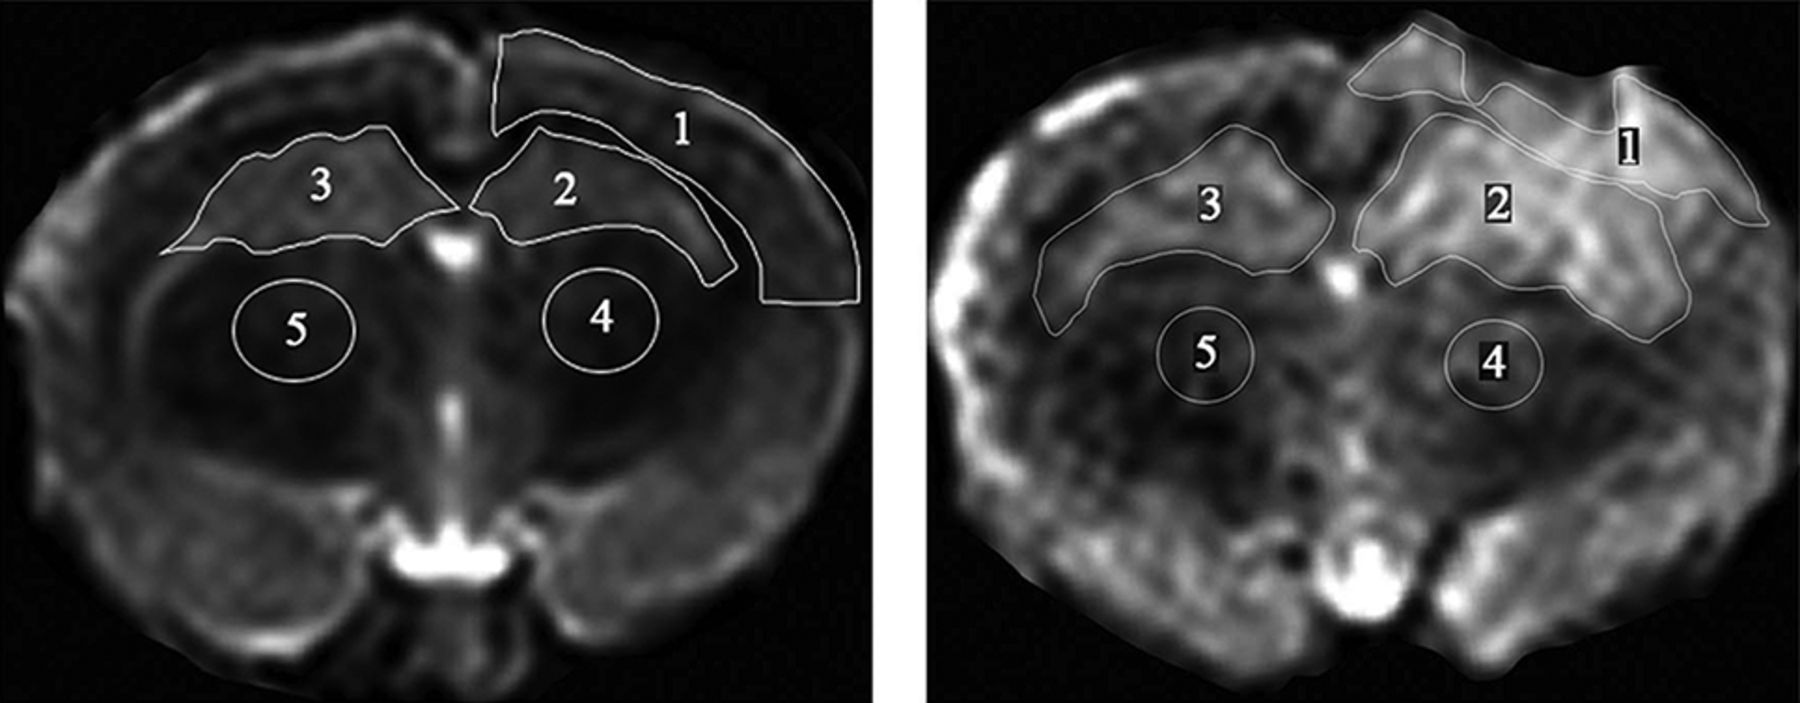
DKI scans were analyzed according to a previous fitting method,23 and the corresponding mean kurtosis (MK) map and MK values were obtained. All DCE MR imaging was transmitted to image-analysis software (CINE tool; GE Healthcare, Milwaukee, Wisconsin) to obtain quantitative Ktrans values for DCE MR imaging, with the middle cerebral artery used as the input artery. According to previous methods,20,24 the Ktrans value was calculated by the 2-chamber model.25 The ROI, including the ipsilateral cortex, the ipsilateral thalamus, the contralateral thalamus, the ipsilateral hippocampus, and the contralateral hippocampus, was defined on the basis of the T2-weighted image (Fig 1). The high signal area of the image was identified as the lesion, and the MK and Ktrans values of the different regions were calculated (Fig 2). The procedure was performed by 2 radiologists in consensus.

T2-weighted MR imaging displaying the manually outlined ROI. Left, Sham group ROIs: all ROIs correspond to ROIs as identified in the TBI group. Right, TBI group ROIs: ROI 1, ipsilateral cortex; ROI 2, ipsilateral hippocampus; ROI 3, contralateral hippocampus; ROI 4, ipsilateral thalamus; and ROI 5, contralateral thalamus.

MR imaging from a representative animal in the PTE, non-PTE, and sham groups. The Ktrans values of the PTE and non-PTE groups were higher than those of the sham operation group. In addition, the Ktrans values of the corresponding ROI in the PTE group were higher than those in the non-PTE group.
Nissl Staining
At the end of the experimental period, all rabbits were euthanized and perfused with 500 mL of 10% formaldehyde at first fast and then slow, lasting 1 hour. Brains were removed and postfixed in 4% formaldehyde and stored in the refrigerator at 4°C for 3–4 days. After dehydration and paraffin embedding, 4-μm sections were cut and subjected to Nissl staining, as previously described.26 The differences in the neuron number in the contralateral hippocampus in PTE, non-PTE, and sham groups were analyzed.
Statistical Analysis
By means of SPSS 16 for statistical analysis (IBM, Armonk, New York), all values were expressed as the mean ± SD. Using the 1-way ANOVA, we analyzed the differences in Ktrans and MK values among the 3 groups. Post hoc least significant difference tests were performed when the ANOVA group effects were significant. P < .05 was considered significant.
Results
Comparison of Ktrans Values among the Groups
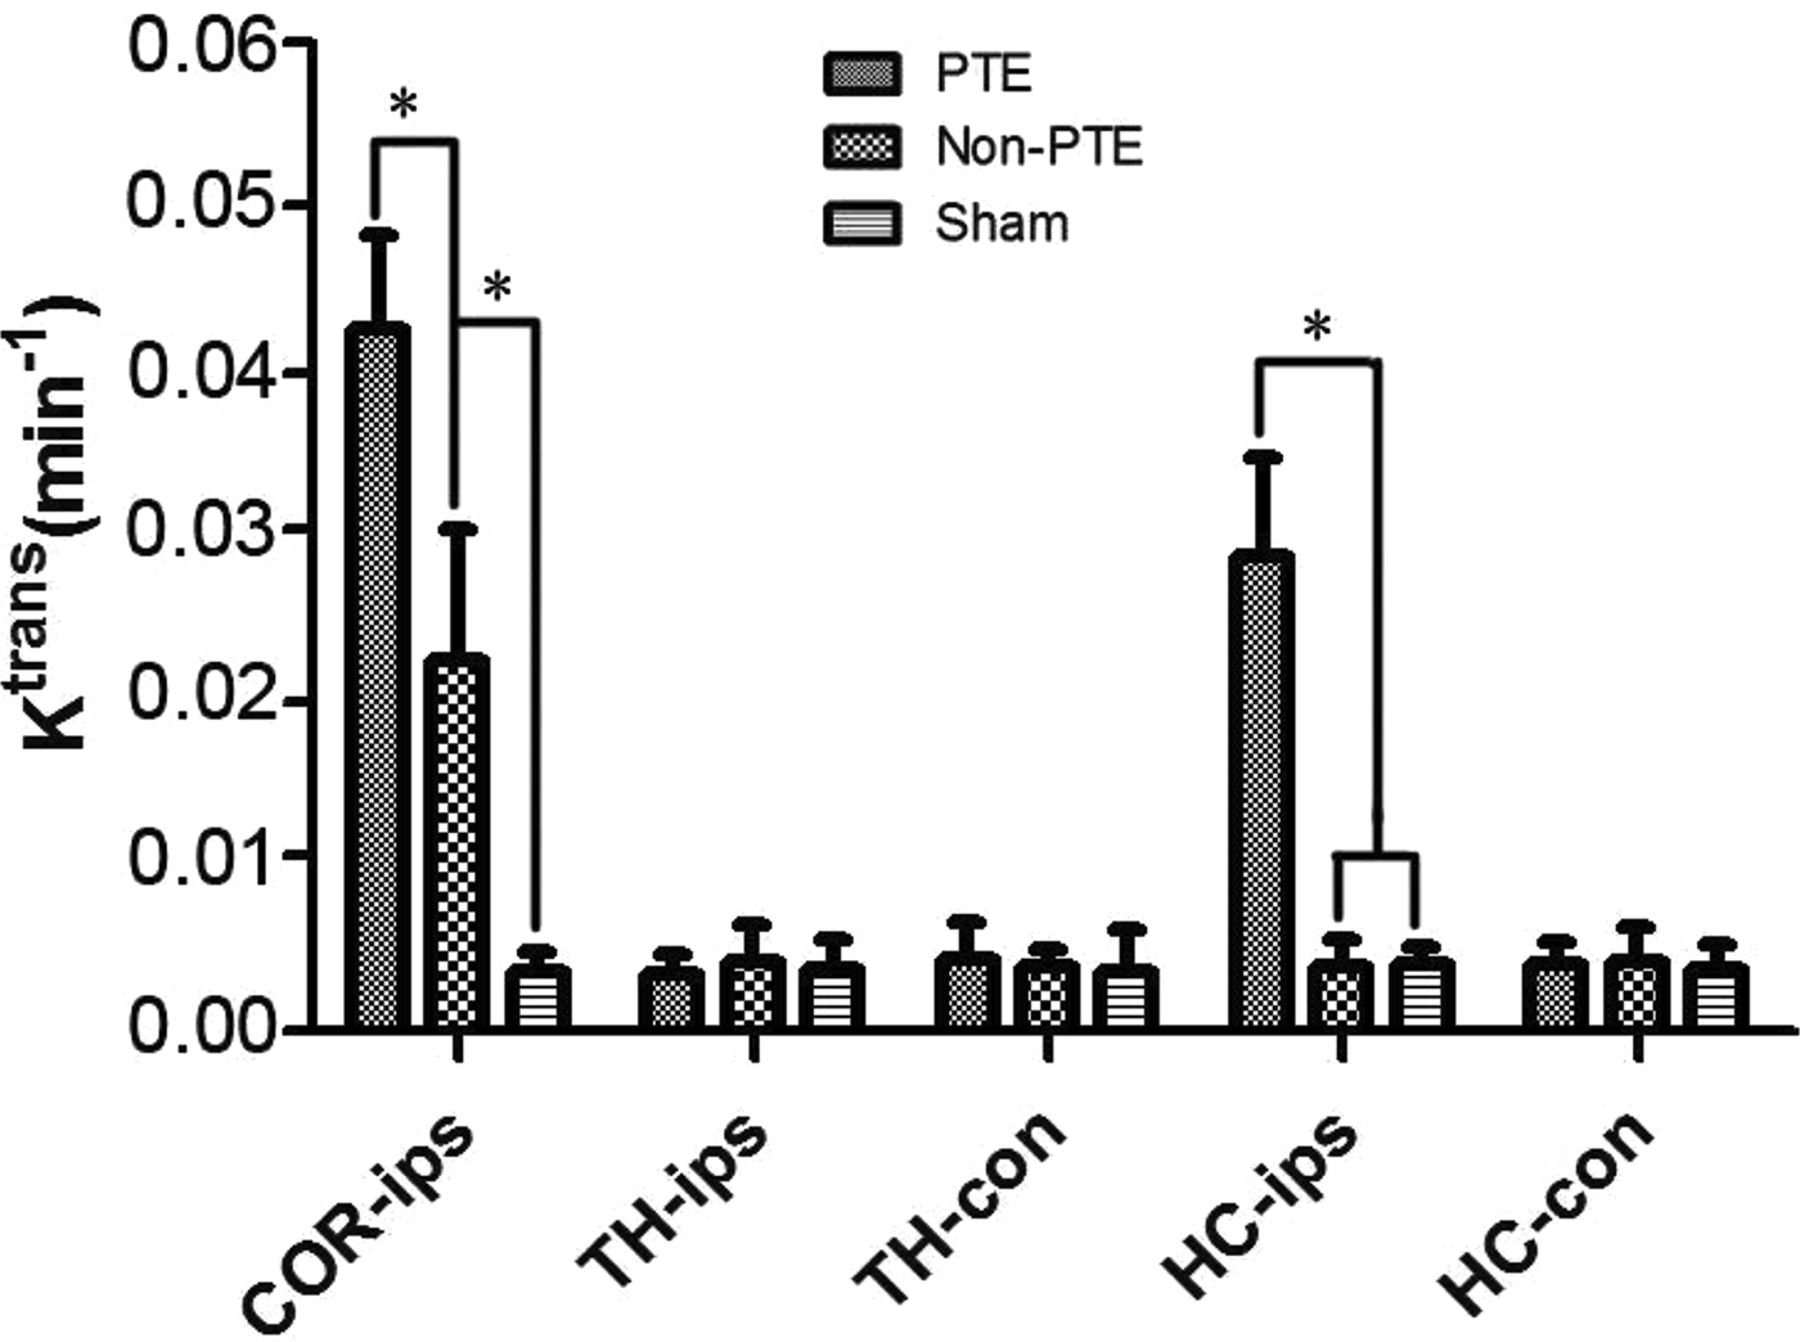
We compared Ktrans values among the 3 groups (Fig 3). In the ipsilateral cortex, there were significant differences in the Ktrans values among the 3 groups (P < .001); the PTE and non-PTE groups had higher Ktrans values than the sham group (P < .001). The Ktrans value in the PTE group was significantly higher than in the non-PTE group (P < .001). In the ipsilateral hippocampus, the Ktrans value of the PTE group was greater than that in the non-PTE and sham groups (P < .001). There were no significant differences in Ktrans among the 3 groups in the ipsilateral thalamus, contralateral hippocampus, and contralateral thalamus (all P > .05).

Comparison of Ktrans in all ROIs among all study groups. The asterisk indicates comparison between the 2 groups, P < .01; COR-ips, ipsilateral cortex; TH-ips, ipsilateral thalamus; TH-con, contralateral thalamus; HC-ips, ipsilateral hippocampus; HC-con, contralateral hippocampus.
Changes in MK Values following Injury
We also compared MK values among the 3 groups (Fig 4). In the injured cortex, the MK value of the PTE group was significantly lower than that in the non-PTE and sham groups (P < .001); the MK value of the non-PTE group was also significantly lower than that in the sham group (P < .001). In the ipsilateral thalamus and the ipsilateral and contralateral hippocampi, there were similar significant differences among the 3 groups, with a lower MK in the PTE group than in the non-PTE and sham groups and in the non-PTE group than in the sham group (P < .001). In the contralateral thalamus, the MK values in the TBI groups were lower than those in the sham group (P < .001), but there was no significant difference between the PTE and non-PTE groups.

Comparison of MK in all ROIs among all study groups. The asterisk indicates comparison between the 2 groups, P < .01; COR-ips, ipsilateral cortex; TH-ips, ipsilateral thalamus; TH-con, contralateral thalamus; HC-ips, ipsilateral hippocampus; HC-con, contralateral hippocampus.
Assessment of Neuronal Damage
We used Nissl staining to compare the number of cell bodies present in the contralateral hippocampus. Compared with the sham group, the PTE and non-PTE groups had reduced numbers of cell bodies in the contralateral hippocampus (Fig 5). We used a visual method under light microscope magnification of 100 to begin multiple counting of the total Nissl bodies in each field, which is only an approximate count of human judgment. Quantitative Nissl-positive cell numbers are very subjective; therefore, there are no accurate quantitative data given in this article. To prevent Nissl body staining from being obscured by other stains, such as hematoxylin-eosin, only Nissl staining was performed.

Comparison of the number of cell bodies in the contralateral hippocampus: 1) sham group (100×). 2) Non-PTE group (100×). 3) PTE group (100×). The number of cell bodies in the contralateral hippocampus in the PTE group was lower than that in the non-PTE and sham groups. The number of cell bodies in the non-PTE group was also lower than that in the sham group.
Discussion
In this study, DCE MR imaging and DKI were used to detect brain microstructural changes in different ROIs 1 day after TBI and to predict the development of PTE 3 months after TBI. Our results showed the following: 1) the incidence of PTE in rabbits was 28.6% after TBI; 2) MK values of the PTE group were lower than those of the non-PTE group in the damaged side of the cortex, ipsilateral hippocampus, ipsilateral thalamus, and contralateral hippocampus, indicating that the structural complexity of the PTE group was lower than that in the non-PTE group.
The incidence of PTE in different studies varied, with a range of 5%–30% in the clinical research,8 while in studies that used fluid percussion to create severe TBI models, the incidence ranged from 30% to 52%.27 This study adopted the drop-device model of traumatic brain injury in rabbits. We used 1200-g × cm intensity in our model, which causes a degree of damage similar to that caused by moderate and severe brain trauma.27 Similarly, we found that the incidence of PTE at 3 months was 28.6%.
After trauma, damage from TBI disrupts the BBB, which can cause a series of complications.1 Previous studies have indicated that disruption of the BBB in the injured cortex is closely related to the development of PTE.15 In the process of BBB disruption, there is increased permeability from the blood vessels to the extracellular space, which can cause a series of pathologic changes.28 This effect could contribute to the accumulation of extracellular potassium, resulting in the increase of N-methyl-D-aspartate receptor–mediated nerve activity and ultimately leading to epileptic discharge. In addition to damage to the injury cortex, the ipsilateral hippocampus could also be involved in the occurrence of PTE. A previous study showed that the diffusion tensor of the ipsilateral hippocampus predicted the occurrence of PTE.19,29 The ipsilateral hippocampus injury could lead to increased chronic inflammation, neurodegeneration,15 and hippocampal mossy fiber sprouting.27 These changes, especially the occurrence and extent of mossy fiber sprouting in the hippocampus, are closely related to epilepsy.27
Immonen et al30 used MR imaging technology to study brain injury in experimental rats for 11 months. These researchers' results showed changes in the focal cortical lesion and adjacent areas, including the perifocal and contralateral cortices and the ipsilateral and contralateral hippocampi.30 We obtained similar results in this study. The MK values of the PTE group were significantly lower than those of the non-PTE and sham groups in the ipsilateral cortex, thalamus, and ipsilateral hippocampus, indicating that the damage occurred not only in the impact cortex but also in the ipsilateral thalamus and hippocampus. The underlying pathologic changes might be that the structural complexity of these regions was reduced. After TBI, local brain cell degeneration, disintegration, and apoptosis can reduce the organizational complexity of restricted areas, decreasing the MK value. In addition, comparable with previous findings,19,29 this pathologic change may be related to the occurrence of PTE.
Damage to the cortex and ipsilateral thalamus may do harm to the thalamic cortical pathway. This pathway damage can promote the formation of epileptic networks. Furthermore, the onset of epilepsy is closely related to hippocampal mossy fiber sprouting.31 Kharatishvili et al27 found that the traumatic ipsilateral hippocampus average diffusion coefficient value mapped from DTI can predict mossy fiber sprouting. Additionally, they also found that the ipsilateral hippocampus had a series of pathologic changes, such as degeneration and mossy fiber sprouting, after TBI in the follow-up period. These pathologic changes can cause significant reduction in the degree of tissue complexity, thereby reducing MK.
The results of this study should be considered in the context of its limitations. First, we did not obtain an electroencephalogram for the experimental animals because several studies have indicated that the electroencephalogram is negative for PTE.13,32 Thus, we only used the modified Racine method to evaluate the occurrence of PTE. Second, experimental animals are better to divide with the same sex distribution in each group, but we did not pay attention to the effect of animal sex on the study results, which may influence our results. Third, the injury of brain tissue will have a continuous dynamic pathologic process after TBI, such as the proliferation of glia at a later time, which will alter the MK value.33 Thus, we examined only the MK changes at 1 day after TBI. Fourth, the follow-up time was relatively short, being only 3 months.
Conclusions
DKI and DCE MR imaging could be used to predict the occurrence of PTE in rabbits exposed to experimental traumatic brain injury.
Footnotes
Wenbin Li and Xuan Wang are co-first authors.
Disclosures: Wenbin Li—RELATED: Grant: This study was funded by the National Natural Science Foundation of China (grant No. 81271540), the Natural Science Foundation of Xinjiang Province (grant No. 2016D01C083), and the Shanghai Key Discipline of Medical Imaging (grant No. 2017ZZ02005)*; UNRELATED: Employment: Shanghai Jiao Tong University Affiliated Sixth People's Hospital. *Money paid to the institution.
This work was supported by the National Natural Science Foundation of China (grant No. 81271540), the Natural Science Foundation of Xinjiang Province (grant No. 2016D01C083), and the Shanghai Key Discipline of Medical Imaging (grant No. 2017ZZ02005).
Research involving animal participants had ethics approval. All applicable international, national, and/or institutional guidelines for the care and use of animals were followed. All procedures performed in studies involving animals were in accordance with the ethical standards of the institution or practice at which the studies were conducted.
Indicates open access to non-subscribers at www.ajnr.org
REFERENCES
- Received December 27, 2017.
- Accepted after revision March 3, 2018.
- © 2018 by American Journal of Neuroradiology


Jump to section
Related Articles
Cited By...
- No citing articles found.