
Abstract
BACKGROUND AND PURPOSE: Although diffusion-weighted imaging combined with morphologic MRI (DWIMRI) is used to detect posttreatment recurrent and second primary head and neck squamous cell carcinoma, the diagnostic criteria used so far have not been clarified. We hypothesized that precise MRI criteria based on signal intensity patterns on T2 and contrast-enhanced T1 complement DWI and therefore improve the diagnostic performance of DWIMRI.
MATERIALS AND METHODS: We analyzed 1.5T MRI examinations of 100 consecutive patients treated with radiation therapy with or without additional surgery for head and neck squamous cell carcinoma. MRI examinations included morphologic sequences and DWI (b=0 and b=1000 s/mm2). Histology and follow-up served as the standard of reference. Two experienced readers, blinded to clinical/histologic/follow-up data, evaluated images according to clearly defined criteria for the diagnosis of recurrent head and neck squamous cell carcinoma/second primary head and neck squamous cell carcinoma occurring after treatment, post-radiation therapy inflammatory edema, and late fibrosis. DWI analysis included qualitative (visual) and quantitative evaluation with an ADC threshold.
RESULTS: Recurrent head and neck squamous cell carcinoma/second primary head and neck squamous cell carcinoma occurring after treatment was present in 36 patients, whereas 64 patients had post-radiation therapy lesions only. The Cohen κ for differentiating tumor from post-radiation therapy lesions with MRI and qualitative DWIMRI was 0.822 and 0.881, respectively. Mean ADCmean in recurrent head and neck squamous cell carcinoma/second primary head and neck squamous cell carcinoma occurring after treatment (1.097 ± 0.295 × 10⁻³ mm2/s) was significantly lower (P < .05) than in post-radiation therapy inflammatory edema (1.754 ± 0.343 × 10⁻³ mm2/s); however, it was similar to that in late fibrosis (0.987 ± 0.264 × 10⁻³ mm2/s, P > .05). Although ADCs were similar in tumors and late fibrosis, morphologic MRI criteria facilitated distinction between the 2 conditions. The sensitivity, specificity, positive and negative predictive values, and positive and negative likelihood ratios (95% CI) of DWIMRI with ADCmean < 1.22 × 10⁻³ mm2/s and precise MRI criteria were 92.1% (83.5–100.0), 95.4% (90.3–100.0), 92.1% (83.5–100.0), 95.4% (90.2–100.0), 19.9 (6.58–60.5), and 0.08 (0.03–0.24), respectively, indicating a good diagnostic performance to rule in and rule out disease.
CONCLUSIONS: Adding precise morphologic MRI criteria to quantitative DWI enables reproducible and accurate detection of recurrent head and neck squamous cell carcinoma/second primary head and neck squamous cell carcinoma occurring after treatment.
ABBREVIATIONS:
- DWIMRI
- combined MRI with morphologic sequences and DWI
- HN
- head and neck
- HNSCC
- head and neck squamous cell carcinoma
- LR
- likelihood ratio
- pHNSCC
- primary head and neck squamous cell carcinoma
- rHNSCC
- recurrent head and neck squamous cell carcinoma
- RTH
- radiation therapy
- sHNSCC
- second primary head and neck squamous cell carcinoma occurring after treatment
Squamous cell carcinoma accounts for 95% of all cancers in the head and neck (HN) region.1 The aim of treatment is to provide a cure with the maximum possible preservation of organ function. Treatment options comprise radiation therapy (RTH) and/or chemotherapy and/or an operation.1,2 Up to 25% of early-stage primary head and neck squamous cell carcinomas (pHNSCCs) and up to 50% of advanced-stage tumors show treatment failure in the form of residual/recurrent HNSCC (rHNSCC), whereas 15% of patients develop second primary HN cancer (sHNSCC).2,3 Early detection of rHNSCC/sHNSCC prompts curative salvage treatment and may allow preservation of organ function.
RTH causes dramatic gross and microenvironmental changes in the affected soft tissues. In most cases, inflammatory edema develops, which leads to formation of fibrosis and scar tissue. Inflammatory edema and scar tissue may coexist, and they may render clinical/endoscopic evaluation challenging. Clinical/endoscopic examinations may miss a tumor under intact mucosa or may underestimate it due to its multifocal recurrence pattern. Moreover, panendoscopy is an invasive procedure requiring general anesthesia. A biopsy with negative findings does not exclude rHNSCC/sHNSCC, and multiple biopsies may increase overall morbidity.2,4,5
MRI with morphologic sequences and diffusion-weighted imaging (DWIMRI) provides anatomic, qualitative, and quantitative functional information allowing noninvasive assessment of treatment response and detection of rHNSCC/sHNSCC.5⇓⇓⇓–9 The imaging features of rHNSCC on morphologic MRI sequences have been scarcely addressed in the literature,1,5,7,10 and several studies have focused on demonstrating the utility of DWI for the detection of recurrence.5⇓⇓⇓–9,11⇓–13 However, the diagnostic performance of clearly defined morphologic MRI criteria, the interobserver reproducibility, and the impact of each technique (morphologic MRI versus combined DWI with morphologic MRI) have not been assessed in these studies. Earlier studies were rather small,6,7,13 and they were based on a mix of HNSCC and other histologic tumor types7,11 or included both local and nodal recurrence.6,12
The aim of this study was to evaluate the diagnostic performance of morphologic MRI with clearly defined criteria for the detection of rHNSCC/sHNSCC and to compare it with the diagnostic performance of DWI alone and of DWI combined with morphologic MRI. We likewise aimed to analyze the added value of each technique and their respective contributions to the overall diagnostic performance of DWIMRI.
Materials and Methods
Patients
The institutional ethics committee approved this retrospective study, which was performed in accordance with the guidelines of the Declaration of Helsinki II. Informed consent was waived. The study population included 114 consecutive patients seen during 3.5 years in our institution. The patients underwent 1.5T MRI with morphologic MRI and DWI sequences for clinically suspected recurrence or for follow-up after RTH with or without an additional operation. Fourteen patients were excluded because of absent follow-up (n = 6), nondiagnostic DWI (n = 5), and nondiagnostic morphologic MRI and DWI (n = 3). The remaining 100 patients formed the basis of the current study. The series comprised 21 women and 79 men with a median age (25 quartile–75 quartile) of 62 years (55–69 years), ranging from 18 to 89 years. The median time interval between the end of RTH and MRI was 14 months (4.5–51 months).
Imaging Technique
The MRI protocol included imaging from the skull base to the thoracic inlet with FSE T2 and FSE T1 sequences in the axial plane, a short τ inversion recovery sequence in the coronal plane, and axial spin-echo EPI DWI (b=0 and 1000 s/mm2) with apparent diffusion coefficient map calculation using monoexponential fitting. After administration of a gadolinium-based contrast agent, we performed T1WI ± fat saturation in the axial, coronal, and/or sagittal plane. Sequence parameters were the following: TR/TE = 3300/106 ms, 24 slices, slice thickness = 3 mm, FOV = 230 × 180 mm, matrix = 512 × 416, acquisition time = 3 minutes 30 seconds; and TR/TE = 771/11 ms, 30 slices, slice thickness = 3–4 mm, FOV = 230 × 230 mm, matrix = 512 × 512, acquisition time = 3 minutes 56 seconds for T2- and T1-weighted acquisitions, respectively. DWI parameters were the following: TR/TE = 3200/86 ms, 40 slices, slice thickness = 3–4 mm, FOV= 230 × 230 mm, matrix = 128 × 128, acquisition time = 3 minutes 2 seconds.
Evaluation of Morphologic MRI and DWI and Applied Diagnostic Criteria
Two board-certified HN radiologists (>10 years' experience in HN oncology), blinded to all clinical data (patient history, histology, and clinical/radiologic follow-up), analyzed the images separately. First, all morphologic MRIs were evaluated with the reader blinded to DWI. Then the readers evaluated morphologic MRI and DWI together (DWIMRI). After separate evaluations by each reader and assessment of interobserver variability, consensus was reached in cases of discrepant interpretations.
On the basis of the experience at our institution and according to published data,1,14,15 the interpretation of morphologic MRI was performed according to the following criteria: 1) rHNSCC/sHNSCC was diagnosed in the presence of a masslike lesion with moderately high (intermediate) signal intensity on T2, low signal intensity on T1, and moderate enhancement after IV gadolinium administration; 2) post-RTH inflammatory edema was diagnosed in the presence of a diffuse lesion with high signal intensity on T2, low signal intensity on T1, and strong postcontrast enhancement; and 3) late RTH fibrosis (post-RTH scar) was diagnosed in the presence of a linear or triangular lesion with very low signal intensity on T2 (similar to or lower than that of muscle), low signal intensity on T1, and faint/absent contrast enhancement.1,14,15
DWI was assessed visually (qualitative DWI) by analyzing the signal intensity on the b=1000 image and on the corresponding ADC map. The association of moderately high or very high signal on b=1000 and low signal on ADC maps was interpreted as suggesting malignancy. The association of high signal on both b=1000 and the ADC map (T2 shinethrough) or low signal on b=1000 and high signal on the ADC map was interpreted as post-RTH inflammatory edema, whereas low signal on b=1000 and low signal on ADC was regarded as suggesting RTH-induced late fibrosis. Quantitative DWI analysis was based on ADC measurements in benign and malignant lesions, which was performed by drawing small ROIs on multiple slices manually, according to the recommendations in the literature.5,16,17 In large, masslike lesions, ROIs were placed on the most hypointense lesion parts on the ADC maps, avoiding necrotic portions.5,16
For combined DWIMRI interpretation, whenever MRI morphology and DWI findings were concordant, the diagnosis of tumor was straightforward. Whenever morphology and DWI were discordant, on the basis of our experience, we applied the following criteria: 1) For lesions with characteristic morphologic features of late fibrosis, morphology outweighed positive DWI findings; 2) for lesions with morphology strongly suggesting rHNSCC/sHNSCC, morphology outweighed negative DWI findings; and 3) in the absence of a suspicious lesion at morphology, positive findings on DWI outweighed negative morphology. For the analysis of combined DWIMRI, we recorded the number of instances in which DWI changed the interpretation of morphologic MRI; and on the contrary, we recorded the number of instances, in which MRI changed the interpretation of DWI.
Standard of Reference
The data extracted from the medical records were used for the validation of findings. The distinction between rHNSCC and sHNSCC was made on the basis of the interdisciplinary HN oncology tumor board reports. In rHNSCC, differentiation was made between local recurrence (at the same site as the pHNSCC or in the immediate tumor vicinity) and distant recurrence (eg, base of the skull due to perineural tumor spread). The standard of reference consisted of histology and follow-up. Histology from endoscopic biopsy and/or salvage operation and additional follow-up were available in 50 lesions (37 HNSCCs and 13 benign lesions), whereas follow-up alone was available in 53 lesions (1 HNSCC and 52 benign lesions). Follow-up included clinical examination and cross-sectional imaging for at least 18 months after MRI. It was used to validate negative results as true-negatives in patients without biopsy and in patients with negative biopsy results. Twenty-nine patients died from disease during the follow-up with a median time interval (25th quartile–75th quartile) between MRI and death of 10 months (4–15 months). The median follow-up in the 71 surviving patients was 25 months (19–33 months).
Statistical Analysis
Comparison between ADCmean values for tumors and benign lesions was performed with a Wilcoxon rank sum test with continuity correction. Receiver operating characteristic analysis of ADCmean values categorized according to the standard of reference was performed. An optimal cutoff value for ADCmean was calculated according to the literature.18 The diagnostic performance of MRI, DWI, qualitative DWIMRI, and quantitative DWIMRI was assessed in terms of sensitivity, specificity, positive and negative predictive values, and positive and negative likelihood ratios (LR+, LR−). Percentage agreement and Cohen κ coefficients were used to assess interobserver reproducibility, with κ values of 0.21–0.40 indicating fair agreement; 0.41–0.60, moderate agreement; 0.61–0.80, substantial agreement; and 0.81–1.00, almost perfect agreement.19 Comparison between sensitivities and specificities was performed with the McNemar test, whereas LRs were compared using a regression model approach.20 Statistical analyses were conducted with R3.3.1 (http://www.R-project.org).21 Statistical tests were 2-sided with a significance level of .05.
Results
Patient and Tumor Characteristics
Patient and tumor characteristics are shown in Table 1. Post-RTH HNSCC (rHNSCC/sHNSCC) was diagnosed in 36 patients in 38 locations (tumor prevalence = 37%; 95% CI, 28%–47%; 2 patients had 2 HNSCCs each). There were 31 local rHNSCCs, 2 distant rHNSCCs (base of the skull via perineural spread), and 5 sHNSCCs in the HN region. Most post-RTH tumors (n = 33) occurred in the same anatomic subsite as the pHNSCC (n = 23) or at the periphery of the RTH field (n = 10). Nevertheless, patients with oropharyngeal pHNSCC developed sHNSCC (n = 5) more often than patients with pHNSCC originating in other HN subsites (P < .001).
Patient and tumor characteristics
Results of Image Interpretation
Morphologic images were of good/acceptable quality in all patients. In 7 patients, DWI showed artifacts in the floor of the mouth due to dental hardware (n = 5), tongue base (n = 1), or lower neck (n = 1). Because both readers considered DWI to be of acceptable quality, these patients were not excluded from analysis.
Evaluations of the 2 readers were concordant in 93/100 patients (96/103 lesions, percentage agreement = 93.2%) with MRI and in 94/100 patients (97/103 lesions, percentage agreement = 94.2%) with qualitative DWIMRI, respectively. The Cohen κ for differentiating tumor from post-RTH lesions with MRI and with qualitative DWIMRI was 0.822 and 0.881, respectively, indicating excellent interobserver reproducibility.19 Morphologic MRI and DWI were discordant in 28 lesions. The Cohen κ for the 2 readers for combined DWIMRI in this subset of lesions was 0.774 (substantial interobserver reproducibility19), and the percentage agreement was 89.3%.
Results of the interpretation of MRI and DWIMRI are indicated in Table 2 for the consensus between the 2 readers. Morphologic MRI yielded 30 true-positive evaluations (Fig 1 and On-line Fig 1) and 52 true-negative evaluations (On-line Fig 2). Among the 52 true-negative evaluations, 8 fulfilled the criteria of late fibrosis due to very low signal on T2 (Figs 2 and 3). Both readers correctly identified these lesions. The 8 false-negative evaluations with MRI were caused by the following: abscess from infected osteonecrosis masking recurrence (n = 1), in situ tumor (n = 1), and T1 tumor (n = 1), therefore, too small to be detected by imaging; missed tumor due to poor lesion conspicuity (n = 3); and recurrent disease misinterpreted as inflammation (n = 2). Thirteen false-positive interpretations with MRI were caused by granulation tissue, which displayed similar signal intensity on T2 and enhancement similar to that of rHNSCC/sHNSCC.
Diagnostic performance of morphologic MRI alone, quantitative DWI alone, qualitative DWIMRI, and quantitative DWIMRI with ADCmean < 1.22 × 10⁻³ mm2/s

DWIMRI obtained 23 months after RTH for laryngeal squamous cell carcinoma and increasing hoarseness. Axial T2 (A), T1 (B), and contrast-enhanced T1 (C) show an oval lesion (arrows) in the left false cord and left paraglottic space with intermediate signal intensity on T2, low signal intensity on T1, and moderate contrast enhancement highly suspicious for rHNSCC. The b=1000 image (D) shows high signal intensity in the lesion. ADC map (E) reveals low signal intensity compatible with restricted diffusion (arrow), further suggesting recurrence (ADCmean = 0.798 × 10⁻³ mm2/s). Endoscopic biopsy confirmed rHNSCC. F, Histology (H&E, original magnification ×100) shows squamous cell carcinoma with areas of densely packed and loosely packed squamous cells of variable size with keratin pearls (asterisk).

DWIMRI obtained 13 months after RTH and neck dissection for squamous cell carcinoma of the larynx and oropharynx. The patient had massive weight loss, malnutrition, and recurrent aspiration pneumonia. Endoscopy showed intact mucosa and fixed vocal cords bilaterally. Axial T2 (A), T1 (B), and contrast-enhanced T1 (C) show a triangular lesion (arrows) in the left true vocal cord with very low signal intensity on T2, low signal intensity on T1, and faint contrast enhancement suggesting post-RTH late fibrosis. In contrast, the right vocal cord (dashed arrows) displays high signal intensity on T2, low signal on T1, and enhancement. Findings on the right were interpreted as suggesting inflammatory edema. The b=1000 image (D) and ADC map (E) reveal no restricted diffusion in the right vocal cord (ADCmean = 1.643 × 10⁻³ mm2/s) and restricted diffusion with low ADC in the left vocal cord (ADCmean = 1.006 × 10⁻³ mm2/s). Because the nonfunctional larynx was the cause of malnutrition and recurrent aspiration pneumonia, laryngectomy was performed. F, Corresponding whole-organ histologic slice (H&E) shows extensive muscle fibrosis on the left (arrows) and inflammatory edema with denervation on the right (dashed arrows).

DWIMRI obtained 3 months after RTH and bucopharyngectomy for squamous cell carcinoma of the retromolar trigone. The patient had right reflex otalgia and progressing trismus. Endoscopy could not be performed. Axial T2 (A) and coronal STIR (B) images show a triangular, elongated, strongly hypointense lesion (arrows) on the right. There was no contrast enhancement (not shown). The diagnosis of benign post-RTH late fibrosis was made. The b=1000 image (C) reveals low signal. ADC map (D) likewise shows low signal (ADCmean = 0.731 × 10⁻³ mm2/s). Follow-up at 38 months (not shown) showed no recurrence but progressive scar retraction on MRI.
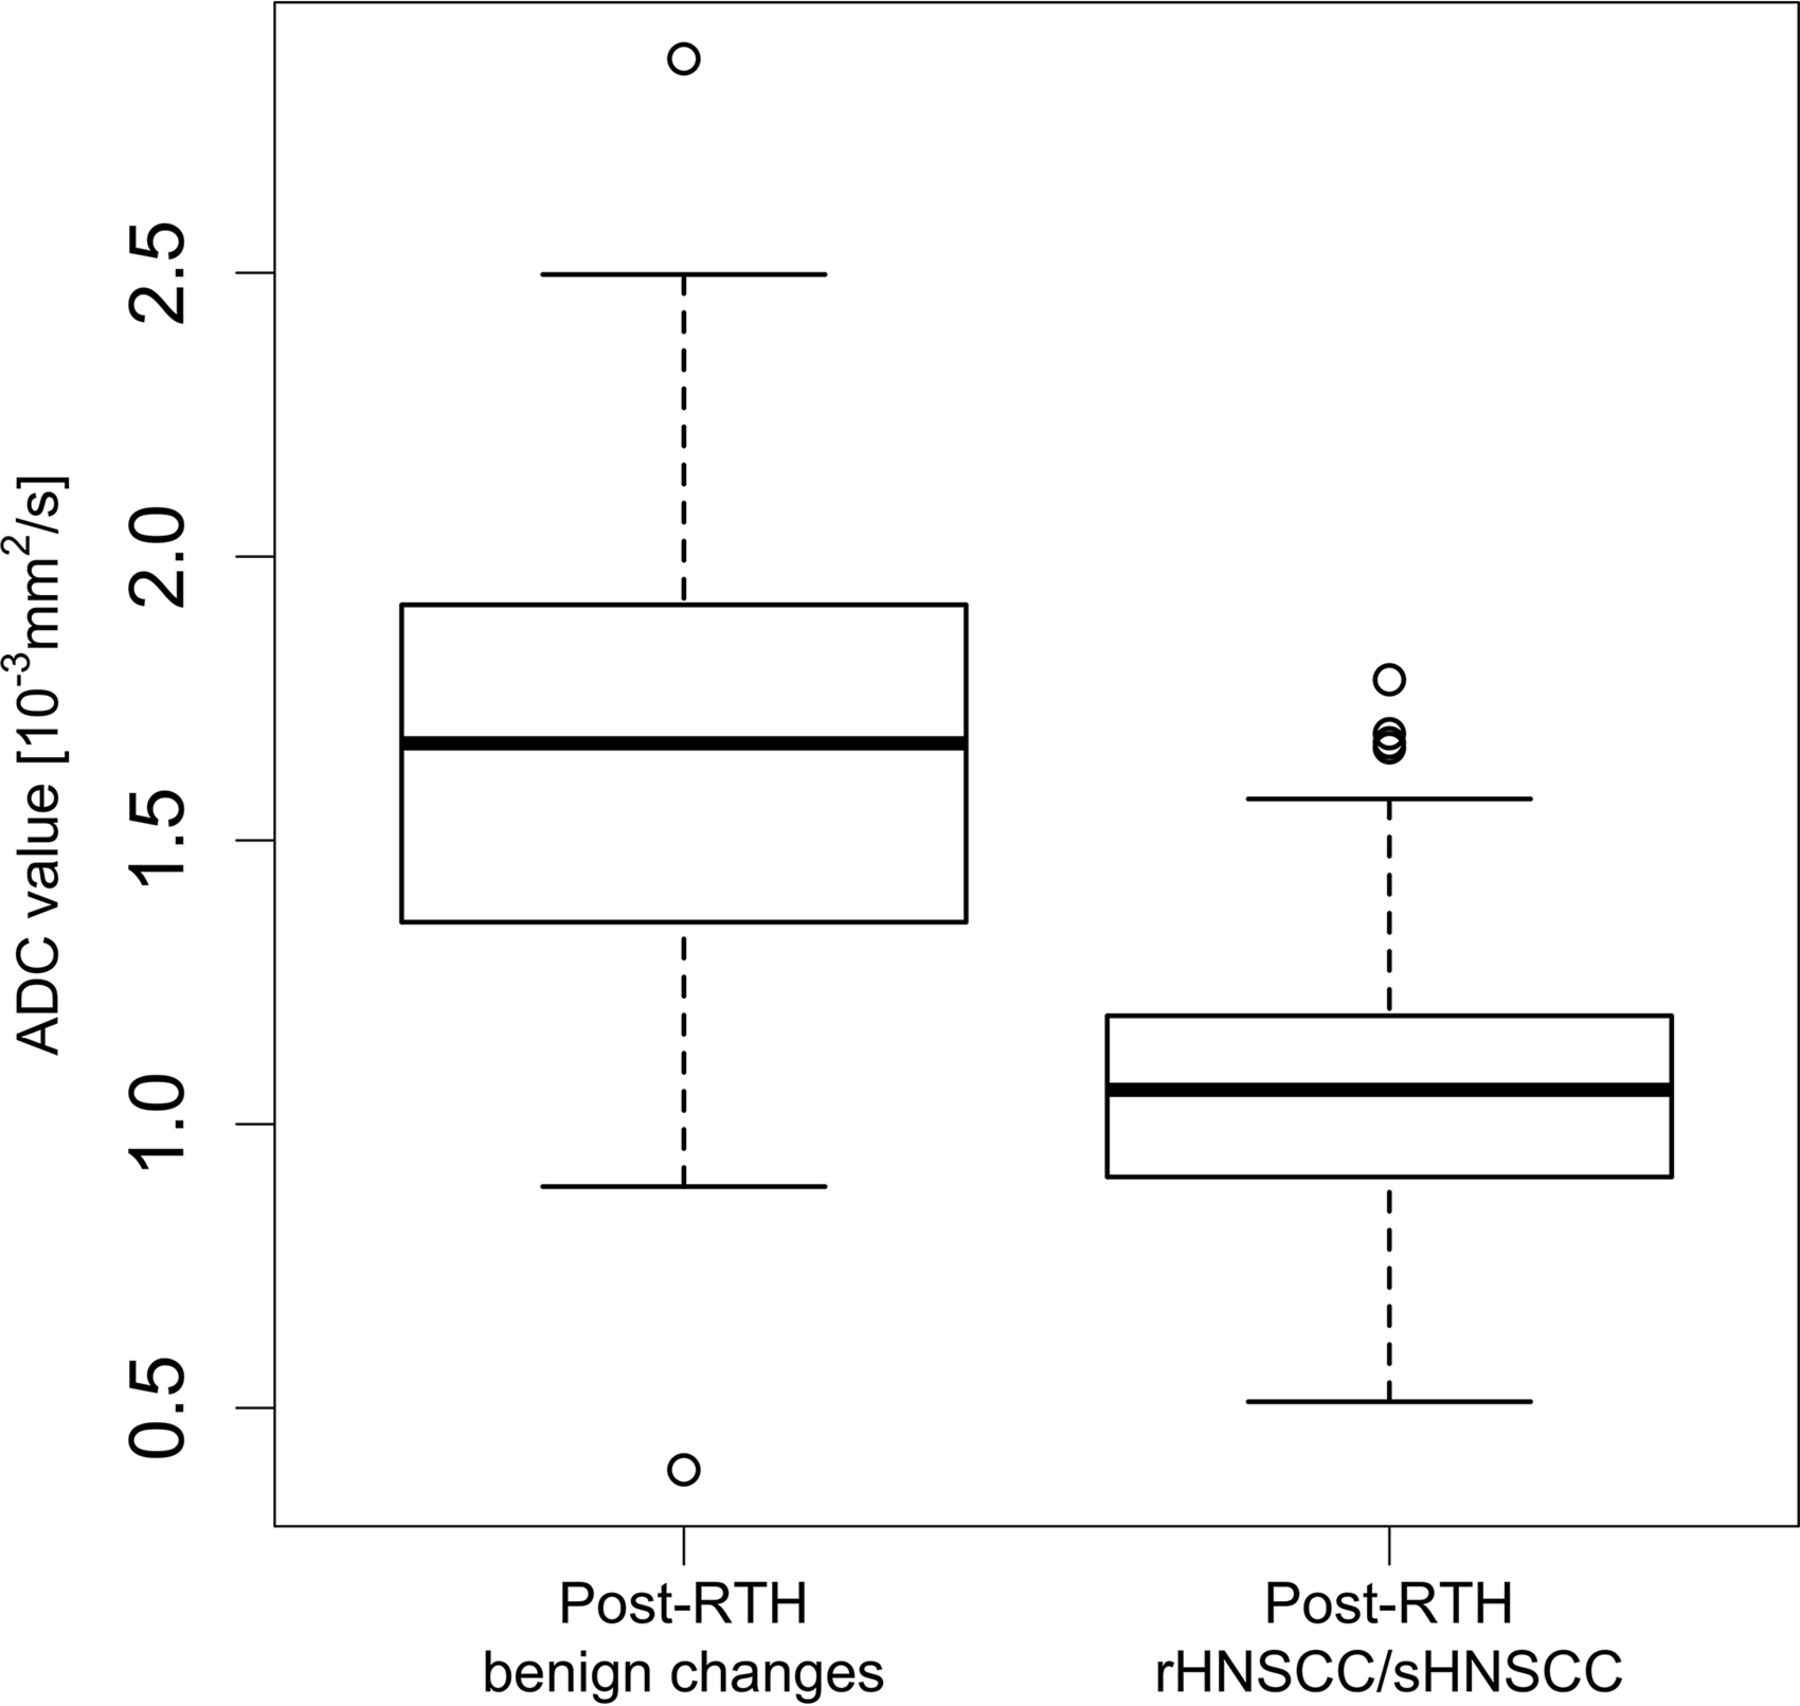
Quantitative DWIMRI analysis revealed that ADCmean values were significantly lower in rHNSCC/sHNSCC than in benign changes, despite overlap between both groups (mean ADCmean = 1.097 ± 0.295 × 10⁻³ mm2/s versus 1.659 ± 0.418 × 10⁻³ mm2/s, respectively; P < .001). Boxplots for ADCmean of benign-versus-malignant lesions are shown in Fig 4. Boxplots for ADCmean in post-RTH tumors versus late fibrosis and inflammatory edema revealed that late fibrosis had ADCmean values similar to those of malignant tumors (Fig 5). Mean ADCmean was 0.987 ± 0.264 × 10⁻³ mm2/s in post-RTH late fibrosis and 1.097 ± 0.295 × 10⁻³ mm2/s in tumors, respectively (P > .05).

Box-and-whisker plots of ADCmean values in patients with post-RTH changes and post-RTH tumors. The horizontal lines represent the median values, and the bottom and the top of the box represent the 25th and 75th quartiles, respectively. Median ADCmean (25th–75th quartiles) for rHNSCC/sHNSCC = 1.061 (0.907–1.191) × 10−3 mm2/s. Median ADCmean (25th–75th quartiles) for post-RTH changes (late fibrosis and inflammatory edema together) = 1.671 (1.3355–1.915) × 10−3 mm2/s.

Box-and-whisker plots of ADCmean values in patients with post-RTH inflammatory edema, late fibrosis, and post-RTH HNSCCs. The horizontal lines represent the median values; the bottom and the top of the box represent the 25th and 75th quartiles, respectively. Median ADCmean (25th–75th quartiles) for rHNSCC/sHNSCC = 1.061 (0.907–1.191) × 10−3 mm2/s. Median ADCmean (25th–75th quartiles) for post-RTH inflammatory edema = 1.764 (1.575–1.938) × 10−3 mm2/s. Median ADCmean (25th–75th quartiles) for late fibrosis/mature scar post-RTH = 1.068 (0.939–1.152) × 10−3 mm2/s. There was no statistically significant difference between ADCmean in late fibrosis and rHNSCC/sHNSCC (P > .05). However, there was a significant difference between ADCmean in inflammatory post-RTH edema and late fibrosis (P < .05).
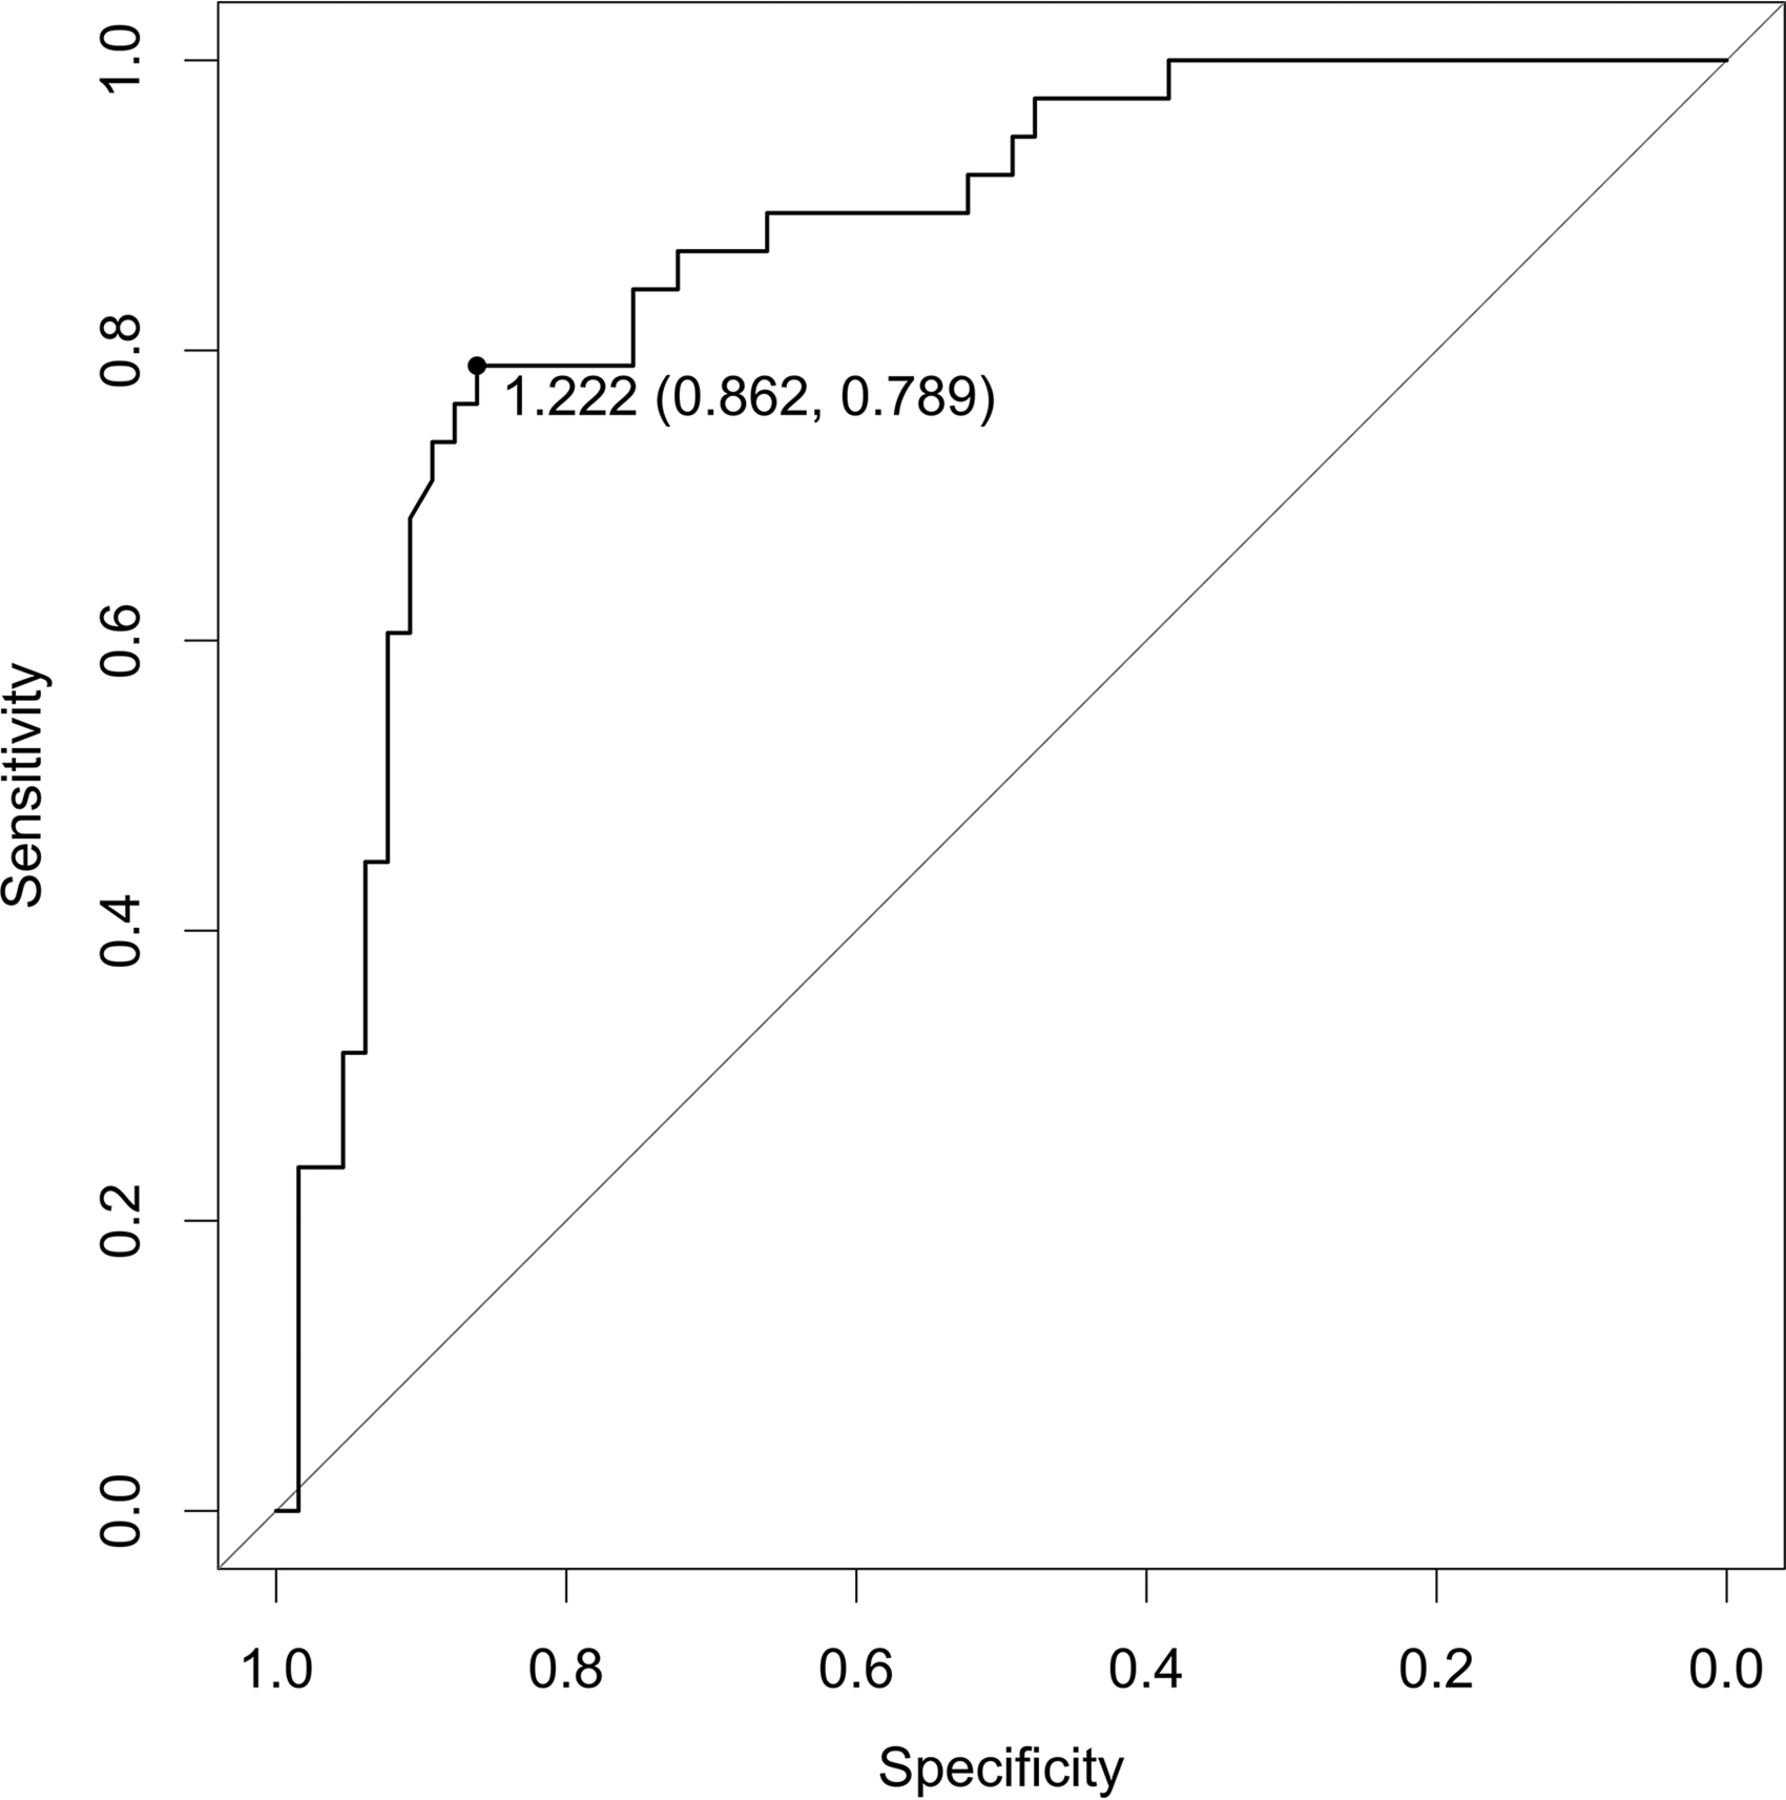
The receiver operating characteristics analysis of ADC measurements (Fig 6) provided an optimal ADCmean threshold of 1.222 × 10⁻³ mm2/s (sensitivity = 78.9%, specificity = 86.1%, positive predictive value = 76.9%, negative predictive value = 87.5%) for ADCmean values only.

Receiver operating characteristic curve for the quantitative analysis of ADCmean values showing the area under the curve of 0.8678. A threshold of ADC = 1.222 × 10⁻³ mm2/s was found (see description in the text). This threshold yielded a sensitivity of 78.9%, a specificity of 86.2%, and an accuracy of 83.5%.
Results for qualitative (visual) DWIMRI and quantitative DWIMRI (with an ADCmean threshold of < 1.22 × 10⁻³ mm2/s) are shown in Table 2. In comparison with morphologic MRI, qualitative and quantitative DWIMRI enabled the detection of post-RTH HNSCCs with poor morphologic conspicuity in 4 and 5 cases, respectively. Likewise, false-positive MRI interpretations were avoided with qualitative and quantitative DWIMRI in 10 and 11 instances, respectively. On the contrary, in comparison with DWI alone, morphologic MRI enabled avoiding 7 false-positive DWI evaluations due to the characteristic aspect of late fibrosis on T2 and facilitated the detection of 5 recurrent cancers, which were missed on DWI (On-line Fig 3).
Review of the Literature
For the discussion of our results, we have performed a review of the current literature for the detection of post-RTH HNSCC with DWIMRI and have calculated the respective likelihood ratios (On-line Table).
Discussion
The studies demonstrating the utility of DWIMRI for the detection of post-RTH HNSCC (On-line Table) are based on the knowledge that high cellularity of recurrent tumors results in low ADCmean values.5⇓⇓⇓–9,11⇓–13 It is speculated that post-RTH tissue changes (inflammatory edema, necrosis, fibrosis) lead to high ADCmean values. However, no study has examined the contribution of each post-RTH tissue change to the overall post-RTH ADCmean. Literature shows that despite sparse references, post-RTH cerebral gliosis may show low ADCmean and an abscess may show restricted diffusion.22 Moreover, rHNSCC with cystic or necrotic components may show high ADCmean. Despite this diversity, in all aforementioned studies, the ADCs of various post-RTH changes were grouped together as “post-RTH ADCmean” and were compared with the ADCs of rHNSCC. This comparison showed that the ADCmean values of the 2 groups substantially overlapped. Despite the use of similar DWI sequences, the ADC thresholds obtained by these studies for differentiating rHNSSC from post-RTH changes varied from 0.96 to 1.46 × 10⁻³ mm2/s.5⇓⇓–8,11⇓–13
Tshering Vogel et al5 have shown that major overlap of ADC values limits the ability of quantitative DWI to differentiate rHNSCC from post-RTH changes. In their study, combined morphologic MRI and qualitative DWI could detect rHNSCC more accurately than combined morphologic MRI and quantitative DWI. However, the criteria used for morphologic analysis were neither defined nor analyzed. In our study, there was no significant difference between the ADCmean of late fibrosis and rHNSCC/sHNSCC (P > .05). However, there was a significant difference between the ADCmean of post-RTH edema and late fibrosis (P < .05), with virtually no overlap between these 2 values. This finding highlights the drawback of grouping ADC values of all post-RTH changes together.
Both Abdel Razek et al7 and Vaid et al11 reported false-positive results with DWIMRI due to late fibrosis. Other studies have not discussed the causes of false-positive cases. Although the T2 appearance of late fibrosis has been briefly addressed by some authors, its diagnostic utility as a complementary tool to DWI and its impact on the diagnostic performance have not been analyzed.1,14,23 Because late fibrosis is mainly composed of densely packed collagen, ADCs tend to be low (T2 blackout effect) as opposed to RTH-induced inflammatory edema, which tends to have high ADCs. In the current study, morphologic MRI, mainly T2, enabled accurate diagnosis of late fibrosis, which otherwise may mimic rHNSCC on DWI.
Previous investigators have not compared the diagnostic performance of DWI with that of morphologic MRI. Data of the current series show that morphologic MRI with clearly defined criteria has a similar diagnostic performance to DWI alone; however, the combination of the 2 yields superior results. Careful analysis of signal intensities on morphologic MRI contributes significantly to an improved specificity of DWIMRI, whereas the overall effect on sensitivity is less pronounced.
The wide variability in sensitivity, specificity, and positive and negative predictive values of DWIMRI demonstrated by the aforementioned studies can be explained by several factors: histologic heterogeneity (HNSCC only versus HNSCC mixed with other tumor types), local recurrence only versus combined local and nodal recurrence, small sample size, varying tumor prevalence, and differences in ROI sampling.5⇓⇓–8,11⇓–13 Although sensitivity and specificity are not influenced by disease prevalence, they can vary depending on the disease spectrum in the study population. Disease prevalence has an important impact on the positive predictive value and a slightly weaker influence on the negative predictive value. Therefore, the use of a likelihood ratio as a measure of test accuracy overcomes the drawback of other metrics because it does not depend on disease prevalence.24 Consequently, the LRs from 1 study are applicable to other studies. A LR+ of >10 indicates a good diagnostic test for ruling in the diagnosis, whereas an LR− of <0.1 indicates a good test for ruling out the diagnosis.24 Results of our study show that quantitative DWIMRI was clearly superior to morphologic MRI and DWI alone because the LR+ and LR− (19.9 and 0.08, respectively) fulfilled the criteria of a good diagnostic test. Comparison with the literature further suggests that except for Vandecaveye et al,6 the LR+ and LR− of quantitative DWIMRI were suboptimal in all published series; the values were similar to those of DWI alone and morphologic MRI alone in the current study.
To the best of our knowledge, except for Vaid et al,11 none of the previous authors tested the interobserver reproducibility of their results regarding the assessment of post-RTH cases. In our study, the κ values for MRI and DWIMRI were >81%, suggesting almost perfect interobserver agreement.19 Therefore, our results are reproducible, provided that experienced readers perform the image analysis. Although the guidelines for the interpretation of interrater reliability proposed by Landis and Koch19 are widely used, several authors have questioned judgments about acceptable κ values in medical research.25 The κ statistic was initially designed to account for raters guessing on scores. Despite this advantage, the κ statistic may substantially lower the estimate of agreement. Therefore, reporting both κ and percentage agreement may represent a good compromise.25
Our study has some limitations. It is a retrospective study of patients from a single hospital, which could have created a selection bias. Exclusion of patients who were followed up with CT and PET/CT and those with nodal recurrence only was consistent with the aim of our study and was unavoidable. To maintain homogeneity of results, we included only patients scanned on a 1.5T MRI scanner. These factors could have further added to selection bias. Another study limitation is the lack of quantitative T2 and contrast-enhanced T1 signal analysis. Although categorizing signal intensity as high, intermediate, and low may appear somewhat subjective, this visual approach is widely used in HN routine and for the assessment of tumors in other organs. Quantification of T2 and T1 requires the additional acquisition of mapping sequences to calculate relaxation maps. Quantitative information can additionally be extracted with texture/histogram analysis. This postprocessing tool can be applied retrospectively to all images acquired in clinical routine.26,27 However, lack of standardized software, evolving research, and variable numeric algorithms currently limit the use of these new promising tools in clinical routine.
Conclusions
The combination of precise morphologic MRI criteria and quantitative DWI with an ADCmean < 1.22 × 10⁻³ mm2 has an excellent interobserver reproducibility and yields likelihood ratios of a good diagnostic test to rule in and out post-RTH rHNSCC/sHNSCC. Our study shows that morphologic MRI criteria and DWI are complementary and contribute differently to the overall diagnostic performance of combined DWIMRI.
References
- Received July 28, 2017.
- Accepted after revision December 2, 2017.
- © 2018 by American Journal of Neuroradiology


Jump to section
Related Articles
Cited By...
- Normalized Parameters of Dynamic Contrast-Enhanced Perfusion MRI and DWI-ADC for Differentiation between Posttreatment Changes and Recurrence in Head and Neck Cancer
- Adding MR Diffusion Imaging and T2 Signal Intensity to Neck Imaging Reporting and Data System Categories 2 and 3 in Primary Sites of Postsurgical Oral Cavity Carcinoma Provides Incremental Diagnostic Value
- ADC for Differentiation between Posttreatment Changes and Recurrence in Head and Neck Cancer: A Systematic Review and Meta-analysis
- MRI Posttreatment Surveillance for Head and Neck Squamous Cell Carcinoma: Proposed MR NI-RADS Criteria
- Detection of Local Recurrence in Patients with Head and Neck Squamous Cell Carcinoma Using Voxel-Based Color Maps of Initial and Final Area under the Curve Values Derived from DCE-MRI