
Abstract
BACKGROUND AND PURPOSE: Fast macromolecular proton fraction mapping is a recent quantitative MR imaging method for myelin assessment. The objectives of this study were to evaluate the macromolecular proton fraction as a measure of demyelination in subcortical GM structures in multiple sclerosis and assess a potential relationship between demyelination and excess iron deposition using the macromolecular proton fraction and T2* mapping.
MATERIALS AND METHODS: Macromolecular proton fraction and T2* maps were obtained from 12 healthy controls, 18 patients with relapsing-remitting MS, and 12 patients with secondary-progressive MS using 3T MR imaging. Parameter values in the caudate nucleus, globus pallidus, putamen, substantia nigra, and thalamus were compared between groups and correlated to clinical data.
RESULTS: The macromolecular proton fraction in all subcortical structures and T2* in the globus pallidus, putamen, and caudate nucleus demonstrated a significant monotonic decrease from controls to patients with relapsing-remitting MS and from those with relapsing-remitting MS to patients with secondary-progressive MS. The macromolecular proton fraction in all subcortical structures significantly correlated with the Expanded Disability Status Scale and MS Functional Composite scores with absolute Pearson correlation coefficient (r) values in a range of 0.4–0.6. Significant correlations (r = −0.4 to −0.6) were also identified between the macromolecular proton fraction and the 9-Hole Peg Test, indicating a potential relationship with nigrostriatal pathway damage. Among T2* values, weak significant correlations with clinical variables were found only in the putamen. The macromolecular proton fraction did not correlate with T2* in any of the studied anatomic structures.
CONCLUSIONS: The macromolecular proton fraction provides an iron-insensitive measure of demyelination. Myelin loss in subcortical GM structures in MS is unrelated to excess iron deposition. Subcortical GM demyelination is more closely associated with the disease phenotype and disability than iron overload.
ABBREVIATIONS:
- CN
- caudate nucleus
- EDSS
- Expanded Disability Status Scale
- GP
- globus pallidus
- MPF
- macromolecular proton fraction
- MT
- magnetization transfer
- NAWM
- normal-appearing WM
- PASAT3
- Paced Auditory Serial Addition Test with 3-second interstimulus intervals
- RRMS
- relapsing-remitting multiple sclerosis
- SN
- substantia nigra
- SPMS
- secondary-progressive multiple sclerosis
Demyelination represents a global pathologic factor underlying neural tissue damage in MS and affecting the entire CNS. Demyelination manifests as both macroscopic MS lesion formation and microscopic changes in normal-appearing WM (NAWM) and GM.1,2 Widespread demyelination in subcortical GM structures in MS has been established in pathologic studies.2⇓–4 While common pathologic features of neural tissue injury in MS include inflammation, demyelination, and neurodegeneration, a specific aspect of subcortical GM pathology is excessive iron accumulation in oligodendrocytes and, to a lesser extent, in neurons, microglia, and astrocytes, compared with the rest of the GM and WM.4
Although the clinical and pathogenetic roles of excess iron deposition in the subcortical GM structures are currently debatable,5 this phenomenon represents a common neuroradiologic sign in MS, manifest as abnormal hypointensity on T2-weighted images.6 Numerous studies involving iron-sensitive quantitative imaging techniques, such as T2, T2*, magnetic susceptibility, and magnetic field correlation mapping have demonstrated abnormally increased iron content in deep GM in MS.7⇓⇓–10 At the same time, quantitative assessment of subcortical GM demyelination is currently unavailable. The reason is the interplay between the effects of myelin and iron on tissue relaxation properties. Particularly, methods for quantitative or semiquantitative myelin imaging based on single- or multicomponent T1, T2, and T2* relaxation models11⇓⇓–14 are inapplicable to anatomic regions with a large and/or highly variable iron content. Similarly, a parameter frequently associated with myelination, magnetization transfer (MT) ratio, is not representative of changes in myelination in the presence of paramagnetic ions because it is subjected to the compounded effects of cross-relaxation and T1.15
A new quantitative myelin imaging method, fast macromolecular proton fraction (MPF) mapping,16⇓⇓–19 offers the possibility of assessing demyelination in iron-rich anatomic structures due to the insensitivity of MPF to changes in relaxation properties of tissues caused by paramagnetic ions. MPF is a key parameter determining the MT effect in tissues and defined within the 2-pool model of MT as a relative number of macromolecular protons involved into cross-relaxation with water protons.16 A number of animal studies have demonstrated close associations between MPF and myelin content in both WM and GM,20⇓⇓⇓–24 thus supporting clinical applications of this parameter as a myelin biomarker. It has been demonstrated that MPF measurements are practically insensitive to large variations in T1 caused by a paramagnetic contrast agent in an animal tumor model.25 The recently developed single-point MPF mapping method has enabled reconstruction of MPF maps in isolation from other 2-pool model parameters based on a single MT-weighted image16,17 and has shown promise as a fast clinical quantitative myelin imaging approach in MS18 and mild traumatic brain injury19 studies. Due to the insensitivity of MPF to changes in tissue relaxation associated with paramagnetic ions, fast MPF mapping offers the possibility of in vivo studies of demyelination in iron-rich brain structures without the confounding effect of iron deposition. The goals of this study were to compare the MPF in subcortical GM structures between healthy controls and patients with MS with different disease phenotypes, assess a potential relationship between MPF and T2* as measures of demyelination and iron deposition in deep GM, and evaluate associations of the above quantitative imaging metrics with common clinical disability scales and tests of motor and cognitive function in MS.
Materials and Methods
Study Population
We analyzed the data of a previously reported prospective cross-sectional case-control study.18 The study was approved by the institutional review board at the University of Washington, and written informed consent was obtained from all participants. The study population included 18 patients with relapsing-remitting MS (RRMS) (12 women; mean age, 48.2 ± 10.8 years; range, 30–62 years; mean Expanded Disability Status Scale [EDSS] score, 2.9 ± 1.8; range, 1.0–6.5), 12 patients with secondary-progressive MS (SPMS) (7 women; mean age, 56.0 ± 6.8 years; range, 42–67 years; mean EDSS score, 6.7 ± 0.8; range, 5.5–8.0), and 12 healthy controls (6 women; mean age, 41.1 ± 8.9 years; range, 28–57 years). Available clinical data for patients with MS included the EDSS score, disease duration, the Multiple Sclerosis Functional Composite26 score, and its component test scores (25-Foot Timed Walk Test, 9-Hole Peg Test, and Paced Auditory Serial Addition Test with 3-second interstimulus intervals [PASAT3]). Detailed characteristics of the study population can be found elsewhere.18 Note that data from 12 of 14 initially reported18 healthy controls were used in this study because T2* maps were unavailable for 2 participants.
MR Imaging Protocol
Images were acquired using a 3T MR imaging scanner (Achieva; Philips Healthcare, Best, the Netherlands) with a transmit-receive head coil. A fast 3D whole-brain MPF mapping protocol18 included gradient-echo sequences with and without off-resonance MT saturation, variable flip angle T1 mapping,27 and B028 and B127,29 field mapping. 2D T2-weighted FLAIR images were acquired for lesion segmentation. Parameters of the above imaging sequences are detailed elsewhere.18 Additionally, whole-brain T2* mapping was performed using a 3D multiple gradient-echo sequence with 8 echoes: TR = 37.5 ms, first TE = 2.3 ms, echo spacing = 3.2 ms, flip angle = 10°, FOV = 240 × 180 × 184 mm3, matrix = 160 × 160 × 46, resolution = 1.5 × 1.5 × 4 mm3 (interpolated to 1 × 1 × 2 mm3), and scan time = 3 minutes 25 seconds. The MPF and T2* mapping scans were obtained in the axial plane with the same spatial resolution and coverage.
Image Processing and Analysis
MPF maps were reconstructed with the single-point algorithm16 using in-house-written C-language software as detailed in the earlier study.18 T2* maps were reconstructed by the voxel-based monoexponential 2-parameter fit of a squared noise-corrected signal30 using in-house-written C-language software. Noise-correction factors for each dataset were determined from averaged SDs in 4 ROIs placed in the areas free from the signal and artifacts.
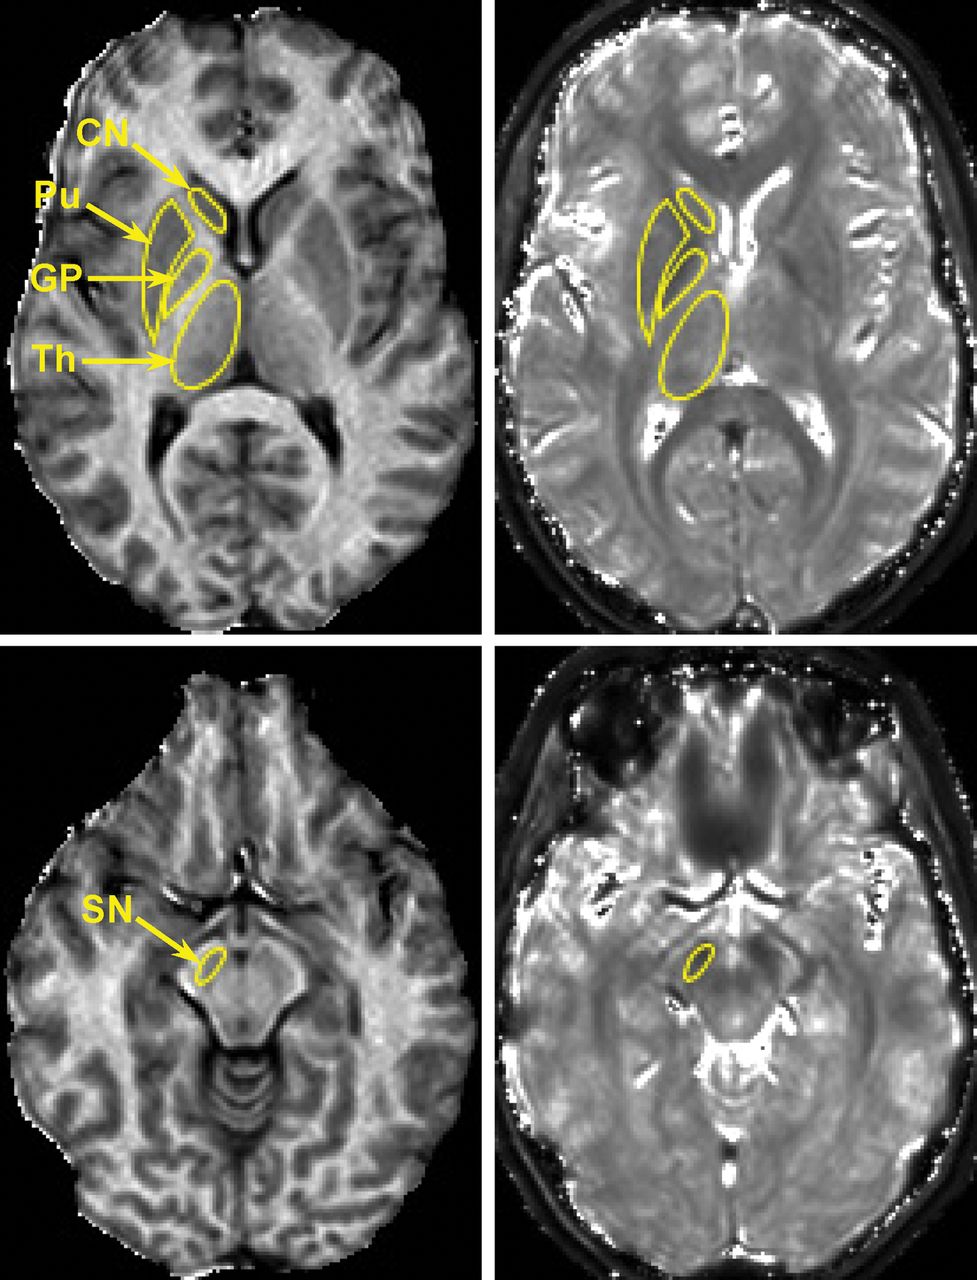
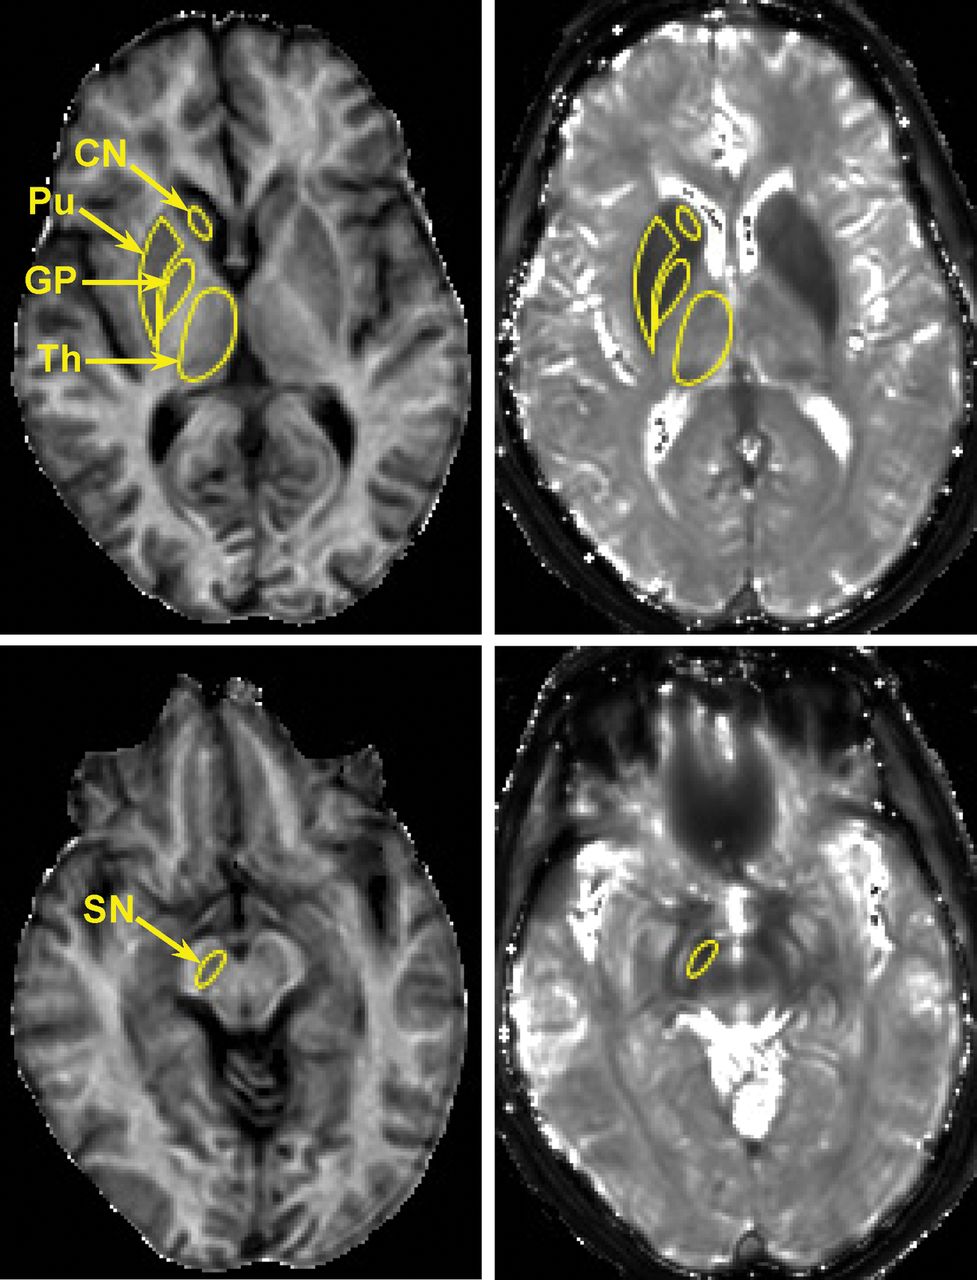
The head of caudate nucleus (CN), globus pallidus (GP), putamen, substantia nigra (SN), and thalamus were outlined manually on MPF maps using ImageJ software (National Institutes of Health, Bethesda, Maryland). T2* measurements were performed in ROIs transferred from MPF maps. Parameter values for each subject were obtained by averaging bilateral measurements on the 3 adjacent cross-sections. ROI measurements were performed by 2 operators blinded to clinical information and then averaged. Examples of ROI placement corresponding to the above subcortical anatomic structures are provided in Figs 1 and 2. The results of brain segmentation into WM (NAWM for patients with MS), GM, and MS lesions were available from the previous study.18

Representative cross-sections of 3D MPF (left) and T2* (right) maps obtained from a healthy female control subject (37 years of age) with superimposed ROIs corresponding to the head of caudate nucleus, globus pallidus, putamen (Pu), substantia nigra, and thalamus (Th). MPF and T2* maps are presented with gray-scale windows corresponding to the MPF range of 0%–20% and the T2* range of 0–100 ms.

Representative cross-sections of 3D MPF (left) and T2* (right) maps obtained from a female patient with SPMS (62 years of age; EDSS score, 5.5) with superimposed ROIs corresponding to the head of caudate nucleus, globus pallidus, putamen (Pu), substantia nigra, and thalamus (Th). MPF and T2* maps are presented with gray-scale windows corresponding to the MPF range of 0%–20% and the T2* range of 0–100 ms.
Statistical Analysis
The normality of data within subject groups was assessed using the Shapiro-Wilk test. No significant deviations from the normal distribution were detected, and parametric analyses were used thereafter. Interoperator variability was assessed by the coefficient of variation and intraclass correlation coefficient. Mean parameter values in subcortical structures were compared among the 3 subject groups (controls, RRMS, and SPMS) using 1-way ANOVA followed by post hoc pair-wise tests with the Fisher least significant difference correction for multiple comparisons. Associations between imaging and clinical data were investigated using bivariate linear regression and the Pearson correlation coefficient (r). The Shapiro-Wilk test was used to assess the normality of regression residuals, and appropriate transformations were used to correct for significant deviations from the normal distribution if detected. Additionally, multivariate regression models were tested using a stepwise variable elimination procedure to identify which of the previously reported18 whole-brain imaging variables (MPF in NAWM, GM, and lesions, and lesion volume) or their combinations could better explain quantitative measurements in the basal ganglia. Two-tailed tests were used in all analyses. P values < .05 indicated significant differences. All statistical analyses were performed using SPSS software (IBM, Armonk, New York) except for intraclass correlation coefficient calculations, which were performed in MedCalc (MedCalc Software, Mariakerke, Belgium). Data are presented as mean ± SD where applicable.
Results
MPF and T2* Measurements in the Basal Ganglia
MPF maps enabled clear anatomic definition of subcortical GM structures based on their hypointensity relative to surrounding WM in all cases (Figs 1 and 2). The appearance of these structures on T2* maps was frequently obscured by the blooming effect, especially in the cases with excessive iron deposition (Fig 2). Manual MPF measurements were highly consistent between observers, with a coefficient of variation of <2.5% and an intraclass correlation coefficient of >0.9 (Table 1). T2* measurements demonstrated higher variability with a coefficient of variation in the range of 1.8%–10.3%, but they still had excellent overall agreement (intraclass correlation coefficient ≥ 0.8, Table 1).
Coefficients of variation and intraclass correlation coefficients for interobserver agreement in MPF and T2* measurements in the subcortical GM structures
Mean MPF and T2* measurements in the subcortical GM structures of the study participant groups are summarized in Table 2. Monotonic trends of a decrease in both MPF and T2* from controls to patients with RRMS and from patients with RRMS to those with SPMS were observed in all subcortical structures except for T2* in the thalamus. ANOVA revealed the significance of these trends for all variables except for T2* in the SN. Pair-wise comparisons identified significant differences among all 3 groups for the MPF in the GP and putamen. In the CN and SN, the MPF was not significantly different between patients with RRMS and controls, but a significant decrease was found in the SPMS group compared with both controls and patients with RRMS. The MPF in the thalamus was significantly lower in both MS phenotypes compared with controls, but the difference between patients with RRMS and SPMS did not reach significance. T2* in the GP, putamen, and CN was significantly shortened in patients with SPMS compared with controls. Additionally, T2* in the CN was significantly shorter in the RRMS group relative to controls. A significant difference in T2* between the RRMS and SPMS groups was found only in the putamen.
Mean group MPF and T2* in the subcortical GM structuresa
Associations of MPF and T2* in the Basal Ganglia with Clinical Status in MS
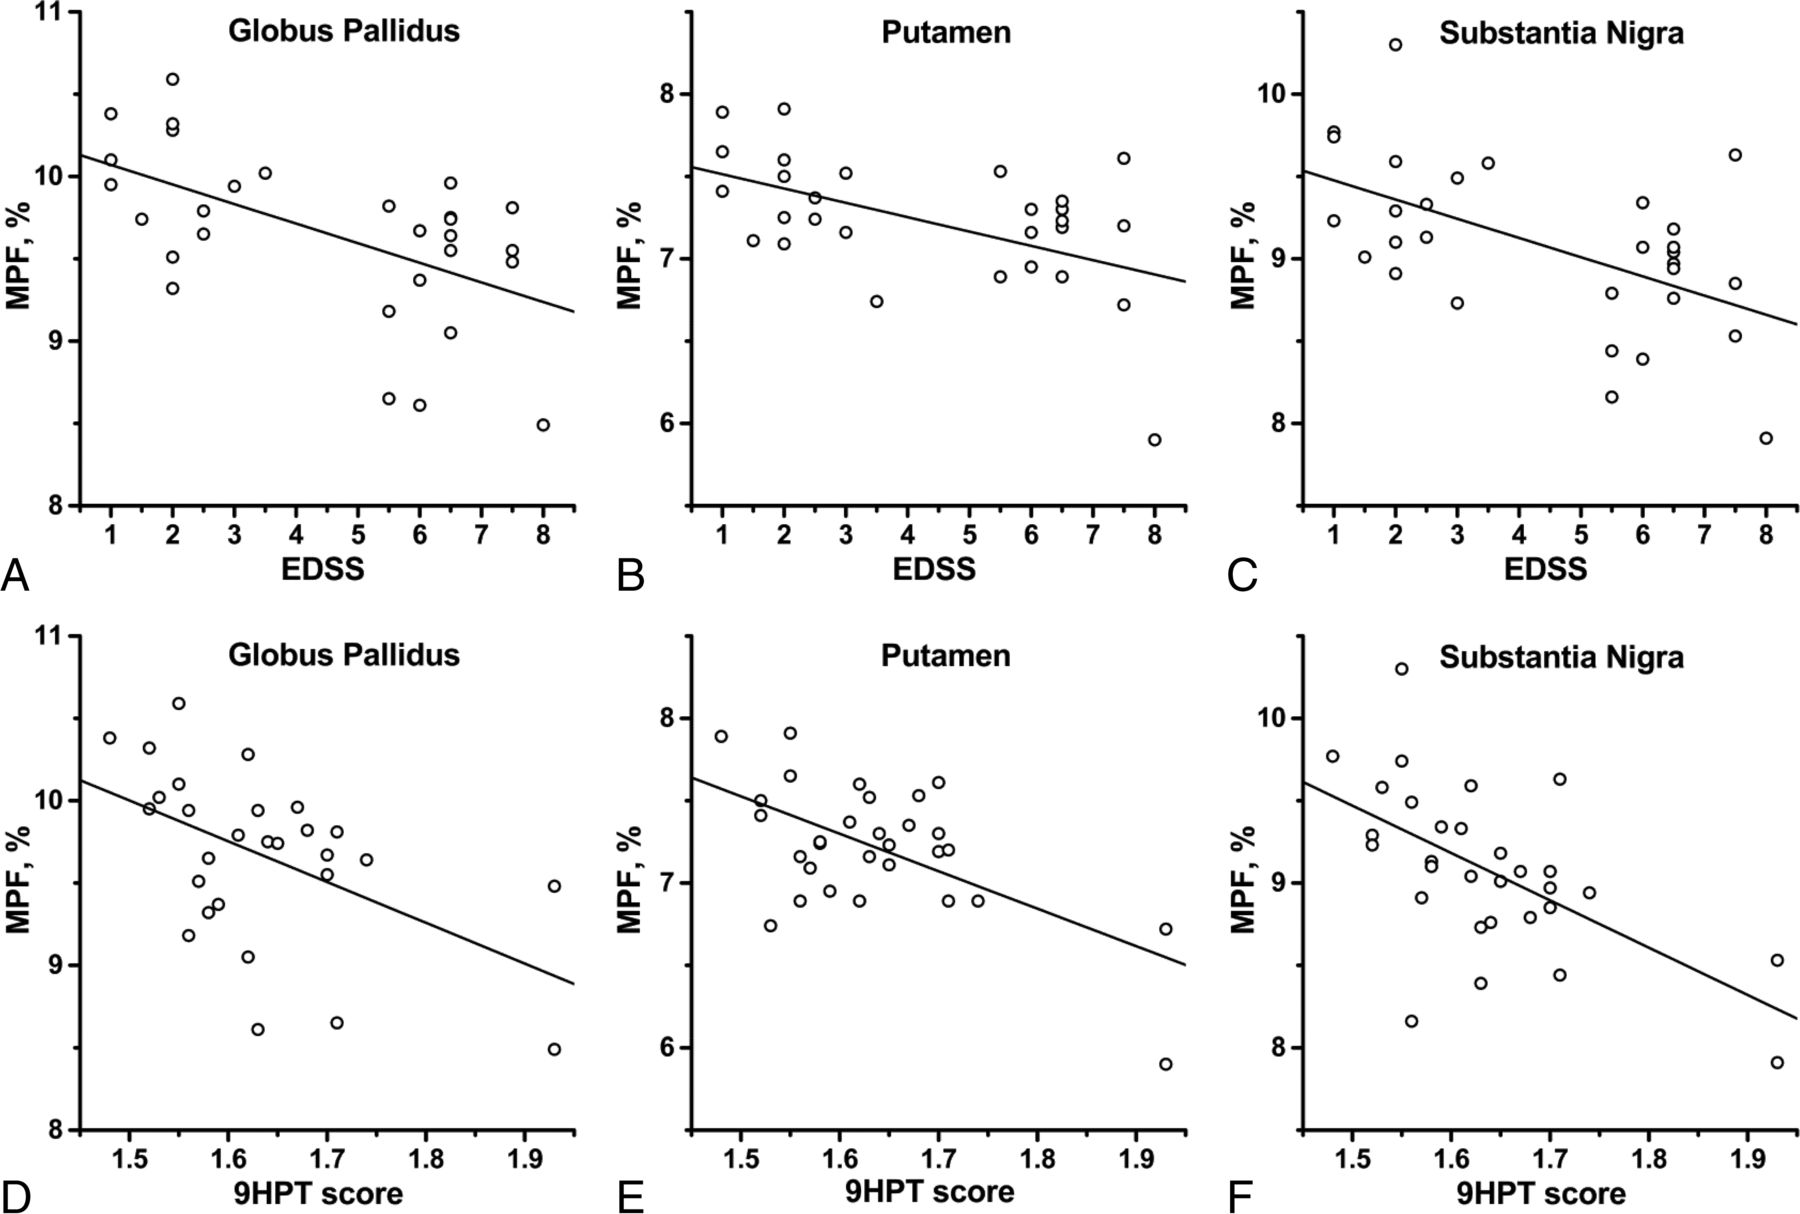
Correlations between quantitative imaging measures in the subcortical GM structures and clinical variables in patients with MS are listed in Table 3. Plots of selected correlations are presented in Fig 3. MPF in all subcortical structures significantly positively correlated with the Multiple Sclerosis Functional Composite and negatively with the EDSS scores, as well as with the 9-Hole Peg Test. For other Multiple Sclerosis Functional Composite components, significant correlations of moderate strength were found for MPF in the GP and putamen (with 25-Foot Timed Walk and PASAT3 tests) and SN (with PASAT3). The MPF in the putamen, SN, and thalamus also correlated with the disease duration. Moderate significant correlations with patients' ages were found for MPF in all structures except the putamen.
Correlations between quantitative imaging measures in the subcortical GM structures and clinical variables in patients with MSa

Scatterplots of correlations between clinical variables (EDSS [A–C] and 9-Hole Peg Test score [D–F]) and the MPF in the GP (A and D), putamen (B and E), and SN (C and F). Lines represent linear regression plots. Correlation coefficients are given in Table 3. The 9-Hole Peg Test scores were Box-Cox transformed with the power of −0.5.
Among T2* measurements, weak-but-significant correlations with EDSS, the 25-Foot Timed Walk Test, disease duration, and age were identified for the putamen. T2* values in other structures did not significantly correlate with clinical variables (Table 3).
Correlations among Imaging Variables
Correlations between MPF and T2* in the subcortical GM structures are summarized in Table 4. Correlations of both measures with global MPF measurements in brain tissues and lesion volume reported earlier for the same population18 are provided in Table 5. No significant correlations between MPF and T2* in the investigated structures were found in either patients with MS or controls taken separately. In the combined sample, weak-but-significant positive correlations were found in the GP and putamen, which are likely driven by the global group differences (a decrease of both MPF and T2* in patients with MS).
Correlations between MPF and T2* in the subcortical GM structures
Correlations between quantitative imaging measures in the subcortical GM structures and global imaging variables in patients with MSa
The MPF in all subcortical structures demonstrated moderate-to-strong correlations with whole-brain MPF in NAWM and GM (Table 5). The MPF in the GP and SN also showed moderate correlations with MPF in MS lesions. T2* in all structures did not correlate with any global imaging variable. Lesion volume did not correlate with any quantitative imaging variables except for a marginally significant (P = .04) correlation with MPF in the putamen. Inclusion of global imaging variables into multivariate regression models (data not shown) did not improve the explanation of any of the subcortical GM measures. MPF in WM remained a single significant predictor of MPF in all examined structures in stepwise analyses.
Discussion
Being naturally rich in iron, subcortical GM structures represent an extremely difficult target to study demyelination by conventional and quantitative MR imaging because signal changes associated with myelin loss can be easily obscured by the variable paramagnetic effect of iron. The clinical role of demyelination in the subcortical nuclei in MS has not been established to date, and the evidence of myelin loss in these structures is based on postmortem studies.2⇓–4 Application of the MPF as an iron-insensitive myelin biomarker enabled in vivo confirmation of earlier pathologic findings of significant demyelination of subcortical GM in MS.2⇓–4 Furthermore, significant correlations between MPF in subcortical GM and clinical scales and the capability of MPF to discriminate the disease phenotypes indicate the clinical relevance of this parameter. The trends of demyelination in the basal ganglia and thalamus found in this study have common features with global demyelination in both NAWM and GM because correlations of MPF in subcortical GM structures with global MPF values in NAWM and GM are rather similar. At the same time, these correlations are not very strong and explain only 30%–40% of data dispersion within either univariate or multivariate models. In view of good interobserver agreement and low variability in MPF measurements,17,24 this observation cannot be completely attributed to measurement noise.
The correlations between MPF in subcortical GM structures and disability scales appeared systematically weaker than those for cortical GM and more similar in strength to the correlations for NAWM reported earlier for the same patient population.18 In contrast to global NAWM and GM values,18 the MPF in the 2 structures (CN and SN) also showed no significant differences between patients with RRMS and controls. Notably, the MPF in the basal ganglia showed the strongest correlations with the 9-Hole Peg Test scores compared with other clinical tests (Table 3). Because this test measures the fine motor function of the upper extremities, our observation may indicate that demyelination detected by MPF in the CN, GP, putamen, and SN reflects the damage to the nigrostriatal pathway, which functionally manifests as motor impairment. Taken together, the above observations suggest that the subcortical GM structures may not follow a uniform trajectory of myelin loss in MS and that demyelination in different nuclei may have different clinical significances.
The absence of significant correlations between MPF and T2* in the subcortical GM structures in patients with MS found in this study suggests that demyelination and excess iron deposition in subcortical GM represent unrelated pathologic processes with different clinical relevance. Literature data about the clinical significance of iron accumulation in subcortical GM in MS are controversial.5⇓⇓⇓⇓–10 Our results are in agreement with multiple reports of a significant increase of the iron load in the basal ganglia in MS based on quantitative iron-sensitive MR imaging measures or T2 hypointensity.6⇓⇓⇓–10 However, similar to this study, published cross-sectional correlations between MR imaging–based iron measures and clinical scales were moderate to insignificant.6⇓⇓⇓–10 On the other hand, there is some evidence of a higher clinical relevance of excess iron deposition in the deep GM in the longitudinal aspect.31,32 A possible pathogenetic role of iron in MS is associated with its cytotoxic effect, causing oxidative stress and mitochondrial injury.5 The cytotoxicity of iron is mainly attributed to its reactive ferrous oxidative form that may result from free ferric iron released into the extracellular space as a result of oligodendrocyte and myelin obliteration.4,5
On the other hand, the paramagnetic effect responsible for shortening tissue magnetic relaxation times is primarily caused by ferric iron bound to ferritin,33 a protein enabling iron storage and transport in a nontoxic form.4,5 Thus, a visible effect of iron accumulation due to formation of a superparamagnetic ferritin complex may not be indicative of the actual flux of iron from damaged myelin and oligodendrocytes, as well as the free iron concentration in the extracellular space determining the potential for oxidative stress. Furthermore, excess iron deposition into the ferritin storage in the basal ganglia may provide a protective homeostatic mechanism against iron-related oxidative tissue injury.5 In summary, our results do not suggest a direct relationship between demyelination and iron deposition in the deep GM in MS, while further investigations of the dynamics of these processes in longitudinal studies may provide more insight.
This study demonstrates a general methodology enabling quantitative assessment of myelin loss in subcortical GM. The fact that MPF and T2* do not correlate in the sample characterized by high disease-related variability of both parameters confirms the independence of the MPF measured by the single-point method of the iron content. Hypothetically, one might expect that high iron concentrations could affect MPF measurements through unaccounted errors caused by the direct saturation effect. More specifically, single-point MPF mapping is based on the assumption about the constant product of the measured R1 = 1/T1 and T2 of free water protons defined within the 2-pool model of MT.16 This product is used within the MPF reconstruction algorithm16 as a constraint for the term associated with direct saturation of water protons and may be tissue-dependent. However, in agreement with the theory,16 the use of a sufficiently high offset frequency (4 kHz) in the MPF mapping protocols18 makes potential MPF errors associated with the variability of R1 and T2 of free water protons in tissues practically negligible, as evidenced by both the absence of correlations between MPF and T2* and visual hypointensity of the basal ganglia on MPF maps observed even in cases of very high iron load (Fig 2). Accordingly, this study confirms that MPF provides a robust myelin biomarker that can be applied to studies of iron-rich brain structures in a variety of pathologic conditions associated with excess iron deposition such as Parkinson, Alzheimer, and other neurodegenerative diseases.33,34
This study has several limitations. First, due to the cross-sectional design, the results of this study should be considered preliminary and the value of both demyelination and iron deposition in the basal ganglia in the aspects of disease prognosis and treatment monitoring remains to be investigated. Second, our interpretation of T2* values in terms of iron load may be an oversimplification because this parameter is affected by various pathologic factors, including demyelination and changes in tissue water content and perfusion.33,35,36 Particularly, demyelination may cause elongation of T2* values, a trend opposite to the effect caused by iron accumulation.35 However, iron remains the dominant factor determining T2* in brain tissues, even with a low background iron content.35,36 Third, while myelin content has been established as the main histologic determinant of MPF in brain tissues,21,24 minor effects of other pathologic factors, such as inflammation, gliosis, and loss of neuronal arborization, on this parameter cannot be completely excluded. Fourth, we did not use a contrast agent due to the research nature of the imaging protocol and safety considerations. Thus, future studies involving contrast enhancement are needed to investigate a potential relationship between subcortical GM demyelination and active inflammation. Finally, parametric maps used in this study were obtained with relatively low resolution (1.5 mm2 in-plane). Accordingly, the observed associations may be, to some extent, affected by changes in surrounding WM due to the partial volume effect.
Conclusions
This study demonstrated that the fast MPF mapping method enables accurate quantitative assessment of demyelination in iron-rich subcortical GM structures and provides an iron-insensitive imaging biomarker of myelin. Our results confirm earlier histologic findings of demyelination in the basal ganglia in MS and suggest that the loss of myelin in subcortical GM is associated with disability and motor impairment and is unrelated to excess iron deposition.
Footnotes
Disclosures: Vasily L. Yarnykh—RELATED: Grant: National Institutes of Health, National Multiple Sclerosis Society, Ministry of Education and Science of the Russian Federation, Comments: National Institutes of Health grant R21EB009908, National Multiple Sclerosis Society grant RG4864A1/1, Ministry of Education and Science of the Russian Federation State Assignment Project No. 18.2583.2017/4.6.* Elena P. Krutenkova—RELATED: Grant: Ministry of Education and Science of the Russian Federation, Comments: Ministry of Education and Science of the Russian Federation State Assignment Project No. 18.2583.2017/4.6.* Gulsum Aitmagambetova—RELATED: Grant: Ministry of Education and Science of the Russian Federation, Comments: Ministry of Education and Science of the Russian Federation State Assignment Project No. 18.2583.2017/4.6.* Pavle Repovic—RELATED: Grant: National Institutes of Health, National Multiple Sclerosis Society, Comments: National Institutes of Health grant R21EB009908, National Multiple Sclerosis Society grant RG4864A1/1*; UNRELATED: Grants/Grants Pending: Novartis*; Payment for Lectures Including Service on Speakers Bureaus: Acorda Therapeutics, Biogen Idec, Genentech, Genzyme, EMD Serono, Novartis, Pfizer, Teva Pharmaceutical Industries.* Peiqing Qian—RELATED: Grant: National Institutes of Health grant R21EB009908, National Multiple Sclerosis Society grant RG4864A1/1*. Beena Gangadharan—RELATED: Grant: National Institutes of Health grant R21EB009908, National Multiple Sclerosis Society grant RG4864A1/1*. James D. Bowen—RELATED: Grant: National Institutes of Health grant R21EB009908, National Multiple Sclerosis Society grant RG4864A1/1.* *Money paid to the institution.
Data acquisition was supported by the National Institutes of Health (grant R21EB009908) and National Multiple Sclerosis Society (grant RG 4864A1/1). Data analysis was performed under support from the Ministry of Education and Science of the Russian Federation within the State Assignment Project No. 18.2583.2017/4.6.
Paper previously presented in part at: Annual Meeting of the American Neurological Association, September 27–29, 2015; Chicago, Illinois. Abstract S514.
Indicates open access to non-subscribers at www.ajnr.org
References
- Received September 29, 2017.
- Accepted after revision November 28, 2017.
- © 2018 by American Journal of Neuroradiology


