
Abstract
BACKGROUND AND PURPOSE: Deep gray matter iron accumulation is increasingly recognized in association with multiple sclerosis and can be measured in vivo with MR imaging. The cognitive implications of this pathology are not well-understood, especially vis-à-vis deep gray matter atrophy. Our aim was to investigate the relationships between cognition and deep gray matter iron in MS by using 2 MR imaging–based iron-susceptibility measures.
MATERIALS AND METHODS: Forty patients with multiple sclerosis (relapsing-remitting, n = 16; progressive, n = 24) and 27 healthy controls were imaged at 4.7T by using the transverse relaxation rate and quantitative susceptibility mapping. The transverse relaxation rate and quantitative susceptibility mapping values and volumes (atrophy) of the caudate, putamen, globus pallidus, and thalamus were determined by multiatlas segmentation. Cognition was assessed with the Brief Repeatable Battery of Neuropsychological Tests. Relationships between cognition and deep gray matter iron were examined by hierarchic regressions.
RESULTS: Compared with controls, patients showed reduced memory (P < .001) and processing speed (P = .02) and smaller putamen (P < .001), globus pallidus (P = .002), and thalamic volumes (P < .001). Quantitative susceptibility mapping values were increased in patients compared with controls in the putamen (P = .003) and globus pallidus (P = .003). In patients only, thalamus (P < .001) and putamen (P = .04) volumes were related to cognitive performance. After we controlled for volume effects, quantitative susceptibility mapping values in the globus pallidus (P = .03; trend for transverse relaxation rate, P = .10) were still related to cognition.
CONCLUSIONS: Quantitative susceptibility mapping was more sensitive compared with the transverse relaxation rate in detecting deep gray matter iron accumulation in the current multiple sclerosis cohort. Atrophy and iron accumulation in deep gray matter both have negative but separable relationships to cognition in multiple sclerosis.
ABBREVIATIONS:
- DGM
- deep gray matter
- GP
- globus pallidus
- NPtotal
- composite z-score across neuropsychological tests
- PASAT
- Paced Auditory Serial Addition Test
- QSM
- quantitative susceptibility mapping
- R2*
- transverse relaxation rate
- SDMT
- Symbol Digit Modalities Test
- SPART
- 10/36-Spatial Recall Test
- SRT
- Selective Reminding Task
Cognitive problems occur in 40%–65% of individuals with multiple sclerosis, predominantly affecting information processing speed and episodic memory.1 Subcortical atrophy, particularly in the thalamus, is well-known to predict cognitive deficits in MS.2 Elevated levels of iron accumulation in deep gray matter (DGM) nuclei in MS have also been reported using different iron-sensitive MR imaging measures, with studies focusing particularly on the large basal ganglia nuclei (caudate, putamen, globus pallidus [GP]), and the thalamus).3 Excess iron catalyzes production of free radicals, promoting neurodegeneration. This affects the DGM in both healthy aging and different CNS disorders.4 DGM iron accumulation in MS may be an epiphenomenon of structural atrophy caused by cell death,5 but others reported no relationships between DGM iron, global/regional brain volumes, or lesion load, suggesting potentially independent pathologies.6 The functional implications of DGM iron accumulation relative to other DGM pathologies in MS need further examination. Previous studies have examined some aspects of cognitive functions and DGM iron in MS with 4 different MR techniques.5,7⇓⇓⇓–11 Among the MR imaging measures used, only the gradient-echo transverse relaxation rate (R2*) and quantitative susceptibility mapping (QSM) have been validated against postmortem iron assessment, both in non-MS12,13 and in MS populations.14,15
Three MS studies assessed different aspects of cognition along with R2*.5,10,11 In Khalil et al,5 R2* in the basal ganglia (but not in the thalamus) was related to processing speed in patients with clinically isolated syndrome and those with MS. In Pinter et al,10 a neuropsychological composite score of cognitive efficiency/processing speed (but not memory) of patients with clinically isolated syndrome and patients with MS was reported. This was predicted by R2* relaxation rates averaged across basal ganglia nuclei, along with caudate volume and T2 lesion load. Schmalbrock et al11 recently cross-examined QSM and R2* measures against performance in 2 inhibitory cognitive tasks (a Stroop Task and an Eriksen Flanker Task) in patients with relapsing-remitting MS, imaged at 7T. Inhibition in the Flanker Task (but not the Stroop Task) was related to caudate and anterior putamen iron assessed with QSM, but performance in neither task was related to R2* measures. Thus, only 1 study11 directly compared the cognitive correlates of R2* and QSM-based iron measures in MS, but it did not control for atrophy in the same DGM regions.
The objective of our study was to determine whether cognition in MS, measured by the Brief Repeatable Battery of Neuropsychological Tests, is related to DGM iron accumulation measured with R2* and QSM at a high field strength (4.7T). The core hypothesis was that iron (R2* and QSM) in DGM nuclei correlates with decreased cognitive performance in MS, irrespective of atrophy.
Materials and Methods
Participants
This study was approved by the local research ethics board, and all participants provided written informed consent. Forty patients diagnosed with MS were recruited from the Northern Alberta Multiple Sclerosis Clinic in Edmonton, Alberta, Canada. Sixteen patients had relapsing-remitting MS, 15 patients had secondary-progressive MS, and 9 patients were diagnosed with primary-progressive MS. Patients were at least 18 years of age and were diagnosed with MS on the basis of the 2010 McDonald criteria.16 Twenty-seven healthy controls were recruited through word of mouth, on-line (Kijiji; http://www.kijiji.ca/h-alberta/9003), and print advertising (local daily newspaper). All participants were alert, lucid, able to communicate verbally, and understood the test instructions and purpose of the testing; they had normal or corrected-to-normal vision and hearing and were fluent in English. Exclusion criteria were major neurologic or psychiatric illnesses apart from MS in the patient group (eg, stroke, encephalitis, or meningitis; head injury with loss of consciousness of >5 minutes; psychosis), diabetes, learning disabilities, and contraindications to MR imaging (pacemakers, nonremovable metal clips, major dental work, and so forth). Six participants were excluded due to MR imaging artifacts (2 patients), incomplete MR imaging data (1 control), or incomplete cognitive data (2 controls, 1 patient). The gap between MR imaging and cognitive testing was 24.48 ± 22.25 days for patients and 10.44 ± 20.01 days for controls. No patients were imaged during a time of relapse. The earliest time from relapse to imaging was 5.57 months (6.17 months to cognitive testing).
MR Imaging
Participants were imaged by using a 4.7T Varian Inova MR imaging system (Agilent Technologies, Santa Clara, California). Two MR imaging sequences were collected to enable quantitative measurements of volume, R2*, and QSM. A 3D longitudinal relaxation time (T1)-weighted sequence used inversion recovery rapid gradient-echo (84 sections; 2-mm thick; in-plane, 0.9 × 0.9 mm2; acquisition time, 4.8 minutes). The R2*/QSM sequence used 3D multiecho gradient-echo (80 sections; 2-mm thick; in-plane, 1× 1 mm2; acquisition time, 9.4 minutes), with TE parameters (10 echoes; first echo, 2.9 ms; echo spacing, 4.1 ms). Both R2* and QSM were reconstructed from the same multiecho images by using previously validated methods.17,18 Briefly, R2* used a 3D linear field gradient correction to compensate for air-tissue susceptibility effects and then a monoexponential fit.17 For QSM, a field map was estimated from the multiecho data, followed by background field removal by using Regularization-Enabled Sophisticated Harmonic Artifact Reduction for Phase data (RESHARP),18 and dipole inversion by using total variation regularization.19⇓–21 The imaging protocol also included axial T2-weighted and FLAIR imaging, both with 4-mm section thickness, which were used to estimate lesion burden.
Neuropsychological Assessment
The Brief Repeatable Battery of Neuropsychological Tests was conducted on all participants.22 The battery includes verbal and visual memory tests: the Selective Reminding Task (SRT), the 10/36-Spatial Recall Test (SPART), information-processing speed/working memory tests (Symbol Digit Modalities Test [SDMT], and the Paced Auditory Serial Addition Test [PASAT], 2- and 3-second versions), and a phonemic fluency test (word list generation). Administration time was approximately 25 minutes. For 3 patients with limited hand or arm movement, the test administrator placed the checkers in the nontimed SPART, as directed by the patient. The PASAT was attempted but not completed in all participants due to noncompliance or fatigue.
Image Analysis
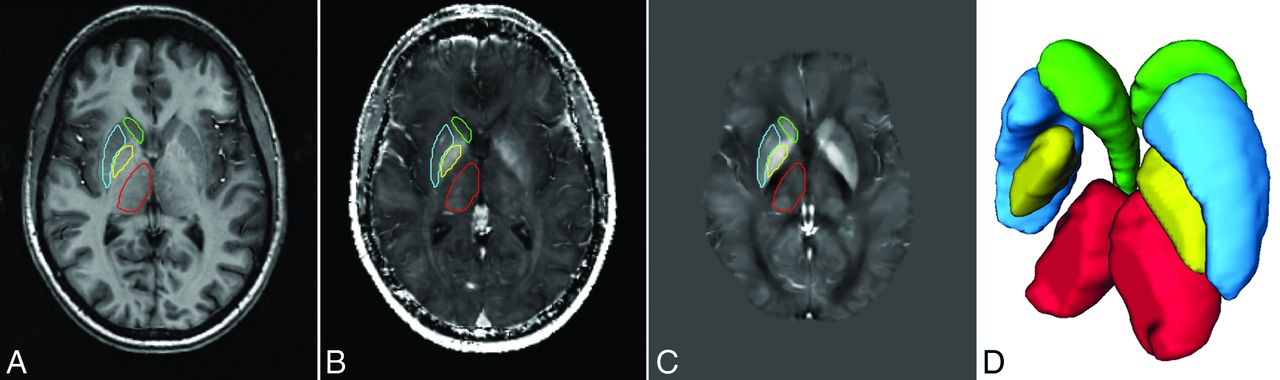
R2* and QSM data from each participant were rigidly aligned with the T1-weighted images and interpolated to the same resolution. Bias field-intensity normalization for T1 images was performed by using the N4 method23 as part of the Advanced Normalization Tools package (stnava.github.io/ANTs/). We segmented 4 DGM nuclei (caudate, putamen, GP, and thalamus) with a multiatlas segmentation method by means of both T1 and QSM images,24 taking advantage of the high DGM contrast available on QSM (Fig. 1), which is particularly beneficial to reliably segment the GP. Ten manually segmented volumes from healthy controls (2 controls from the current study, 8 from another ongoing study) were used as atlases. Following a standard multiatlas segmentation method,25 the atlases from the 10 healthy controls were propagated to each individual dataset by using automatic nonlinear registration on multimodal T1, R2*, and QSM data.26 Each of the registered anatomic labels propagated from the 10 atlases was fused by using a probabilistic label-fusion method proposed by Wang et al27 to produce optimal segmentation of each dataset. Using these anatomic segmentation labels, we then extracted volumes, R2*, and QSM measurements bilaterally on each of the 4 structures in all participants. DGM volumes were normalized to intracranial volume. This method has previously been validated showing high reliability at retest and superior agreement with manual segmentation compared with conventional segmentation methods.24 Although the size of a particular DGM region can influence segmentation results, such effects can be considered marginal (eg, concordance between T1/QSM multiatlas method and manual tracing24: caudate, 82%; putamen, 87%; globus pallidus, 83%; thalamus, 87%).

Sample axial images of the 3 MR imaging methods: T1-weighted image (A), R2* map (B), QSM map (C). D, Oblique view of 3D volume segmentation of the 4 deep gray matter nuclei. The ROIs within each section are shown for one side of the brain, with matching color to the 3D segmentation (caudate = green; putamen = blue; globus pallidus = yellow; thalamus = red).
Total lesion volume was measured by manually tracing the outline of each lesion on T2-weighted images and multiplying by the section thickness. Lesions were defined as hyperintensities on T2-weighting, with confirmation from FLAIR. Lesion measures were made by the senior author, an imaging expert with 25 years of experience.
Statistical Analyses
We first compared patients with controls in cognitive scores and DGM parameters (volume, iron) by using ANCOVAs, controlling for age, sex, and/or education as applicable. Next, to predict cognition by the DGM parameters, we conducted nested sets of linear regression models (hierarchic regressions), successively adding predictors in blocks (see also Pinter et al10). Models were run separately for each of the 4 DGM structures and separately in the controls and patients. For these regressions, cognitive scores were first z-transformed on the basis of the control group and then combined into a composite neuropsychological z score (NPtotal) comprising 6 test scores: 2 SRT measures (continuous long-term retrieval, delayed recall), 2 SPART measures (immediate and delayed recall), SDMT, and word list generation. The PASAT was excluded from NPtotal due to excessive missing data (Table). For each of the 8 models per group, the first block of predictors included age, sex, and education. The second block added DGM volumes (age- and sex-corrected). The third block added either R2* or QSM measures (age- and sex-corrected).
Participant demographics and cognitive performancea
Results
Participant Characteristics
The Table shows that patients and healthy controls were statistically matched in age and sex distribution, but healthy controls were more educated. Our patient cohort comprised 60% patients with progressive MS with a median Expanded Disability Status Scale28 score of 5.25 and disease duration of 14.9 ± 8.9 years. Eighteen patients (all patients with relapsing-remitting MS and 2 with progressive MS) were taking disease-modifying medications. Additional clinical details are outlined in the Table. After we controlled for the education differences, ANCOVAs on the Brief Repeatable Battery of Neuropsychological Tests subtests showed verbal memory (SRT) and processing speed reductions (SDMT) in patients compared with controls.
Medications for symptom management were prescribed to 22 patients (55%). These included antidepressants (n = 15), sleep medications (n = 3), pain medications (n = 12), and muscle relaxants (n = 6). Cognitive functions were unaffected by the presence/absence of symptom management medications, apart from patients taking such medications showing better SRT-delayed recall (t = 2.22, P = .04).
Group Differences in DGM
Bilateral DGM volumes were correlated with age and sex in some regions; thus, age-, and sex-adjusted volumes were used. We observed volumetric reductions in patients with MS in the putamen (P < .001), GP (P = .002), and thalamus (P < .001) (Fig 2A). For QSM, patients showed higher values than controls in the putamen (P = .003) and GP (P = .003), with a trend in the caudate (P = 0.06) (Fig 2B). R2* increases in patients showed trends similar to those in QSM, but they were not significant (Fig 2C).

Group differences in age-, sex-, and intracranial volume-normalized deep gray matter volumes (A) and iron based on QSM (B) and R2* (C). Boxplots show ranges of the first-to-third quartiles, circles indicate means, lines inside the boxes indicate medians, dotted lines indicate the fence (1.5 interquartile ranges), and outliers are shown by dots outside the fence. Cau = caudate; Put = putamen; GP = globus pallidus; Tha = thalamus; double asterisks = P < .001; asterisk = P < .01.
With partial correlations correcting for age and sex, measures of R2* and QSM were highly correlated with each other within each region in patients (caudate: r = 0.66; putamen: r = 0.86; GP: r = 0.75; thalamus: r = 0.60; all, P < .001). Except for the thalamus, these correlations were similar, albeit weaker, in the control group (caudate: r = 0.46, P = .02; putamen: r = 0.59, P = .002; GP: r = 0.78, P < .001; thalamus: r = 0.03, P = .89). Notably, R2* and QSM values were uncorrelated with structural volumes within each of the 4 DGM nuclei, both in patients and controls, permitting their use in the hierarchic regressions.
Cognition, DGM Volumes, and Iron Susceptibility
Regressions examined predictors of cognitive performance within each of the DGM regions separately for patients and controls. The first block of predictors included only demographic variables: age, sex, and education years. In the second block, DGM volumes were added. In the third block, QSM or R2* values were included.
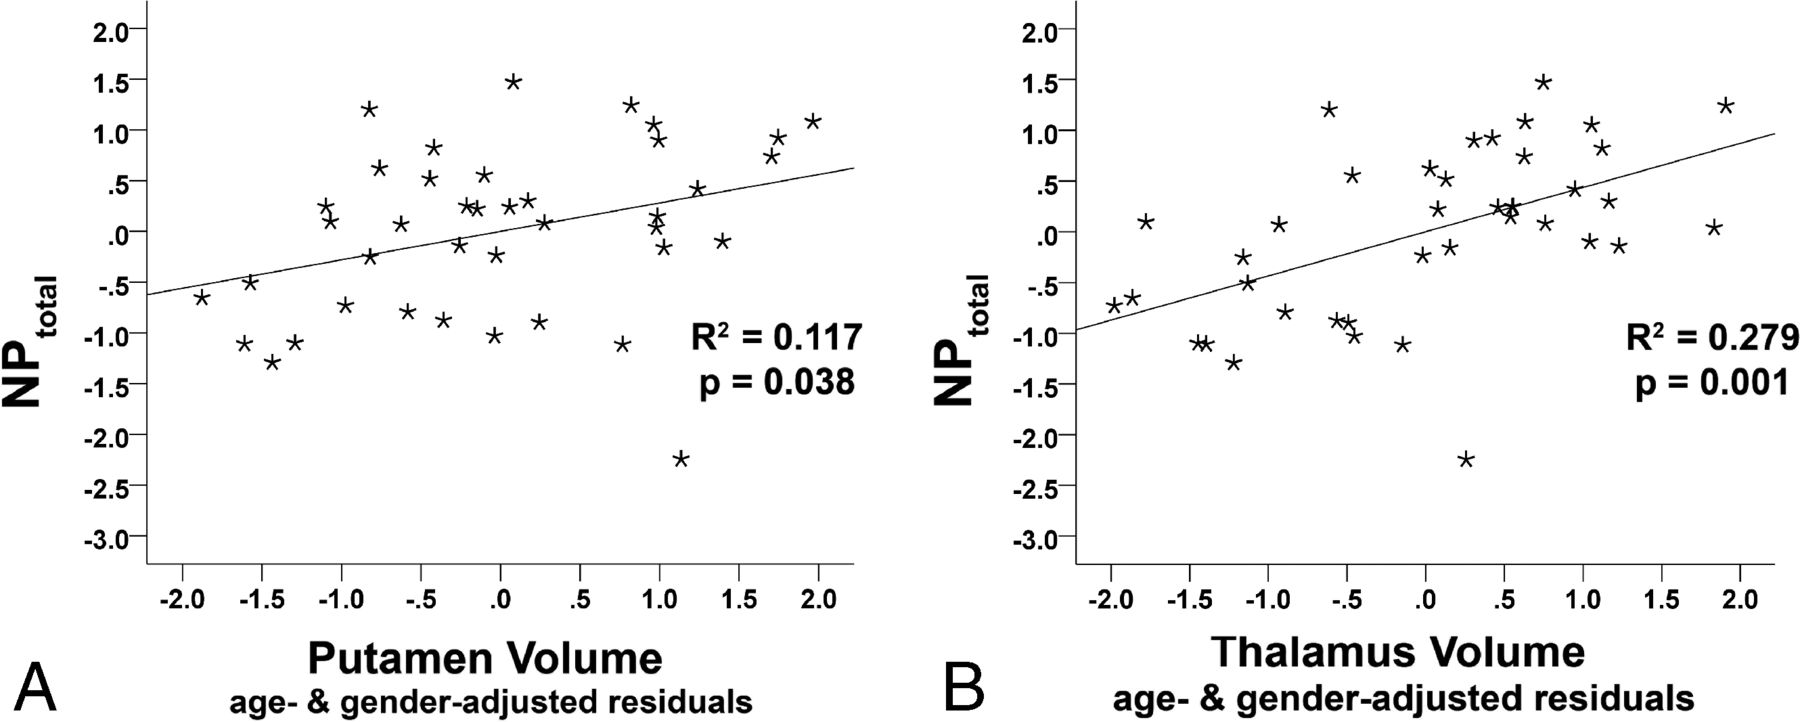
Within the patient group, compared to a model with demographic variables alone (R2 = 0.15, P = .12), putamen volumes significantly increased prediction of NPtotal (R2 = 0.25, ΔR2 = 0.1, model F = 2.89, P = .046; putamen β = 0.32, t = 2.15, P = .04; Fig 3A). These results were similar but more pronounced with thalamic volumes (R2 = 0.39, ΔR2 = 0.24, model F = 5.50, P = .002; thalamus β = 0.49, t = 3.68, P < .001; Fig 3B). Volumetric data did not contribute significantly to relationships with NPtotal in the healthy controls (On-line Table 1).

Prediction of cognition (NPtotal) by age, sex, and intracranial volume-normalized putamen (A) and thalamus (B) volumes in patients with MS after correcting for age, sex, and education.
In a third block, QSM values were then included. In patients, after controlling for demographic influences and GP volumes, NPtotal was related to GP QSM (R2 = 0.29, ΔR2 = 0.1, model F = 2.76, P = .03; GP QSM β = −0.32, t = 2.22, P = .03; Fig 4B). Thus, GP QSM explained an additional 10% of variance (ΔR2) in cognitive performance, after controlling for demographic variables and for GP volume. None of the other QSM measures were substantially related to NPtotal in patients or in controls (see On-line Tables 1 and 2 for details). Analyses with R2* showed a similar but nonsignificant result for the GP only (R2 = 0.25, ΔR2 = 0.06, model F = 2.26, P = .071; GP β = −0.25, t = −1.70, P = .099; Fig 4A). No other R2* measure was significantly or at trend-level related to NPtotal in patients. Controls did not show any significant relationships between iron measures and cognition, including in the GP iron models (QSM-GP: GP β = −0.077, t = −0.44, P = .663; R2*-GP: GP β = −0.15, t = −0.86, P = .399).

Prediction of cognition (NPtotal) by age- and sex-corrected QSM (A) and R2* (B) values in the globus pallidus in patients with MS after correcting for age, sex, education, and individual DGM volumes.
When we inspected the NPtotal, 2 tests were individually sensitive to DGM changes. Thalamic volume correlated with SPART-delayed recall (SPART: β = 0.45, P = .003) and with SDMT (β = 0.45, P = .003). QSM in the GP was negatively related to phonemic fluency (β = −0.40, P = .01). Bonferroni correction by 6, the number of individual cognitive tests in the NPtotal (P = .05/6 = 0.008), only retained the thalamic volume correlations with SDMT and SPART. Disability (Expanded Disability Status Scale) and disease duration were unrelated to any of the MR imaging measures in this cohort, and only trend-level correlated with NPtotal (r = −0.37, P = .07), possibly due to limited sensitivity of the Expanded Disability Status Scale in higher ranges (focusing on motor symptoms but not cognitive symptoms) and the long duration and variability in disease durations in the current cohort.
Discussion
We examined cognitive correlates of DGM atrophy and iron accumulation in a mixed cohort of patients with progressive MS and relapsing-remitting MS. Irrespective of atrophy, cognition was negatively related to iron accumulation in the GP assessed with QSM, with a similar trend in the R2* measure. In turn, volumes of the thalamus and putamen were related to cognition, replicating previous findings.2 These correlations were also irrespective of iron accumulation in those regions. Within each investigated DGM structure, volumetric and iron measures were unrelated, suggesting that atrophic and iron-related pathologies in the DGM may exert separable influences on cognitive functions in MS.
Our findings extend the limited literature on relationships between DGM iron and cognition in MS. Only 2 previous studies concurrently accounted for regional8 or global atrophy10 and reported, similarly, moderate relationships between DGM iron and cognition. Modica et al8 used susceptibility-weighted imaging to assess DGM iron. Excessive iron was indicated by the mean phase across voxels with a 2 SD+ below the normal mean phase. In the caudate, putamen, GP, and pulvinar thalamus, this iron measure predicted processing speed. However, after they adjusted for regional volumes, iron-cognition links were no longer significant. Thus, unlike in the current study using QSM and R2*, Modica et al8 found no relationship between their iron measure and cognition when regional atrophy was controlled. Pinter et al10 reported correlations between a processing speed (“cognitive efficiency”) composite score (SDMT, PASAT) and a combined basal ganglia R2* measure, while controlling for global brain measures (normalized brain volume, lesion load, magnetization transfer ratio for normal-appearing brain tissue). Methodologic differences between the behavioral and iron measures and the normalization procedures likely caused differences among studies, but generally, these findings emphasize the importance of examining cognitive correlates of DGM iron pathology in MS vis-à-vis atrophy, as was done here.
Because iron imaging in MS is relatively new and rapidly evolving, another important aspect here was the assessment of different iron MR imaging parameters, combined with cognition. Schmalbrock et al11 also tested both QSM and R2*, reporting a relationship between Flanker Task performance and caudate/anterior putamen iron assessed with QSM, but not R2*, in patients with relapsing-remitting MS. The Brief Repeatable Battery of Neuropsychological Tests was applied but not included, and the cognitive effects of iron accumulation were not further examined against other DGM pathologies such as atrophy. Nevertheless, the findings are comparable with ours insofar as the QSM measure was a better predictor of cognition (ie, inhibition in a Flanker Task in Schmalbrock et al) than R2*. While R2* and QSM are complementary measures, they have distinct differences. First, the iron sensitivity of R2* is highly field-dependent, with higher fields being advantageous,29 while QSM is largely field-insensitive.30 Second, R2* is more susceptible to water content with inflammation weakening the R2* signal but having little effect on QSM. Third, demyelination has opposing effects, with the QSM signal increasing from demyelination and R2* decreasing.31 Thus, QSM increases by demyelinating effects adding to iron accumulation, while these 2 events oppose each other for R2*. Thus, our findings that QSM shows a tighter coupling to cognition than R2* may relate to both the dominant iron accumulation in DGM and the additive effects of DGM demyelination on QSM.
We observed a specific role of GP iron accumulation in global cognitive functions, irrespective of GP atrophy, implying that iron accumulation in the GP may have a unique role in globally affecting cognitive processes in this MS cohort. In an early study, Brass et al9 had approximated iron accumulation by examining T2 hypointensities (at 1.5T). The authors also reported hypointensities in the GP—but no other DGM region—to be the only significant predictor of a composite cognitive score. Similar to our findings, tests that were individually related to GP hypointensities included verbal fluency and the SDMT, but not memory. The GP has the highest iron concentration in the human brain, exceeding that in all other DGM nuclei,12,32 and it is a target region of several neurodegenerative diseases with primary brain iron accumulation etiologies.33 Functionally, the GP is the major input region to the thalamus within all the frontostriatal-thalamic loops, including lateral prefrontal and motor/supplemental motor cortex targets and serving a range of cognitive, emotional, motor, and oculomotor functions.34 A finer segregation within the GP would be valuable to delineate further whether specific psychomotor functions in MS are particularly vulnerable to iron accumulation and/or regional atrophy. As it stands, our findings only speak to a relationship between GP iron and global cognitive functions in MS. Thus, future studies should extend DGM imaging and add basal ganglia–specific tasks that also probe motor functions, considering the putamen-GP iron pathology observed here.
Among the study limitations, sample size for both patients and controls was relatively small so that finer grained analyses of DGM-cognition links within MS subtypes could not be performed reliably. Combining relapsing (n = 16) and progressive MS subtypes (n = 24) in the current study may have biased the results toward patients with progressive MS. Qualitatively, the relapsing-remitting MS subgroup took an intermediate place between patients with progressive MS and controls in all of the neuropsychological measures and in most of the DGM measures. However, larger scale studies with equally sized groups of MS subtypes should be performed. These may uncover differential relationships to cognition with more dominant inflammatory (relapsing MS) or atrophic/demyelinating (progressive MS) features. Our study also did not account for lesion burden, which has shown a relationship with cognitive decline and R2* in some,7 but not other35 studies. None of the lesions were visible in the DGM ROIs in the current study, by using manual tracing on T2/FLAIR images. Because the focus of the current study was to disambiguate the cognitive significance of iron pathology vis-à-vis atrophy specifically in the DGM and the MR parameters were not optimized for identification of DGM lesions, potential additive or separable effects of such lesions on cognition remain to be clarified in the future.
In addition, many patients were prescribed medications for symptom management. Although we did not observe an interaction between these medications and cognitive performance here, a formal assessment of mental health and other central nervous factors would have been preferable. Finally, the healthy controls had a higher educational level than the patient group. Besides controlling for education levels in each analysis, other aspects of the data speak against a strong influence of education on the final results. For example, On-line Tables 1 and 2 show that education never emerged as a significant predictor in any of the regression models in either group. Simple correlations (not presented) between the raw neuropsychological test measures included in NPtotal and years of education were all nonsignificant. Taken together, although there was an imbalance in educational levels between patients and controls, this is unlikely to have influenced our results.
Conclusions
Increased iron in the GP, measured by QSM, was moderately associated with a lower cognitive composite score in this MS cohort. This effect was unrelated to atrophy of the GP. Whereas thalamic atrophy was the strongest predictor of cognitive performance in patients with MS, this outcome, in turn, was not further modulated by thalamic QSM/R2* iron measures. Our findings suggest separable and negative relationships among cognition, DGM iron, and DGM atrophy in MS.
Acknowledgments
We would like to thank Leah White for her help with patient recruitment and chart review.
Footnotes
Disclosures: Jonn A. Kmech—RELATED: Grant: MS Society of Canada (EGID 1619), Canadian Institutes of Health Research (FRN MOP 102582), Comments: salary as a research assistant*. Esther Fujiwara—RELATED: Grant: Canadian Institutes of Health Research, MS Society, Comments: operating grants to senior author Alan H. Wilman, MS Society of Canada (EGID 1619) and the Canadian Institutes of Health Research (FRN MOP 102582)*; UNRELATED: Grants/Grants Pending: MS Society, Alberta Gambling Research Institute, Canadian Institutes of Health Research, Social Sciences and Humanities Research Council of Canada, Comments: received an operating grant from the Social Sciences and Humanities Research Council of Canada (2010–2013) as Principal Investigator; received an operating grant from the Canadian Institutes of Health Research (2013–2017) as a team grant member*. Dana Cobzas—RELATED: Grant: MS Society of Canada (EGID 1619), Canadian Institutes of Health Research (FRN MOP 102582)*. Hongfu Sun—RELATED: Grant: MS Society of Canada (EGID 1619), Canadian Institutes of Health Research (FRN MOP 102582)*. Peter Seres—RELATED: Grant: MS Society of Canada and Canadian Institutes of Health Research, Comments: grant received with money paid to the institution: MS Society of Canada (EGID 1619), Canadian Institutes of Health Research (FRN MOP 102582).* Gregg Blevins—RELATED: Grant: MS Society of Canada and Canadian Institutes of Health Research*; UNRELATED: Consultancy: Biogen, Teva Pharmaceuticals, Merck Serono, Novartis, Roche, Genentech. Alan H. Wilman—RELATED: Grant: Multiple Sclerosis Society of Canada MS Society of Canada (EGID 1619), Canadian Institutes of Health Research (FRN MOP 102582).
This work was supported by the MS Society of Canada (EGID 1619) and the Canadian Institutes of Health Research (FRN MOP 102582).
Indicates open access to non-subscribers at www.ajnr.org
REFERENCES
- Received September 9, 2016.
- Accepted after revision December 18, 2016.
- © 2017 by American Journal of Neuroradiology


