
Abstract
BACKGROUND AND PURPOSE: Imaging-based tumor grading is highly desirable but faces challenges in sensitivity, specificity, and diagnostic accuracy. A recently proposed diffusion imaging method by using a fractional order calculus model offers a set of new parameters to probe not only the diffusion process itself but also intravoxel tissue structures, providing new opportunities for noninvasive tumor grading. This study aimed to demonstrate the feasibility of using the fractional order calculus model to differentiate low- from high-grade gliomas in adult patients and illustrate its improved performance over a conventional diffusion imaging method using ADC (or D).
MATERIALS AND METHODS: Fifty-four adult patients (18–70 years of age) with histology-proved gliomas were enrolled and divided into low-grade (n = 24) and high-grade (n = 30) groups. Multi-b-value diffusion MR imaging was performed with 17 b-values (0–4000 s/mm2) and was analyzed by using a fractional order calculus model. Mean values and SDs of 3 fractional order calculus parameters (D, β, and μ) were calculated from the normal contralateral thalamus (as a control) and the tumors, respectively. On the basis of these values, the low- and high-grade glioma groups were compared by using a Mann-Whitney U test. Receiver operating characteristic analysis was performed to assess the performance of individual parameters and the combination of multiple parameters for low- versus high-grade differentiation.
RESULTS: Each of the 3 fractional order calculus parameters exhibited a statistically higher value (P ≤ .011) in the low-grade than in the high-grade gliomas, whereas there was no difference in the normal contralateral thalamus (P ≥ .706). The receiver operating characteristic analysis showed that β (area under the curve = 0.853) produced a higher area under the curve than D (0.781) or μ (0.703) and offered a sensitivity of 87.5%, specificity of 76.7%, and diagnostic accuracy of 82.1%.
CONCLUSIONS: The study demonstrated the feasibility of using a non-Gaussian fractional order calculus diffusion model to differentiate low- and high-grade gliomas. While all 3 fractional order calculus parameters showed statistically significant differences between the 2 groups, β exhibited a better performance than the other 2 parameters, including ADC (or D).
ABBREVIATIONS:
- AUC
- area under the curve
- FROC
- fractional order calculus
- ROC
- receiver operating characteristic
- WHO
- World Health Organization
Gliomas are the most common primary brain tumors seen in adults, accounting for approximately one-third to one-half of all cases diagnosed1 and 82% of malignant brain tumors.2 According to the latest classification by the World Health Organization (WHO), gliomas can be divided into 4 grades, spanning a broad spectrum of biologic aggressiveness.3 Accurate grading of gliomas is essential to patient management, not only for selecting the most effective therapy for malignant tumors but also for avoiding unnecessary aggressive treatment for low-grade tumors before malignant transformation, maximizing the quality of life for patients.
MR imaging has been widely used for the initial diagnosis of brain tumors. Its role for tumor grading, however, is less established.4 Conventional MR imaging techniques, including precontrast T1-weighted, T2-weighted, T2-weighted FLAIR, and postcontrast T1-weighted imaging, have limited sensitivity (eg, 72.5%) and specificity (eg, 65.0%) for differentiating low- and high-grade gliomas.4,5 Perfusion imaging (eg, CBV) can improve the sensitivity to >90%,6 but the specificity (eg, 57.5%) remains inadequate and is subject to the choice of CBV threshold values, depending on tumor types.7⇓–9 With the ability to reveal tumor metabolic changes, MR spectroscopy has also been used for tumor grading.6,10,11 The long data-acquisition times, poor spatial resolution, and magnetic susceptibility perturbations at specific locations (eg, near the sinus and the skull) have hindered its widespread clinical application.6,10,11 Because of the aforementioned challenges and limitations faced by MR imaging/MR spectroscopy, tissue biopsy remains the criterion standard for tumor classification and grading, despite its sampling errors, invasiveness, and inability to evaluate residual tumor tissue after cytoreductive surgery.5
During the past 2 decades, diffusion imaging based on ADC has been evaluated for tumor grading.12⇓–14 Despite the potential, several studies indicate that ADC values overlap considerably among different tumor grades in both adult15⇓–17 and pediatric patients.14,18⇓–20 The ADC values of tumor tissues are obtained by characterizing the diffusion MR imaging signals with a monoexponential function, also known as a Gaussian diffusion model, which assumes that the diffusion process within a voxel is homogeneous.21 Unlike low-grade gliomas, high-grade gliomas have an increased degree of tissue heterogeneity,22,23 which is not adequately captured by ADC. To overcome this limitation, a number of non-Gaussian diffusion models24⇓⇓⇓⇓⇓⇓⇓–32 have been developed to extract tissue microstructural information, including tissue heterogeneity, beyond what ADC can provide. The fractional order calculus (FROC) model,26,29 for example, can produce a set of parameters, including diffusion coefficient D (in square millimeters/second), fractional order derivative in space β, and a spatial parameter μ (in micrometers). These parameters provide additional avenues to probing not only the diffusion process itself (D) but also the intravoxel tissue heterogeneity (β) that can be used to improve tumor characterization.26,29,33 In this study, we demonstrate the feasibility of using a new set of parameters from the FROC model to improve MR imaging–based differentiation of low- and high-grade gliomas in adult patients.
Materials and Methods
Patients
The institutional review board of the performing hospital (Tongji Hospital, Wuhan, China) approved this prospective study, and written informed consent was obtained from all participating patients. Fifty-six adult patients (18–70 years of age) with an initial diagnosis of gliomas were recruited and underwent multi-b-value diffusion MR imaging before biopsy or surgical treatment. Two patients were excluded from the analysis due to excessive motion. Among the 54 patients included in the study, histopathology revealed 24 low-grade gliomas, including 1 pilocytic astrocytoma (WHO I), 2 oligodendrogliomas (WHO I and II), 20 astrocytomas (WHO II, predominantly diffuse tumors), 1 ganglioglioma (WHO II), and 30 high-grade gliomas, including 2 anaplastic oligodendrogliomas (WHO III), 10 anaplastic astrocytomas (WHO III), and 18 glioblastoma multiformes (WHO IV), according to the WHO guideline of 2007.3
Image Acquisition
All MR imaging examinations were performed on a 3T scanner (MR750; GE Healthcare, Milwaukee, Wisconsin) with a 32-channel phased-array head coil. The imaging protocol included precontrast T1-weighted FLAIR, T2-weighted FLAIR, T2-weighted PROPELLER, and multi-b-value diffusion-weighted sequences, followed by postcontrast T1-weighted imaging. Susceptibility-weighted imaging was performed on selected patients when the conventional sequences were inadequate to characterize hemorrhage within tumors. In all sequences, an FOV of 24 cm and a section thickness of 5 mm were used. The parameters specific to each anatomic imaging sequence were the following: T1-weighted FLAIR: TR/TE = 1750/32.4 ms, TI = 860 ms, flip angle = 90°, and matrix size = 320 × 320; T2-weighted PROPELLER: TR/TE = 4260/102 ms, echo-train length = 32, and matrix size = 320 × 224; T2-weighted FLAIR: TR/TE = 8400/150 ms, TI = 2100 ms, echo-train length = 26, and matrix size = 256 × 256. The DWIs were produced by using a single-shot echo-planar imaging sequence with 17 b-values (01, 201, 501, 1001, 2001, 4001, 6001, 8001, 10001, 12001, 16001, 20002, 24002, 28002, 32004, 36004 and 40004 s/mm2, in which the subscript denotes the number of averages). At each b-value, a Stejskal-Tanner diffusion gradient was successively applied along the x-, y-, and z-axes to obtain a trace-weighted image to minimize the influence of diffusion anisotropy. The key data acquisition parameters were TR/TE = 3025/94.5 ms, sensitivity encoding acceleration factor = 2, separation between 2 diffusion gradient lobes Δ = 38.6 ms, duration of each diffusion gradient δ = 32.2 ms, matrix size = 160 × 160 (reconstructed with a 256 × 256 matrix), and scan time = 4 minutes 30 seconds.
Image Analysis
Equation 1 was used to fit the intensity (S) of the multi-b-value diffusion images voxel-by-voxel, according to the FROC diffusion model26,29:
 where S0 is the signal intensity without diffusion weighting, Gd is the diffusion gradient amplitude, and δ and Δ are defined earlier. The β parameter (dimensionless; 0 < β ≤ 1) is a fractional order derivative with respect to space, and μ (in units of micrometers) is a spatial constant to preserve the nominal units of the diffusion coefficient D (in square millimeters/second). In the fitting, D (which reflects the intrinsic diffusivity) was estimated by a monoexponential model by using the data acquired at lower b-values (≤1000 s/mm2), in an attempt to make D equivalent to conventional ADC. After D was determined, β and μ were subsequently obtained from a voxelwise nonlinear fitting by using a Levenberg-Marquardt algorithm34 with all b-values.
ROIs were first placed on the normal contralateral thalamus, which served as an internal control, followed by placing ROIs on the solid region of tumors by 2 neuroradiologists (Y.X. and K.L.X. with 8 and 15 years of clinical experience, respectively) blinded to the histology grades. Guided by the high-resolution anatomic images, regions of hemorrhage, cystic change, and/or necrosis were excluded. In the solid region of tumors, the enhancing components and the nonenhancing (or not-so-obvious enhancing) components were measured and averaged. The ROI-based image analysis was performed with customized software developed in Matlab (MathWorks, Natick, Massachusetts).
Statistical Analysis
The mean and SD of D, β, and μ for each patient were calculated from the normal contralateral thalamus and the tumor ROIs, respectively. On the basis of these values, the low-grade and high-grade glioma groups were compared by using a Mann-Whitney U test with a statistical significance set at P < .05.
To investigate the potential value of using combinations of the FROC parameters (D, β, and μ) for differentiation of low- and high-grade gliomas, we employed a logistic regression model:
 where a0 is a constant, and a1, a2, and a3 are the regression coefficients for D, β, and μ, respectively. The regression coefficients were estimated by using a maximum-likelihood method.35 Receiver operating characteristic (ROC) analysis was performed to determine the area under the ROC curve (AUC) for assessing the performance of tumor differentiation by using each of the 3 FROC parameters individually and the combination of FROC parameters represented by P0. The best cutoff values in the ROC analysis were determined by using the Youden index. To determine the generalizability of the proposed method, we used a holdout cross-validation algorithm by applying the logistic regression model, Equation 2, on a “training dataset” and a “test dataset” (randomly and equally split from the samples). The Pearson correlation coefficients were then determined between the predicted values and the “true” histopathologic results. All statistical analyses were performed by using SPSS software (IBM, Armonk, New York).
Results
Comparison among Representative Patients in Each Group
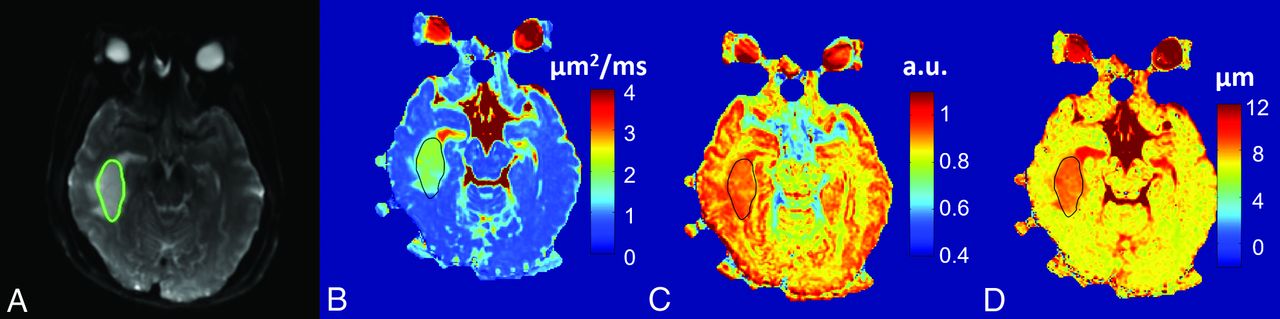
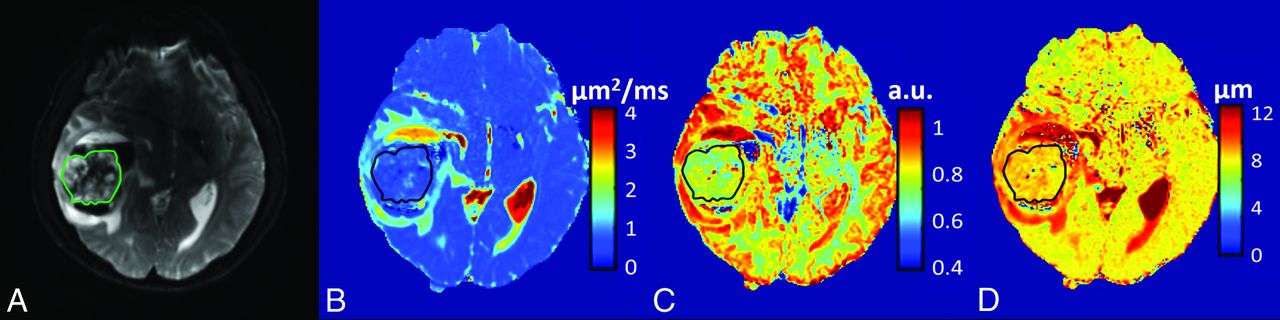
Figure 1 shows a set of axial images from a representative patient (oligodendroglioma, WHO I) in the low-grade glioma group, including T2-weighted EPI (Fig 1A), and the FROC maps (color images in Fig 1B–D). The precontrast and postcontrast T1-weighted FLAIR, precontrast T2-weighted FLAIR, and T2-weighted PROPELLER images are available in On-line Fig 1. The D, β, and μ maps (Fig 1B–D, respectively) all exhibited higher values in the tumor than in the surrounding brain parenchyma. Figure 2 shows a set of axial images from a representative patient (glioblastoma multiforme, WHO IV) in the high-grade glioma group by using a layout similar to that of Fig 1. The FROC parameters D, β, and μ (Fig 2B–D, respectively) were considerably lower compared with those in Fig 1B–D, leading to a distinct difference between the high- and low-grade tumors. Additional anatomic images are available (On-line Fig 2).

A 41-year-old female patient with a low-grade glioma (oligodendroglioma, WHO grade I). T2-weighted EPI at b=0 with the tumor ROI encircled in green (A), and FROC parameter maps of D (B), β (C), and μ (D) with the tumor ROIs indicated by the black contours (see On-line Fig 1 for a complete set of images, including axial precontrast T1-weighted FLAIR, postcontrast T1-weighted FLAIR, precontrast T2-weighted FLAIR, and precontrast T2WI PROPELLER images). Compared with the patient with glioblastoma multiforme in Fig 2, all 3 FROC parameters exhibited higher values. a.u. indicates arbitrary units. The color scale in (B) is expressed in square micrometers/millisecond.

A 38-year-old male patient with a high-grade glioma (glioblastoma multiforme, WHO grade IV). T2-weighted EPI at b=0 with the tumor ROI encircled in green (A) and FROC parameter maps of D (B), β (C), and μ (D) with the tumor ROIs indicated by the black contours (see On-line Fig 2 for a complete set of images including axial precontrast T1-weighted FLAIR, postcontrast T1-weighted FLAIR, T2-weighted FLAIR, and T2-weighted PROPELLER images). Compared with the patient with an oligodendroglioma in Fig 1, all 3 FROC parameters exhibited lower values. a.u. indicates arbitrary units. The color scale in (B) is expressed in square micrometers/millisecond.
Group Comparison Based on the FROC Parameters
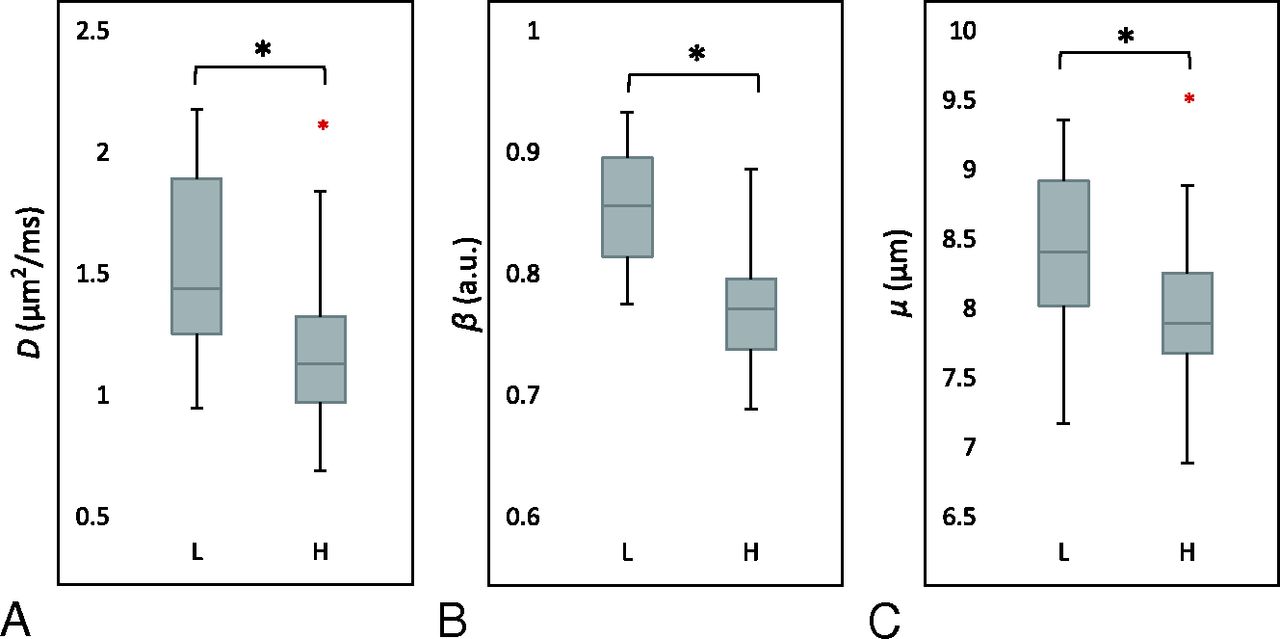
After calculating the mean values of the FROC parameters from each tumor ROI, we obtained the means and SDs from each patient group; they are listed in Table 1. Because D is the mathematic equivalent to the conventional ADC (see “Materials and Methods”), an agreement of >96% was observed between D from the FROC model and ADC from a monoexponential fitting by using 2 b-values (b = 0 and 1000 s/mm2), as is typical in clinical studies. Thus, ADC and D are used interchangeably in this study. Comparison of the FROC parameters between the 2 tumor groups is shown in a set of boxplots (Fig 3). Consistent with the representative cases in Figs 1 and 2, the group analysis exhibited statistically higher values (P ≤ .011) in the low-grade than the high-grade gliomas for each of the 3 FROC parameters. In comparison, the internal control by using a normal contralateral thalamus showed no significant differences (P ≥ .706) in the FROC parameters between the 2 patient groups, as summarized in Table 1.
FROC parameters of gliomas and normal contralateral thalamus of patients with low-grade and high-grade gliomas

Boxplots of FROC parameters D (A), β (B), and μ (C) between the low- (L) and high-grade (H) gliomas. Boxes represent the 25th and 75th percentiles with the median indicated by the middle line in the box. Vertical end bars denote the range of data except for the outliers (ie, values larger than the 75th percentile or smaller than the 25th percentile) represented by a red asterisk. The black asterisk indicates a significant difference (P < .05) between the low- and high-grade gliomas.
ROC Analysis
Figure 4 illustrates the ROC curves using individual FROC parameters for differentiating low- (positive) from high-grade (negative) gliomas. Because D and μ were strongly correlated (see the results in Fig 5), μ was excluded from the logistic regression to avoid overweighting. The constant and regression coefficients of D and β were 19.936, −0.012, and −24.145, respectively (see Equation 2), and the corresponding P0 was used in ROC analysis to represent the combination of D and β. Table 2 summarizes the cutoff values with the corresponding sensitivity, specificity, accuracy, positive and negative predictive values, and asymptotic significance (P value). Although D offered the highest sensitivity (91.7%), its specificity was the lowest (63.3%), leading to moderate accuracy (77.5%). The sensitivity was noticeably improved by β or the combination of β and D, which resulted in the best accuracy (82.1%). The AUC values of the ROC analyses together with their 95% confidence intervals and standard errors are given in Table 3. The parameter β had a higher AUC (0.853) than D (0.781) or μ (0.703), indicating a better performance for glioma differentiation. The combination of D and β did not improve the sensitivity, specificity, accuracy, or AUC compared with β.

ROC curves for β (in red), D (in green), and μ (in blue) for differentiating low- and high-grade gliomas. The diagonal line serves as a reference.

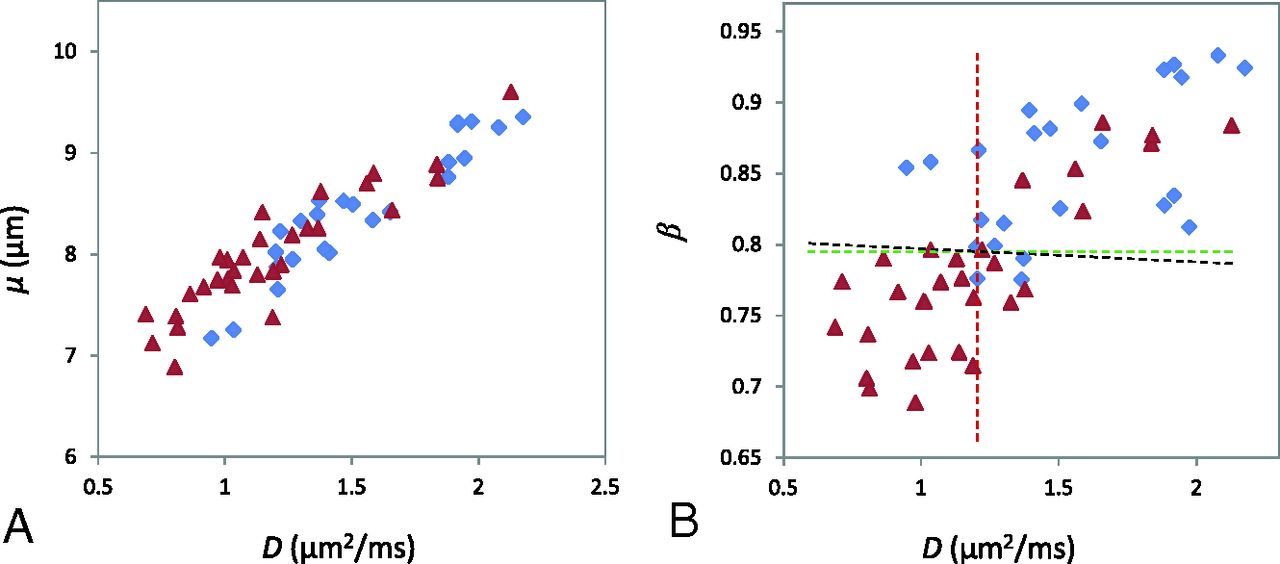
Scatterplots of D versus μ (A) and D versus β (B) from all patients (the blue diamonds represent low-grade and the red triangles denote high-grade gliomas). A very strong correlation between D and μ (A) (Pearson correlation coefficient r = 0.930; P < .001) and a weaker correlation between D and β (B) (Pearson correlation coefficient r = 0.766; P < .001) are illustrated. B, The dashed lines indicate the cutoff values for D (red), β (green), and the combination of D and β (black; linear equation: β = 0.000497D + 0.798).
Cutoff, sensitivity, specificity, diagnostic accuracy, and asymptotic significance (P value) using D, β, μ, and a combination of D and β for differentiating low- (positive) from high-grade (negative) gliomasa
AUC values of the ROC analyses with their 95% confidence intervals and standard errors using D, β, μ, and a combination of D and β for differentiating low- (positive) from high-grade (negative) gliomas
The cross-validation analysis showed that the Pearson correlation coefficients between the predicted values and the “true” histopathologic results were 0.529 (P < .01) for the training set and 0.625 (P < .01) for the test set. The significance test for the difference between the 2 correlations (Fisher Z-test) resulted in a P value of .617, suggesting that the training and test datasets did not produce statistically different correlations.
The scatterplots in Fig 5 illustrate the possible (or lack of) correlation among the FROC parameters using all patient data. A very strong correlation between D and μ was observed (Fig 5A) with a Pearson correlation coefficient of r = 0.930 (P < .001). In contrast, a noticeably weaker correlation was seen between D and β (r = 0.766, P < .001). In Fig 5B, the best cutoff values of D and β are indicated by the vertical (red) and the horizontal (green) lines, respectively. The oblique black line in Fig 5B corresponds to the cutoff probability of P0 = .662 for the combination of D and β. The close proximity between the black and green lines is a reflection of the fact that D has a considerably smaller role than β in the equation P0 = exp(19.936 − 0.012 D − 24.145 β) / [1 + exp(19.936 − 0.012D − 24.145 β)].
Discussion
We have investigated the feasibility of using a set of novel FROC diffusion parameters to differentiate low- from high-grade gliomas in adults and demonstrated that D, β, and μ exhibited significant differences between the 2 tumor groups. When used individually, β outperformed the other 2 parameters. These results are important because they demonstrate that new parameters from the FROC diffusion model can contribute positively to glioma differentiation and extend the capability of diffusion imaging beyond conventional ADC.
During the past 2 decades, ADC has been applied to differentiating a number of brain tumors,14,16,18,36 including gliomas. Although the sensitivity of using ADC to detect neoplastic changes has been demonstrated, considerable overlap in ADC values exists between low- and high-grade brain tumors,14,16,17 compromising the specificity and diagnostic accuracy. The suboptimal performance of ADC for tumor grading originates, at least in part, from the use of a Gaussian diffusion model (ie, the monoexponential model), which assumes a homogeneous diffusion process in the tumor, despite overwhelming evidence of tumor heterogeneity.37⇓–39 In the presence of heterogeneity, non-Gaussian diffusion models can be more effective in characterizing the complex diffusion process, particularly at high b-values (eg, b ≥ 1500 s/mm2).15,21–32,36,40
Like other non-Gaussian diffusion models, the FROC diffusion model provides new parameters complementary to ADC. In the FROC model, correlation between β and intravoxel tissue heterogeneity has been suggested in several studies on phantoms and tissue specimens.26,29,41,42 This correlation is also supported by in vivo studies indicating that tissues with a smaller β-value exhibit a larger degree of intravoxel heterogeneity.22,27,33,43 Tissue heterogeneity is also a contributing factor to the WHO tumor grading system.44 Thus, the β parameter may provide a link between an MR imaging measurement and WHO grades. The lower β values (ie, a high degree of intravoxel heterogeneity) seen in high-grade gliomas (Figs 2 and 3) are consistent with the increased degree of tissue heterogeneity due to the presence of edema, necrosis, hemorrhage, microcalcification, and so forth. This observation is also consistent with a recent study on pediatric brain tumors33,43 in which high-grade tumors showed significantly lower β values compared with their low-grade counterparts. Further studies on well-controlled excised tissues are needed to directly establish and validate the correlation between diffusion heterogeneity suggested by β and structural heterogeneity revealed by histopathology.
Kwee et al27 recently studied high-grade gliomas by using an alternative non-Gaussian diffusion model based on a stretched-exponential formulism.28 Although this model is similar to the FROC model, the stretched-exponential is developed empirically instead of using the fractionalized Fick diffusion equation. The heterogeneity index α in the stretched-exponential model resembles β in this study. The α value for high-grade gliomas was reported to be 0.58 ± 0.08, which is lower than β = 0.77 ± 0.06 in our study. This finding is most likely due to the different diffusion times (Δ) used in these studies.45 Compared with the study of Kwee et al, our study produced a noticeably smaller SD in β because of the relatively large number of b-values used. Although a minimum of 4 b-values is needed to obtain the 3 FROC parameters, a larger number of b-values improves the robustness of the nonlinear fitting, particularly when the SNR is low.
Using all the patient data in this study, we observed a strong linear correlation between D and μ (Fig 5A). Because μ has been related to the dimension of free diffusion space,26 the correlation in Fig 5A reflects the classic relationship between the diffusion rate and mean free length. β was less correlated with D or μ. This weaker correlation can be exploited to improve specificity and diagnostic accuracy because these 2 parameters act more independently. In this study, we have seen evidence suggesting that β is more dominant than D for differentiating low- from high-grade gliomas because the combination of β with D did not improve the performance compared with using β alone. This finding suggests the important role of tumor heterogeneity in various tumor grades.
Our study has several limitations. First, despite the improvement offered by the FROC model in glioma grading, the sensitivity, specificity, and diagnostic accuracy remain suboptimal. An extension of the FROC model to quantifying temporal heterogeneity, as demonstrated recently,42,43 suggests new opportunities to further improve the performance. These non-Gaussian diffusion imaging techniques may eventually help in complementing surgical biopsy in situations in which tissue biopsy is difficult or risky. Second, the number of patients enrolled in the study is moderate. As such, we did not attempt to further distinguishing glioma subtypes or individual grades. Finally, limited by the SNR, the highest b-value attempted in this study was 4000 s/mm2, though an even higher b-value may further improve the reliability of extracting the FROC diffusion parameters.26,29,45
Conclusions
We have demonstrated the feasibility of using high-b-value diffusion MR imaging with the FROC diffusion model to improve differentiation between low- and high-grade gliomas. In particular, the new parameter β offers a higher diagnostic accuracy than using the diffusion coefficient (D or ADC) alone and is the most useful and dominant parameter among the 3 FROC parameters for differentiating glioma grades. Although the focus of this study is on gliomas, the non-Gaussian diffusion imaging approach demonstrated herein is expected to have applications in other disease processes that involve tissue-heterogeneity changes.
Acknowledgments
The authors are grateful to Drs Keith R. Thulborn, Kejia Cai, and Frederick C. Damen for helpful discussions.
Footnotes
Yi Sui and Ying Xiong contributed equally and share the first authorship.
Disclosures: Yi Sui—UNRELATED: Employment: GE Healthcare, Comments: joined GE Healthcare after the work was done. Xiaohong Joe Zhou—RELATED: Grant: National Institutes of Health grant No. 1S10RR028898*; UNRELATED: Consultancy: Horizon Medical Physics Services, Comments: consulting fees and ownership; Grants/Grants Pending: National Institutes of Health Grant No. 1R21EB023050–01,* AbbVie Pharmaceuticals,* Comments: federal or industrial grant support; Royalties: Elsevier Publishing, Comments: royalty payment for a book I coauthored. *Money paid to the institution.
This work was supported, in part, by the National Natural Science Foundation of China (grant number: 30870702), the National Program of the Ministry of Science and Technology of China during the “12th Five-year Plan” (grant No. 2011BAI08B10), and the National Institutes of Health (grant No. 1S10RR028898).
Paper previously presented in part at: Annual Meeting of the Radiological Society of North America, November 30 to December 5, 2014; Chicago, Illinois.
Indicates open access to non-subscribers at www.ajnr.org
References
- Received November 25, 2015.
- Accepted after revision February 22, 2016.
- © 2016 by American Journal of Neuroradiology


Jump to section
Related Articles
Cited By...
- No citing articles found.