
Abstract
BACKGROUND AND PURPOSE: Characterization of iron deposition associated with demyelinating lesions of multiple sclerosis and neuromyelitis optica has not been well studied. Our aim was to investigate the potential of ultra-high-field MR imaging to distinguish MS from neuromyelitis optica and to characterize tissue injury associated with iron pathology within lesions.
MATERIALS AND METHODS: Twenty-one patients with MS and 21 patients with neuromyelitis optica underwent 7T high-resolution 2D-gradient-echo-T2* and 3D-susceptibility-weighted imaging. An in-house-developed algorithm was used to reconstruct quantitative susceptibility mapping from SWI. Lesions were classified as “iron-laden” if they demonstrated hypointensity on gradient-echo-T2*-weighted images and/or SWI and hyperintensity on quantitative susceptibility mapping. Lesions were considered “non-iron-laden” if they were hyperintense on gradient-echo-T2* and isointense or hyperintense on quantitative susceptibility mapping.
RESULTS: Of 21 patients with MS, 19 (90.5%) demonstrated at least 1 quantitative susceptibility mapping–hyperintense lesion, and 11/21 (52.4%) had iron-laden lesions. No quantitative susceptibility mapping–hyperintense or iron-laden lesions were observed in any patients with neuromyelitis optica. Iron-laden and non-iron-laden lesions could each be further characterized into 2 distinct patterns based on lesion signal and morphology on gradient-echo-T2*/SWI and quantitative susceptibility mapping. In MS, most lesions (n = 262, 75.9% of all lesions) were hyperintense on gradient-echo T2* and isointense on quantitative susceptibility mapping (pattern A), while a small minority (n = 26, 7.5% of all lesions) were hyperintense on both gradient-echo-T2* and quantitative susceptibility mapping (pattern B). Iron-laden lesions (n = 57, 16.5% of all lesions) were further classified as nodular (n = 22, 6.4%, pattern C) or ringlike (n = 35, 10.1%, pattern D).
CONCLUSIONS: Ultra-high-field MR imaging may be useful in distinguishing MS from neuromyelitis optica. Different patterns related to iron and noniron pathology may provide in vivo insight into the pathophysiology of lesions in MS.
ABBREVIATIONS:
- GRE
- gradient-echo
- NMO
- neuromyelitis optica
- ppb
- parts per billion
- QSM
- quantitative susceptibility mapping
- R2*
- transverse relaxation rate
Multiple sclerosis and neuromyelitis optica (NMO) are distinct inflammatory disorders of the CNS with different pathophysiology and approaches to treatment.1 It is imperative to differentiate MS from NMO before the commencement of treatment, but this task can be challenging in view of the overlap in clinical manifestations and findings on conventional neuroimaging.2 Ultra-high-field imaging, by virtue of increased SNR, increased spatial resolution, and markedly improved venous and iron contrast within lesions,3 has the potential to shed light on the underlying pathophysiology of MS and NMO and help distinguish these 2 conditions. 7T MR imaging studies4,5 have shown that 60%–80% of MS lesions are traversed by a central venule, while only a small minority of NMO lesions contain a central venule.5,6 Iron pathology may also be different in these 2 diseases: substantially higher iron content has been observed in deep GM regions of patients with MS than in those with NMO.7 In MS, iron accumulation in both acute and chronic phases of lesion development has been reported,8⇓⇓⇓–12 but to our knowledge, no studies have investigated whether iron is present in brain lesions of NMO.
The underlying pathology of MS lesions can be a dynamic process involving both demyelination and iron-related pathophysiology during the course of the disease.13⇓⇓–16 Compared with conventional T2* imaging or SWI, the recent development of quantitative susceptibility mapping (QSM) offers a useful tool for iron quantification by deconvolving the phase images.17⇓–19 Both paramagnetic (eg, iron) and diamagnetic materials (eg, myelin) present low signal on conventional T2* or SWI; however, their susceptibility sources can be well-differentiated on QSM, with paramagnetic materials being high signal and diamagnetic material being low signal.19 Consequently, demyelination (diamagnetic myelin loss) and accompanying tissue water changes result in increased signal on T2* or SWI, but relatively low QSM values compared with iron deposition. Therefore, it is possible to make inferences about underlying tissue pathology associated with iron deposition and demyelination by using QSM combined with other multicontrast sequences. Moreover, QSM improves the detection and spatial distribution of subtle iron deposition that is not seen on conventional T2* imaging.20 This improvement makes it possible to describe patterns of iron deposition within lesions (eg, nodular versus ringlike) on the basis of their 7T MR imaging findings, which have been rarely described in the literature.
The purpose of the present study was to investigate the potential of multicontrast ultra-high-field MR imaging to distinguish patients with MS from those with NMO and to characterize 7T MR imaging lesion patterns that are associated with iron and noniron pathology in these diseases.
Materials and Methods
Subjects
This study was conducted at 2 academic MS referral centers: New York University Medical Center, New York, and Charité University, Berlin. Both sites received approval from local institutional review boards. Written informed consent was obtained from all patients before study entry. Inclusion criteria were a diagnosis of NMO spectrum disorders (International Panel for NMO Diagnosis Criteria21) or definite MS (McDonald Criteria22). Twenty-one patients with NMO (mean age, 47.6 ± 14.2 years; all women, mean disease duration, 8.4 ± 6.7 years; range, 1–26.6 years) were enrolled in this study. All patients were NMO Ab seropositive by immunohistochemical or by enzyme-linked immunosorbent assays.
Twenty-one patients with MS were enrolled (mean age, 47.1 ± 10.3 years; 6 men/15 women; disease duration, 11.5 ± 5.9 years; range, 4–25 years). This group included patients with relapsing-remitting (n = 19) and secondary-progressive (n = 2) MS. There was no significant difference in mean age and mean disease duration between MS and NMO groups (P > .05).
Ultra-High-Field MR Imaging
All patients underwent ultra-high-field MR imaging by using identical whole-body 7T human MR imaging systems (Magnetom; Siemens, Erlangen, Germany) equipped with a 24-channel phased array coil (Nova Medical, Wilmington, Massachusetts). The imaging protocol included high-resolution axial 2D-gradient-echo (GRE) T2*-weighted imaging, high-resolution axial 3D-SWI, FLAIR, and sagittal T1-weighted 3D-MPRAGE sequences. Only supratentorial brain regions were covered while acquiring 2D-GRE-T2* and 3D-SWI to avoid susceptibility artifacts from air-tissue interfaces. None of the patients received intravenous contrast agent. The acquisition parameters were the following: for GRE-T2*-weighted imaging: TR/TE = 580/25 ms, flip angle = 35°, section thickness = 2 mm, FOV = 240 × 240 mm2, voxel size = 0.2 × 0.2 mm2; for sagittal 3D sampling perfection with application-optimized contrasts by using different flip angle evolution sequence (SPACE; Siemens) FLAIR: TR/TE/ TI = 8000/380/2100 ms, isotropic voxel size = 1.0 × 1.0 × 1.0 mm3; and for sagittal T1-weighted 3D-MPRAGE: TR/TE/TI = 2000/2.92/1100 ms, isotropic voxel size = 1.0 × 1.0 × 1.0 mm3.
High-resolution flow-compensated 3D-SWI was acquired with the following parameters: TR/TE = 27/18 ms, flip angle = 18°, section thickness = 2 mm, FOV = 240 × 240 mm2, base resolution = 1024, voxel size = 0.2 × 0.2 × 2 mm3, bandwidth = 110 Hz/px, acquisition time = 7 minutes and 49 seconds, and integrated parallel imaging technique factor = 2. Equivalent imaging parameters were used at both sites for all the sequences; however, at the German site, a voxel size of 0.5 × 0.5 × 2 mm3 was used for the 3D-SWI sequence.
Data Postprocessing
The source magnitude and phase images from each SWI scan were obtained and used to generate SWI venography. All phase images were reconstructed and corrected for field inhomogeneities with a Hanning high-pass filter (96 × 96) by using Signal Processing In NMR software (SPIN; MR Imaging Institute for Biomedical Research, Detroit, Michigan). The original magnitude image was multiplied by the phase mask 4 times to enhance the visibility of lesion and venous structures. Finally, SWI venograms were created by performing minimum intensity projection over 2 contiguous sections.
Susceptibility-weighted imaging and the mapping algorithm developed by Haacke et al23 were used to reconstruct QSM maps from high-resolution 3D-SWI data. The postprocessing involved skull stripping to remove the artifacts caused by skull and brain tissue interface by using the FSL Brain Extraction Tool (http://fsl.fmrib.ox.ac.uk/fsl/fslwiki/BET), followed by phase unwrapping by using a Laplacian operator. To remove background field inhomogeneity, we applied a variable high-pass filter of 32 pixels and, finally, performed inverse filtering to generate QSM maps.
Data Analysis
All MR images were analyzed by using ImageJ software (National Institutes of Health, Bethesda, Maryland). All MS and NMO lesions were analyzed side by side on axial GRE-T2*, 3D-SWI, and QSM images. The following morphologic imaging characteristics were recorded for each lesion: 1) the largest cross-sectional diameter, 2) the presence of 1 or multiple central intralesional venules, 3) differential signal intensity within the lesions, and 4) the presence of a peripheral rim.
The lesion signals on GRE-T2*, SWI, and QSM and their putative correlations with underlying pathology are summarized in Table 1. On the basis of this table, we analyzed lesion signal intensity on GRE-T2*, SWI, and QSM images. Pattern A lesions were hyperintense on GRE-T2*-weighted images, hyperintense or isointense on SWI, and isointense (inconspicuous) on QSM. Pattern B lesions were hyperintense on GRE-T2* and hyperintense on QSM. Pattern A and B lesions were considered non-iron-enriched. On the other hand, lesions that demonstrated hypointensity on GRE-T2* and/or SWI and hyperintensity on QSM were considered “iron-laden.” These lesions were further classified as nodular (pattern C) or exhibiting a peripheral rim (pattern D). We computed QSM values from all lesions that demonstrated hyperintensity on QSM by manually drawing ROIs. Because the use of a high-pass filter while reconstructing QSM maps may reduce the effective iron content from different tissue compartments, we believe this process might have resulted in underestimation of the QSM values computed from iron- and non-iron-laden lesions. To correct for the QSM values, we used a simulation algorithm24 to obtain a scaling factor based on the size of the lesions. This size-dependent scaling factor was multiplied by the original QSM values to obtain corrected QSM values for each lesion.
Proposed histopathologic interpretation based on signal-intensity changes on MR images
Statistical Analysis
A χ2 test was performed to look for differences in proportions of lesions with central venules in patients with MS and NMO. Receiver operating characteristic analyses were performed to estimate the sensitivity and specificity of selected subject-level conditions (at least 1 lesion with a central venule, at least 1 iron-laden lesion, at least 1 QSM hyperintense lesion) as criteria for classifying patients as testing positive for MS. Clopper-Pearson confidence intervals were derived for the sensitivity and specificity associated with each condition.
All lesions providing a QSM value were classified as having a central venule. Mixed-model analysis of variance was used to compare iron-laden from non-iron-laden lesions in terms of QSM while accounting for the correlation among QSM values derived for lesions in the same patient. The covariance structure was modeled by assuming QSM values to be independent when acquired from different patients and symmetrically correlated when acquired from lesions within the same patient, with the strength of correlation dependent on whether lesions were of the same type (eg, lesions were both classified as iron-laden). A probability value < .05 was considered significant. All data analysis was performed by using SPSS for Windows, Version 15.0 (IBM, Armonk, New York).
Results
Distinguishing Patients with MS from Those with NMO
A total of 345 MS and 132 NMO discrete lesions were observed in supratentorial brain regions of 21 patients with MS and 21 with NMO. The mean cross-sectional diameter for MS lesions (5.44 ± 2.66 mm) was significantly larger than that of NMO lesions (3.19 ± 1.12 mm, P < .001). While MS lesions had variable shapes, most of the NMO lesions were round. Of 345 MS lesions, 227 (65.8%) were traversed by intralesional central venules, while only 8/132 (6.1%) NMO lesions showed this feature. All patients with MS had ≥1 lesion traversed by a central venule. On the other hand, only 4 patients with NMO had ≥1 lesion traversed by a central venule. The presence of at least 1 lesion with a central venule distinguished MS from NMO with a sensitivity of 100% (95% CI, 83.9%–100%) and a specificity of 71.4% (95% CI, 47.8%–88.7%).
MS lesions varied in signal intensity on GRE-T2*, SWI, and QSM. In the MS cohort, 19/21 (90.5%) patients had at least 1 hyperintense lesion on QSM, and this feature distinguished patients with MS from those with NMO with a sensitivity of 90.5% (95% CI, 69.6%–98.8%) and a specificity of 100% (95% CI, 83.9%–100%). Moreover, 11/21 (52.4%) patients had iron-laden lesions (see the “Data Analysis” section for a definition). In contrast, all NMO lesions demonstrated hyperintense signal relative to surrounding brain parenchyma on GRE-T2* weighted images and were isointense (inconspicuous) on QSM. Thus, none of the patients with NMO had any iron-rich lesions (Fig 1). The presence of at least 1 iron-laden lesion characteristic distinguished MS from NMO with a sensitivity of 52.4% (95% CI, 29.8%–74.3%) and a specificity of 100% (95% CI, 83.9%–100%).

Distinguishing MS from NMO lesions. Axial T2-weighted image from a representative patient with MS demonstrating a hyperintense lesion (black arrow) traversed by an ill-defined central venule adjacent to the inferior horn of the lateral ventricles. The lesion appears hypointense on a corresponding T1-weighted MPRAGE image. The lesion shows a hypointense peripheral rim and an iso- to hypointense central core traversed by a well-defined venule on GRE-T2*-weighted image. This lesion is hyperintense on QSM. Hypointense signal intensity within the lesion on GRE-T2*-weighted image and hyperintensity on QSM suggest iron accumulation (upper row). An axial T2-weighted image from a representative NMO lesion reveals 2 round hyperintense lesions (white arrows) in the subcortical WM region. The lesions appear hypointense on T1-weighted and hyperintense on GRE-T2*-weighted images. However, these lesions are isointense and therefore inconspicuous on QSM (lower row). The scale bar is for the QSM image with units of parts per billion.
Characterization of Different Lesion Patterns in MS
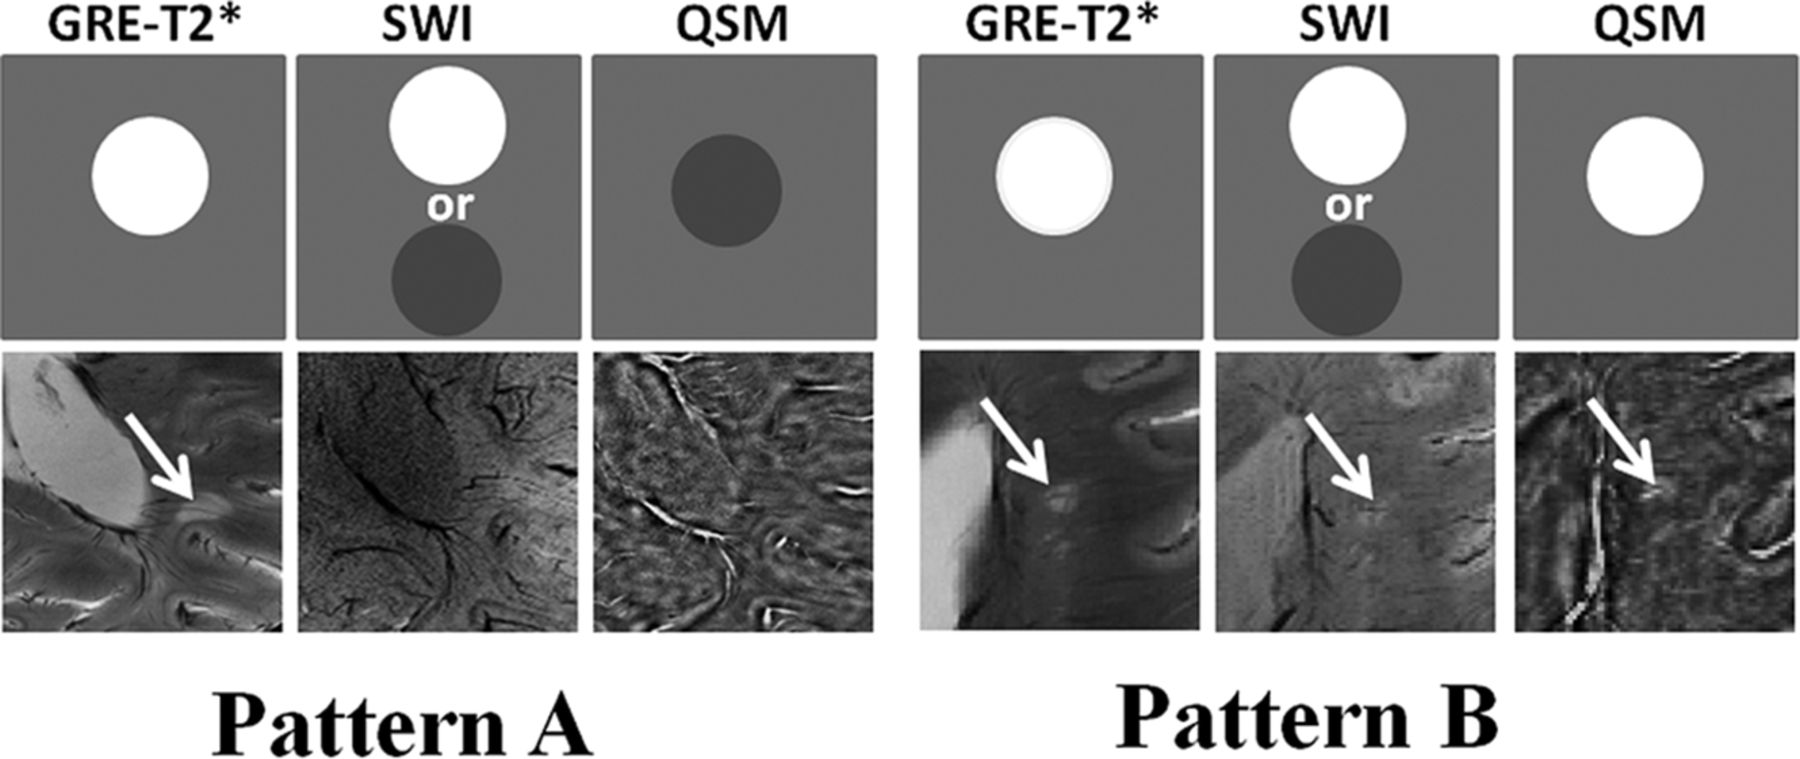
Examples of 4 morphologically distinct lesion patterns seen in MS are shown in Figs 2 and 3. Signal intensity on GRE-T2*, SWI, and QSM for different lesion patterns in MS is presented in Table 2. Most of the MS lesions (n = 262, 75.9%) were pattern A (all were hyperintense on GRE-T2*-weighted images and inconspicuous on QSM). On SWI, only 53/262 of these lesions demonstrated hyperintensity. Of 262 pattern A lesions, 148 (56.4%) were traversed by a central venule. A small number of lesions (n = 26, 7.5%) were pattern B (hyperintensity on both GRE-T2*-weighted images and QSM). On SWI, only 11/26 of these lesions demonstrated hyperintensity. Of the 26 pattern B lesions, 22 (84%) were traversed by a central venule.

Non-iron-laden MS lesions (2 differential signal-intensity patterns). In the upper rows, schematic sketches are shown for pattern A and B lesions depicting ideal signal-intensity distribution on the GRE-T2*-weighted image, SWI, and QSM. In the lower rows, axial GRE-T2*-weighted image shows a hyperintense lesion traversed by a central intralesional venule. This lesion is located in close proximity to the posterior horn of the lateral ventricle. However, it appears isointense on SWI and QSM (pattern A) and hence inconspicuous on these images; this feature suggests a chronic inactive stage of lesion development comprising variable degrees of edema, demyelination, micronecrosis, and gliosis. Axial GRE-T2*-weighted image highlights a hyperintense lesion in the periventricular region traversed by a clearly distinguishable central venule. This lesion also appears hyperintense on corresponding SWI and QSM (pattern B), suggesting acute and extensive demyelinating (loss of diamagnetism) and inflammatory processes within the lesion.

Iron-laden MS lesions (2 geometrically distinct susceptibility patterns). In the upper rows, schematic sketches are shown for pattern C and D lesions, depicting a characteristic signal-intensity distribution on GRE-T2*-weighted images, SWI, and QSM. In the lower rows, axial GRE-T2*-weighted image presents a pair of lesions in the subcortical WM region. While one lesion is nodular hyperintense (white arrow), another lesion is nodular hypointense (black arrow). Both lesions are crisscrossed by intralesional central venules and show hypointense signal on SWI but hyperintense signal on QSM, thus indicating iron deposition (pattern C). Axial GRE-T2*-weighted image reveals a lesion (white arrow) with a hypointense peripheral rim having a central venous structure in the subcortical WM region. The lesion also shows a hypointense rim on the corresponding SWI and a hyperintense rim on the corresponding QSM, suggesting a ringlike lesion with iron deposition only at the edges (pattern D).
Signal intensity on GRE-T2*, SWI, and QSM for different lesion patterns in MS
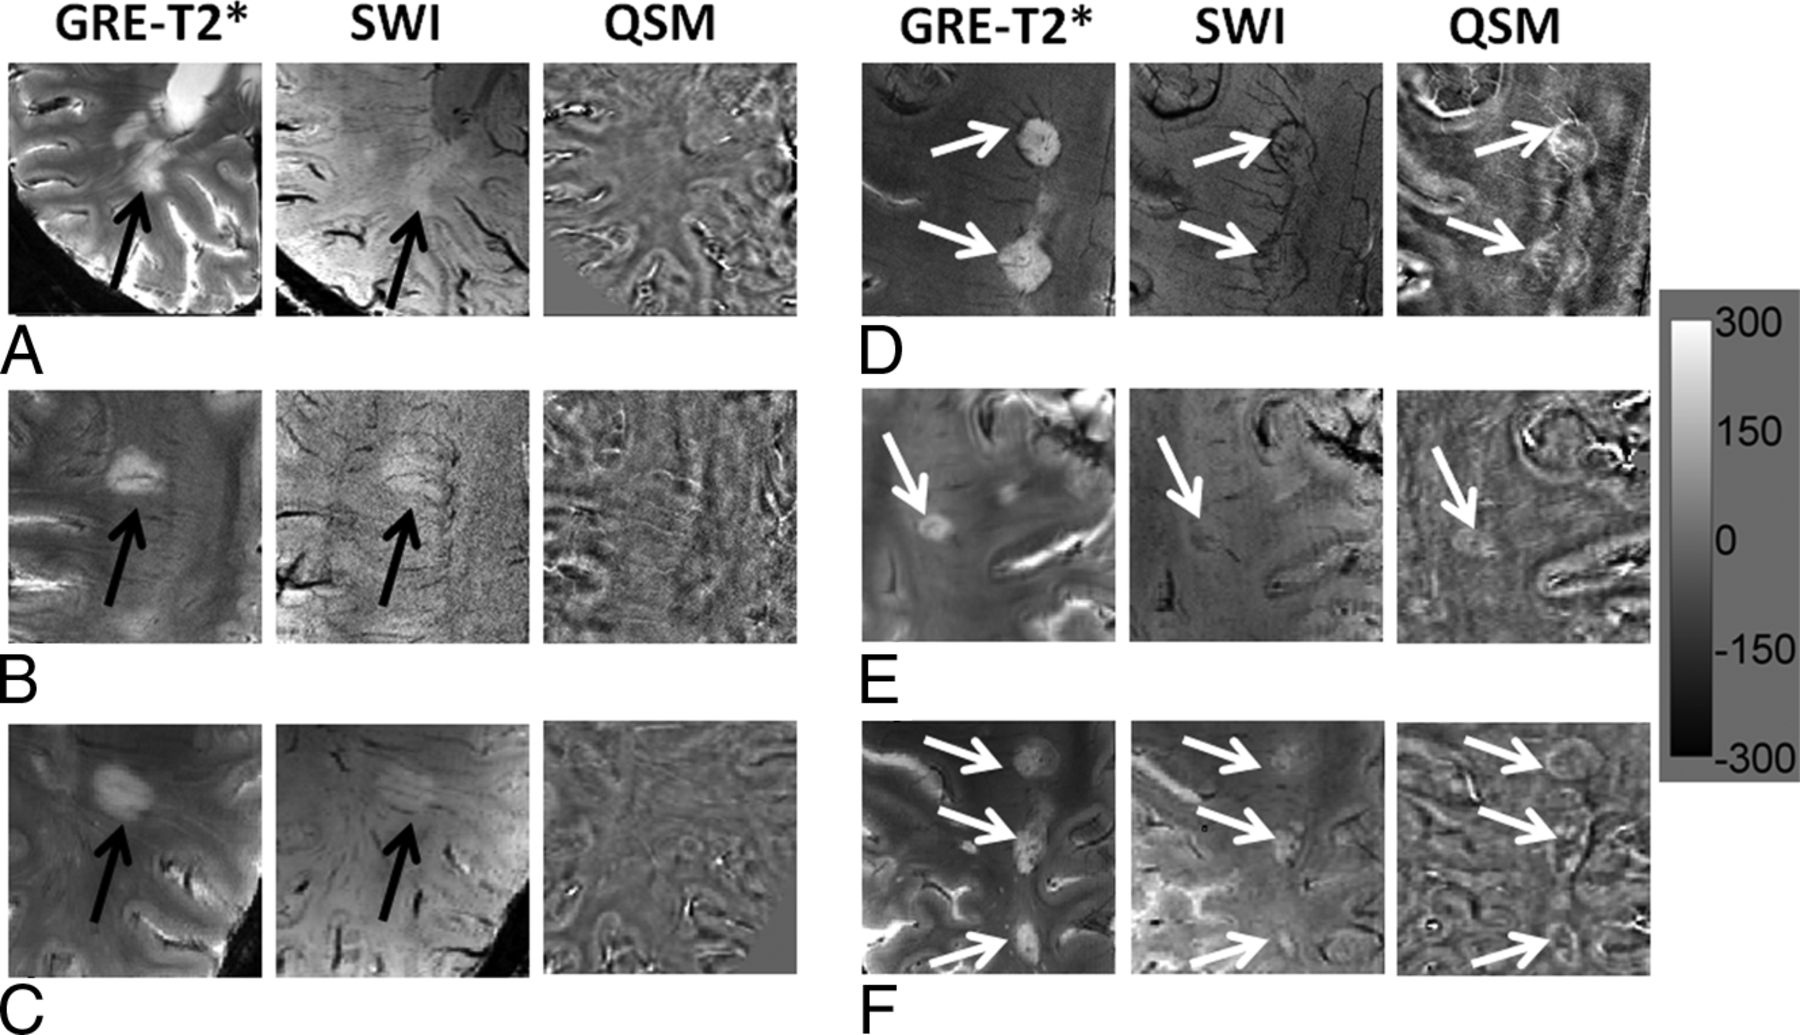
Some lesions (n = 57, 16.5% of all MS lesions) demonstrated hypointensity on GRE-T2*-weighted images and/or SWI, but hyperintensity on QSM; these lesions were presumed to be iron-laden. Seventeen of 57 iron-laden MS lesions demonstrated hyperintensity on GRE-T2*, and 40/57 were hypointense on GRE-T2* images. All except 1 (56/57) demonstrated hypointensity on SWI. All of these iron-laden QSM hyperintense lesions were traversed by a central venule (57/57). Furthermore, of 288 non-iron-laden MS lesions, 240 (83.3%) had ill-defined and faint margins generally, while only 12 of 57 (21%) iron-laden MS lesions had ill-defined margins (Fig 4).

Large MS lesions with well-defined and ill-defined margins. Axial GRE-T2*-weighted images (A–C) demonstrate large but faint hyperintense lesions (black arrow) without any definite margins. These lesions appear hyperintense on SWI (black arrows) and isointense on QSM; this appearance indicates the absence of iron deposits (left panel). On the other hand, axial GRE-T2*-weighted images (D–F) also show large hyperintense lesions (white arrows) with well-defined margins. These lesions are visible as hypointense structures on SWI and hyperintense on QSM; this appearance is highly suggestive of intralesional iron deposits (right panel). The scale bar is for the QSM image with units of parts per billion.
The iron-laden lesions had 2 geometrically distinct susceptibility patterns: nodular if they had solid signal intensity on QSM (n = 22, 6.4%; pattern C) or ringlike if they had a distinct peripheral rim on QSM (n = 35, 10.1%; pattern D). However, all of these iron-laden lesions demonstrated hypointensity on SWI. The mean QSM was significantly higher for iron-laden lesions than for non-iron-laden lesions (P = .027; Fig 5A). The least squares mean ± standard error of the mean of QSM, adjusted for within-subject correlations, was 38.73 ± 4.81 parts per billion (ppb) for iron-laden lesions and 26.36 ± 2.2 ppb for lesions that were not iron-laden. Receiver operating characteristic analysis provided a threshold QSM value of 39.26 ppb to distinguish iron- from non-iron-laden lesions with a sensitivity of 70.2% and specificity of 57.7% (Fig 5B).

QSM vales from iron-laden and non-iron-laden lesions. Box-and-whisker plots (A) show the distribution of mean QSM (parts per billion) from iron-laden and non-iron-laden lesions. Iron-laden lesions (patterns C and D) had significantly higher QSM than non-iron-laden QSM hyperintense lesions (pattern B). Boxes represent the median, 25th percentile, and 75th percentile. The asterisk indicates a significant difference (P = .001). Solid circles represent the outliers. The receiver operating characteristic curve shows an area under the curve of 0.74. The receiver operating characteristic analysis (B) provides a sensitivity of 70.2% and a specificity of 57.7% in distinguishing these 2 types of lesions at a threshold QSM value of 30.26 ppb.
Discussion
Early differentiation of NMO from MS is crucial for optimal management clinically.1,2 Although the recent availability of commercial testing for antibodies to Aquaporin-4 water has facilitated differentiation of NMO from MS, a correct diagnosis still remains challenging, particularly in those patients with NMO with multiple brain lesions on MR imaging. Many patients with NMO are still misdiagnosed with MS.25 Hence, development of newer imaging biomarkers that can enable objective separation of these 2 diseases is warranted. Our analysis of the morphologic and structural features of MS and NMO supratentorial lesions by using multicontrast 7T MR imaging helps to further differentiate the 2 conditions and provides insight into lesional pathology in vivo. We found that iron deposition within a lesion (hyperintense signal on QSM) distinguished patients with MS from those with NMO with a sensitivity of 90.5% (95% CI, 69.6%–98.8%) and a specificity of 100% (95% CI, 83.9%–100%). Analysis of the signal intensity of lesions on GRE, SWI, and QSM sequences allowed us to divide all lesions into 4 patterns, of which 2 were iron-enriched and 2 were non-iron-enriched (Table 2). A characteristic feature of MS was the variety of lesion types observed: All patients with MS had lesions of >1 type, though most lesions were of pattern A, while all NMO lesions were of 1 type only (pattern A).
Using phase imaging and transverse relaxation rate (R2*) mapping on high-field MR imaging, prior studies have assessed the iron content of MS lesions qualitatively11,12,26 and quantitatively.27 However, many confounding factors are associated with these imaging techniques, including dependence on orientation and distribution of susceptibility sources that may influence the heterogeneity of phase and R2* and thereby render these images less reliable and quantifiable. QSM, on the other hand, provides more robust and quantitative evaluation of magnetic susceptibility sources such as iron, myelin, and calcium that are present in normal and diseased brain tissues.28 Moreover, susceptibility is a physical quantity that is independent of imaging parameters and has the potential to distinguish and quantify different susceptible tissues.29 In the present study, a recently23 described susceptibility-weighted imaging and mapping method was used to reconstruct QSM from 3D-SWI, providing susceptibility values from different tissue compartments with high accuracy.30
Our findings on 7T MR imaging that not all MS lesions have iron deposition are consistent with the earlier, lower field studies.9 Iron deposition may vary among individual lesions on the basis of their age and inflammatory status. We observed 4 morphologically distinct patterns of MS lesions, 2 of which were considered iron-enriched. Most non-iron-enriched MS lesions were hyperintense on GRE-T2*-weighted images and isointense and thus inconspicuous on QSM (pattern A). This pattern could be plausibly attributed to varying degrees of demyelination, edema, micronecrosis, and gliosis in chronic inactive lesions. A minority of non-iron-containing lesions demonstrated hyperintensity on both GRE-T2* and QSM images (pattern B), suggesting more acute and extensive demyelination (loss of diamagnetism, but less magnetic susceptibility effect than iron deposition) and inflammation compared with pattern A lesions. Because no tissue specimens were available to perform histopathologic/histochemical analysis from our patients, our interpretation of the imaging features was based on the prior correlative imaging and histopathologic studies.11,12 More work is needed to ascertain the pathologic significance of susceptibility changes.
Iron-laden MS lesions with hyperintensities on QSM were of 2 patterns: iron either deposited in the center core (nodular iron-laden lesions, pattern C) or in a ringlike fashion at the lesion edge (pattern D). Previous histochemical studies showed that iron deposits were present in a subset of chronic, demyelinating active MS lesions.11,12 The molecular pathways for iron accumulation in MS lesions are still not fully understood; however, several possible biologic mechanisms, such as iron-rich oligodendrocyte debris, iron-sequestered microglia or macrophages, and products of local microhemorrhages following venule wall damage may contribute to iron deposition.14,15 On 3T MR imaging, Chen et al18 observed lower QSM values from acute enhancing lesions (small susceptibilities) and increased QSM values from nonenhancing lesions (high susceptibilities). This observation suggests that lesion susceptibility measured by QSM is a useful biomarker for monitoring MS disease activities. Perhaps, the preponderance of non-iron-containing lesions in MS in our study is because they were imaged long after their formative stage.
Most iron-laden lesions in our study were ringlike. Histopathologically, it has been observed that maximum accumulation of iron occurs at the edges of classic, reactive, slowly expanding chronically existing MS lesions.11 In these reactive lesions, demyelination and oligodendrocyte destruction occur in a zone of variable size at the lesion border. Thus, iron-containing myelin and oligodendrocytes gradually decreased from the perilesional regions toward the lesion centers. Additionally, iron-containing microglia and macrophages that are mainly located at the edge of chronic reactive lesions undergo microglial dystrophy leading to a variable degree of iron deposition within the different compartments of the MS lesions.11,12 Moreover, iron-laden MS lesions were well-circumscribed with well-defined margins while non-iron-laden lesions had poorly defined margins and were generally larger. The reason for this observation is not clearly understood; however, it might be because of accumulation of iron-enriched microphages or microglia cells in the iron-laden lesions or more activity associated with these lesions.
An interesting observation to emerge from our study is that the probability of finding a small venule in the center of lesions depends on the lesion pattern. All of the iron-laden MS lesions, 100% (patterns C and D), and 84% of presumed extensive demyelinating lesions (pattern B) were traversed by central venule. However, only 56% of non-iron-containing pattern A lesions had a central venule. We hypothesize that iron-containing and extensively demyelinating lesions are chronologically “younger” than the non-iron-containing pattern A lesions and, therefore, are more likely to indicate the presence of central vein. The pattern A lesions are more chronic, and a central vein may become occluded at this stage.
Only a few studies have reported QSM values from MS lesions and even fewer used 7T MR imaging combining different signal patterns on various sequences. In a 3T MR imaging study, Chen et al18 reported QSM values from MS lesions at various evolutionary stages. Investigators observed QSM values of ∼38 ppb from early-to-intermediary-aged nonenhanced iron-laden MS lesions. Slightly lower QSM values (∼30 ppb) were observed from iron-laden lesions in another study.19 In close agreement with these prior studies,18,19 the mean QSM value in iron-laden lesions in our study was ∼44 ppb. QSM increases are seen in demyelination and iron deposition, but because iron is strongly paramagnetic, the QSM values due to iron deposition were higher than those due to loss of myelin. The susceptibility of myelin is only slightly more diamagnetic than that of CSF; therefore, a voxel completely packed with WM fibers would be expected to undergo a maximal susceptibility increase at complete demyelination (loss of diamagnetism). Therefore, susceptibility increases beyond those observed for CSF derive from sources other than demyelination.28 Because ferritin, hemosiderin, and breakdown products of hemorrhage make up for a substantially high susceptibility effect, we hypothesize that higher QSM values from pattern C and D lesions further support the notion that the susceptibility of these lesions is caused predominantly by their iron content. On the other hand, pattern B lesions that also showed hyperintense signal on QSM were presumably associated with extensive demyelination, but not iron deposition, which explains why QSM values of pattern B lesions are lower than those of patterns C and D as indicated by the receiver operating characteristic analysis (Fig 5).
Another interesting observation was that only 70% of the iron-laden lesions demonstrated hypointense signal on GRE-T2*-weighted images, whereas 98% of the lesions showed hypointensity on SWI, despite similar section thickness and in-plane resolution for both of these images. In accordance with previous studies,31,32 our observation suggests that SWI is more sensitive to susceptibility effects than GRE-T2*-weighted images, probably because SWI combines information both from phase and magnitude images to ascertain the local susceptibility changes among neighboring tissues, whereas susceptibility contrast on GRE-T2* is mainly dependent on a combination of spin-spin relaxation (T2) and magnetic field inhomogeneity. We believe that inclusion of phase information renders SWI more sensitive to susceptibility effects than GRE-T2* images.
There were some limitations to the current study. Most of the patients with MS had a diagnosis of relapsing-remitting MS. To obtain a more comprehensive understanding of the evolution of MS lesions by using multicontrast imaging, future studies would need to include patients with different types of MS (clinically isolated syndrome, secondary- and primary-progressive MS). Our patients with NMO had similar kinds of “nonspecific” subcortical lesions. A number of other kinds of NMO-specific lesions have been described33 but were not seen in our series. Another limitation of the current study was that R2* or T2* mapping was not performed; these sequences may provide additional quantitative information for the characterization of NMO and MS lesions.
Conclusions
Four morphologically different patterns were observed for MS lesions, while NMO lesions exhibited only 1 pattern. Approximately half of patients with MS (52.4%) had at least 1 iron-laden lesion, but none of the patients with NMO had iron-enriched lesions. Our study suggests that QSM, combined with other imaging sequences at 7T, helps further differentiate MS from NMO and provides insight into lesional pathogenesis and iron metabolism in these 2 autoimmune disorders of the central nervous system.
Acknowledgments
We thank Dr James Babb for his help with data analysis.
Footnotes
Disclosures: Ilya Kister—RELATED: Grant: Guthy-Jackson Charitable Foundation*; UNRELATED: Consultancy: Biogen-Idec; Grants/Grants Pending: National Multiple Sclerosis Society,* Biogen-Idec,* Serono,* Novartis.* Jens Wuerfel—UNRELATED: Board Membership: Novartis Advisory Board; Employment: CEO, MIAC AG; Payment for Lectures (including service on Speakers Bureaus): Novartis, Biogen-Idec, Bayer, Teva; Payment for Development of Educational Presentations: Novartis. Saifeng Liu—RELATED: Grant: Canadian Institutes of Health Research,* Heart and Stroke Foundation of Canada,* Synchrotron Medical Imaging Team grant CIF 99472.* Tim Sinnecker—RELATED: Grant: German Research Foundation,* German Competence Network Multiple Sclerosis,* Guthy-Jackson Charitable Foundation*; UNRELATED: Employment: Charité University Berlin; Asklepios Fachklinikum Teupitz; Travel/Accommodations/Meeting Expenses Unrelated to Activities Listed: Bayer, Novartis, Genzyme, Teva. E. Mark Haacke—UNRELATED: Patents (planned, pending or issued) and Royalties: MR Innovations, Comments: patents on SWI and susceptibility-weighted imaging and mapping. Friedemann Paul—RELATED: Grant: Guthy-Jackson Charitable Foundation*; UNRELATED: Board Membership: Novartis, Chugai Pharmaceutical, Genzyme, Alexion Pharmaceuticals, MedImmune, Comments: various steering committees and advisory boards; Consultancy: Novartis, Biogen-Idec, Roche, Teva, Alexion Pharmaceuticals, MedImmune; Grants/Grants Pending: Guthy-Jackson Charitable Foundation,* National Multiple Sclerosis Society *; Payment for Manuscript Preparation: Bayer, Genzyme. Yulin Ge—RELATED: Grant: National Institutes of Health,* National Multiple Sclerosis Society,* Comments: This work was also partly supported by grant numbers: 5R01 NS029029, 3NS-029029–20S1, and 5NS-076588 of the National Institutes of Health and a Research Grant (RG4707A1) of the National Multiple Sclerosis Society. *Money paid to the institution.
This work was supported by a Cure Grant of the Guthy-Jackson Charitable Foundation and a Research Grant (RG 5187-A-3) of the National Multiple Sclerosis Society. Additionally, this work was also partly supported by grant numbers 5R01 NS029029, 3NS-029029–20S1, and 5NS-076588 of the National Institutes of Health and a Research Grant (RG4707A1) of the National Multiple Sclerosis Society.
Paper previously presented in part as an oral presentation at: Annual Meeting and Exhibition of the International Society for Magnetic Resonance in Medicine, May 30 to June 5, 2915; Toronto, Ontario, Canada.
Indicates open access to non-subscribers at www.ajnr.org
REFERENCES
- Received September 14, 2015.
- Accepted after revision January 1, 2016.
- © 2016 by American Journal of Neuroradiology


Jump to section
Related Articles
Cited By...
- Brain mineralization in postoperative delirium and cognitive decline
- SWI as an Alternative to Contrast-Enhanced Imaging to Detect Acute MS Lesions
- Patterning Chronic Active Demyelination in Slowly Expanding/Evolving White Matter MS Lesions
- Value of 3T Susceptibility-Weighted Imaging in the Diagnosis of Multiple Sclerosis
- Dark Rims: Novel Sequence Enhances Diagnostic Specificity in Multiple Sclerosis
- Spatiotemporal evolution of venous narrowing in acute MS lesions