
Article Figures & Data
Figures
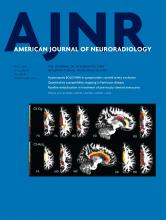
- Fig 1.
Position of the PBI cylinder (white rectangle) and location of CSF flow evaluation (white line) are shown in a patient with CMI.
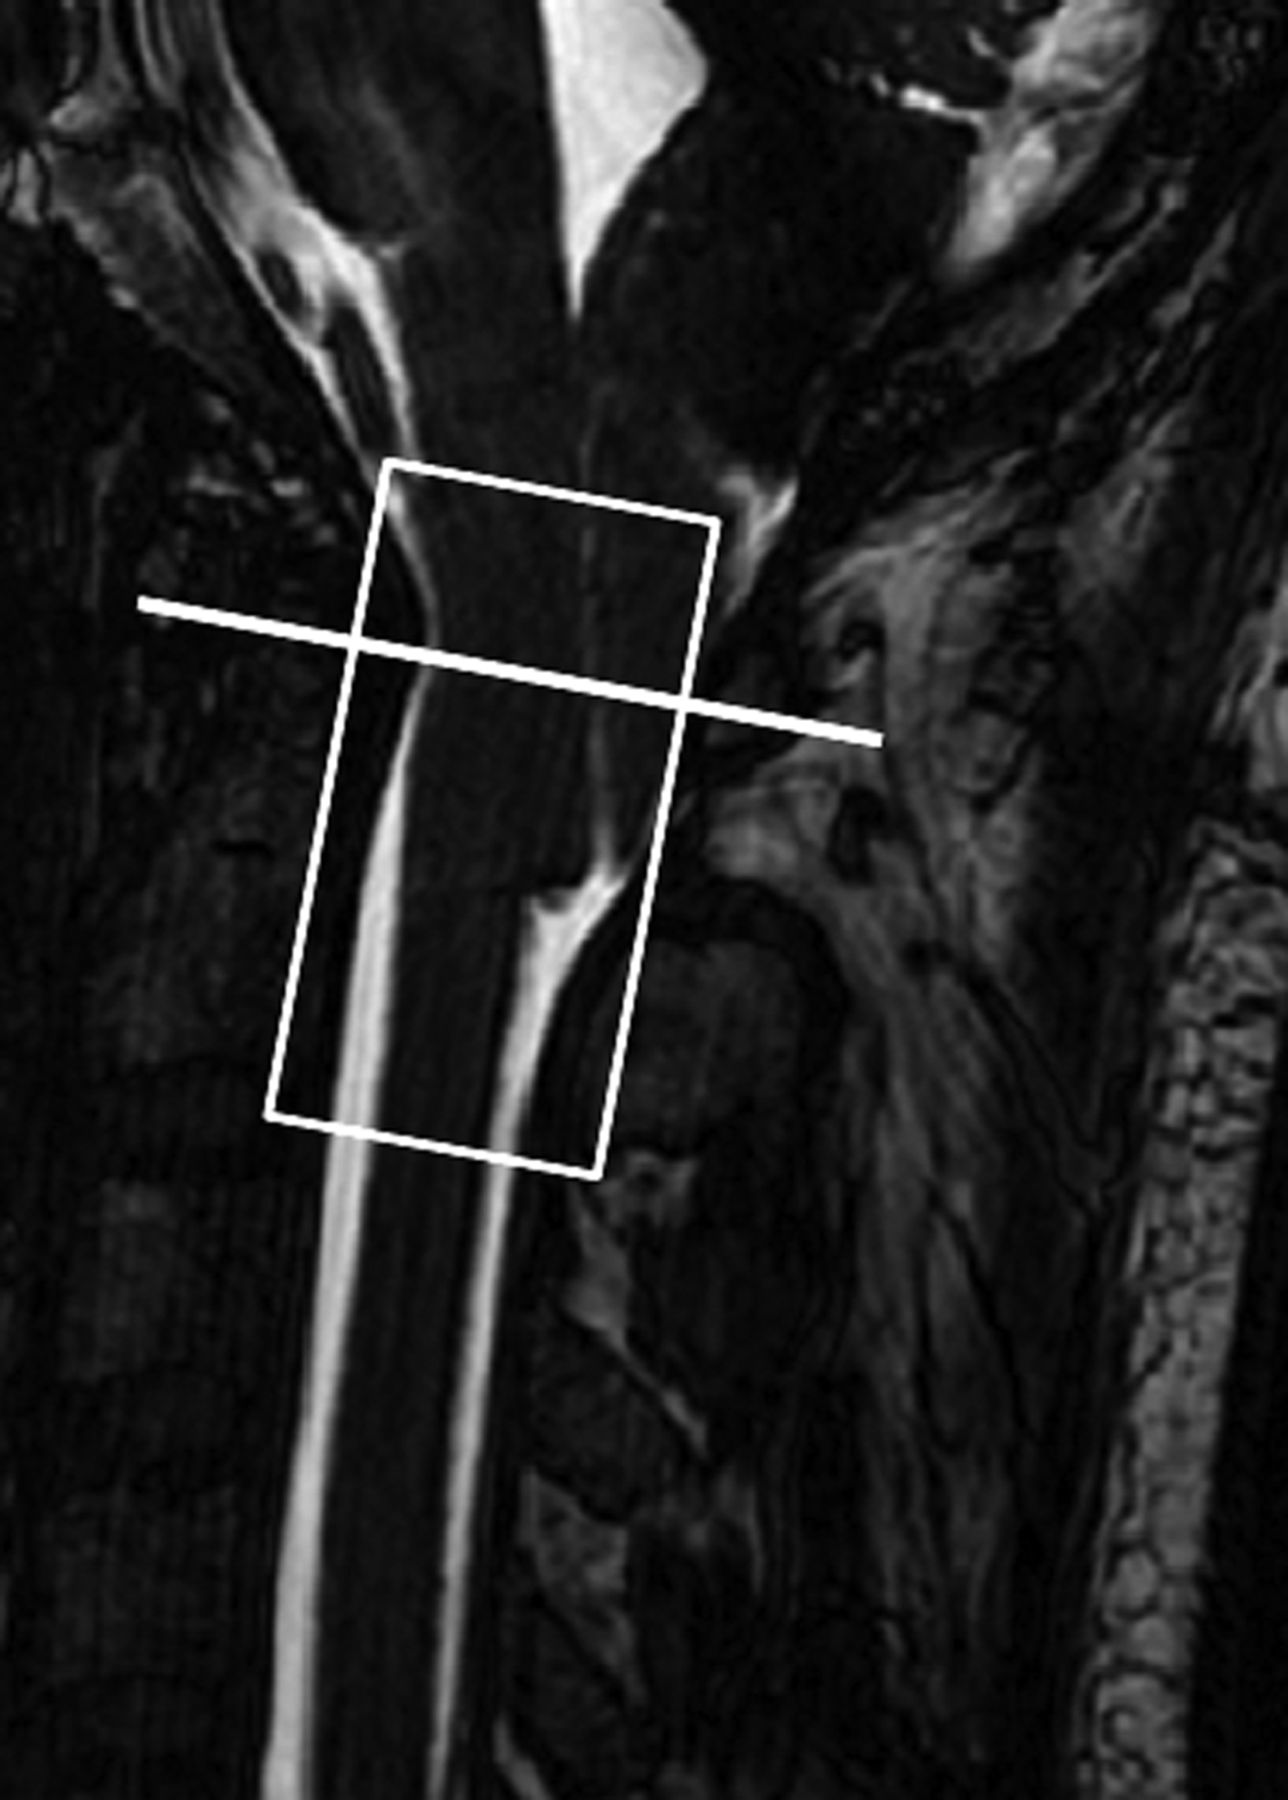
- Fig 2.
CSF flow waveforms from a healthy participant during a 5-second period: craniocaudal CSF flow (green) and caudocranial CSF flow (yellow). ACSF is shown in red; SVCSF is the average of absolute flow from yellow and green areas.
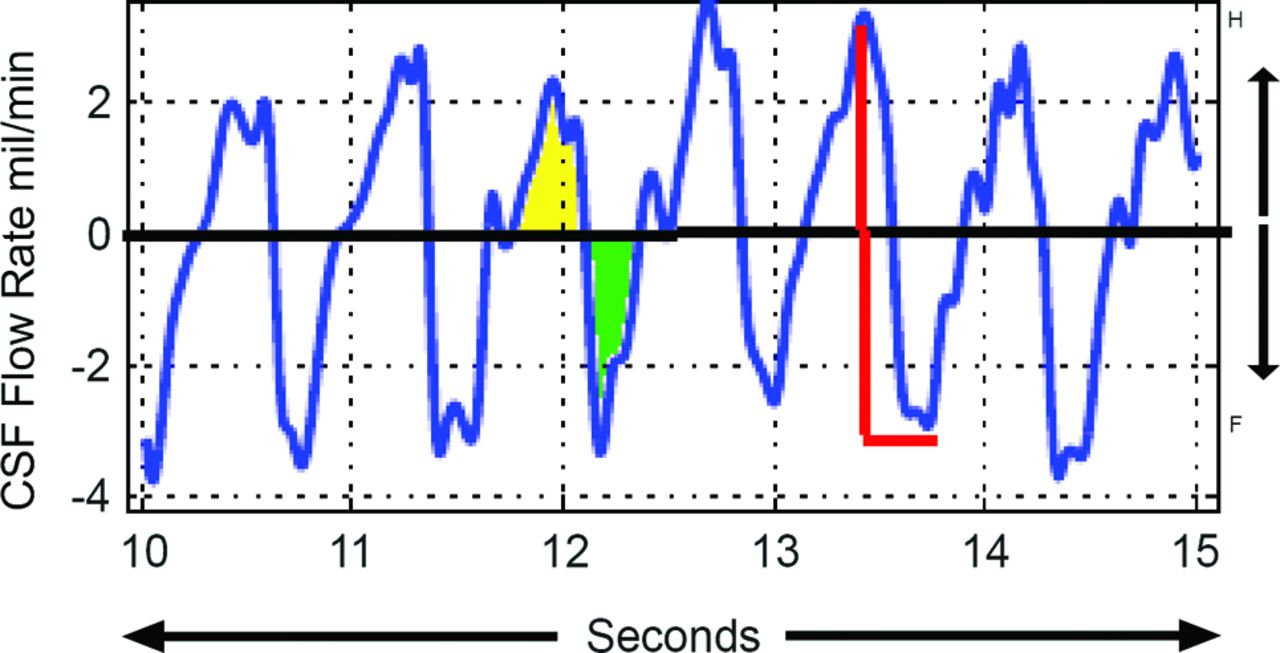
- Fig 3.
The effect of coughing on cardiac cycle–related CSF flow waveforms is seen in a patient with CMI (A) and a healthy participant (B). Left-to-right resting (blue), coughing (red), and immediate postcoughing (green) periods are seen. In the patient with CMI, the CSF flow-pulsation magnitude in the immediate postcoughing period decreases to ∼50% of the resting value before gradually returning to the resting level. In contrast, for the healthy participant, the CSF flow-pulsation magnitude immediately postcoughing is not significantly different compared with that of the resting period. X-axis indicates time in seconds; y-axis, CSF flow rate in milliliters per minute.
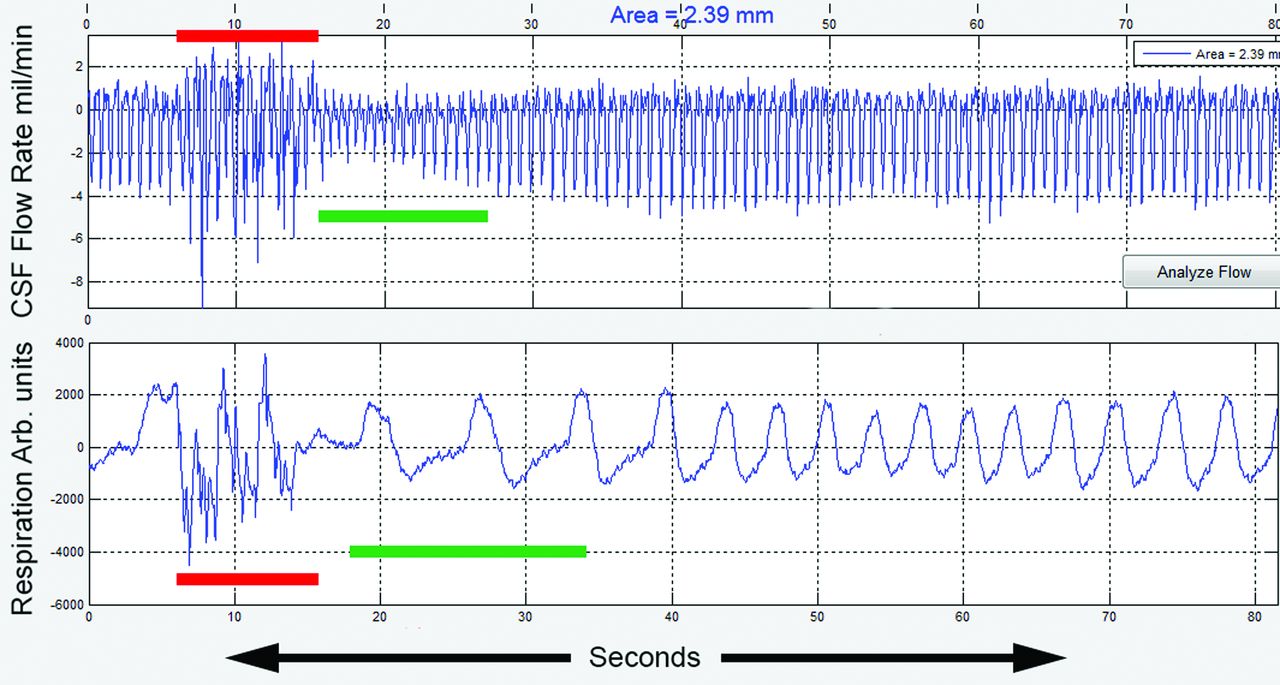
- Fig 4.
CSF flow waveforms (upper trace) and simultaneous recordings of respiratory motion (lower trace) in a patient with CMI (the patient is different from the one shown in Fig 3). The coughing period (red bar) is seen as irregular respiratory motion (lower trace) with almost simultaneous haphazard motion in the CSF flow waveform (upper trace). In the immediate postcoughing period, respiratory motion is regular but larger in magnitude (green bar). The decrease in CSF flow waveform magnitude is seen in the postcoughing period (green bar in the upper trace). CSF flow waveforms depict flow in milliliters per minute, and respiratory motion is recorded in arbitrary units (Arb). Mil indicates milliliters.


Tables
- Table 1:
CSF flow parameters in resting and after coughing in patients with CMI compared with healthy participantsa
CSF Flow Parameter Resting Postcough CMI (n = 8) Healthy (n = 6) P Value CMI (n = 8) Healthy (n = 6) P Value ACSF (mL/min) 3.85 ± 1.55 3.5 ± 1.9 NS 1.65 ± 1.01 3.95 ± 2.2 .007 SVCSF (mL) 0.38 ± 0.15 0.43 ± 0.21 NS 0.17 ± 0.11 0.37 ± 0.19 NS FRCSF (mL/min) 31.1 ± 14.1 30.1 ± 16.2 NS 16.5 ± 11.3 32.2 ± 21 NS Note:—NS indicates not significant.
↵a All values of CSF variables are shown as means. P values were assessed with the Mann-Whitney U test.
- Table 2:
Postcoughing CSF flow parameters expressed as a percentage of the resting value in patients with CMI and healthy participantsa
CSF Flow Variable (% of Resting) CMI (n = 8) Healthy Participants (n = 6) P Value ACSF 45.5 ± 16.8 114.7 ± 22.2 <.001 SVCSF 44.1 ± 14.9 83.3 ± 13.6 <.001 FRCSF 51.8 ± 16.9 106.5 ± 20.7 <.001 ↵a All values are shown as means. P values were assessed with the Mann-Whitney U test.


