
Abstract
SUMMARY: Measures of cerebral metabolism may be useful in the selection of patients for reperfusion therapies and as end points in clinical trials. However, there are currently no clinically routine techniques that provide such data directly. We review how imaging modalities in current clinical use may provide surrogate markers of metabolic activity. Promising techniques for metabolic imaging that are currently in the pipeline are reviewed.
ABBREVIATIONS:
- MR-COMI
- cerebral oxygen metabolic index
- CMRO2
- cerebral metabolic rate for oxygen
- OCI
- oxygen challenge imaging
- OEF
- oxygen extraction fraction
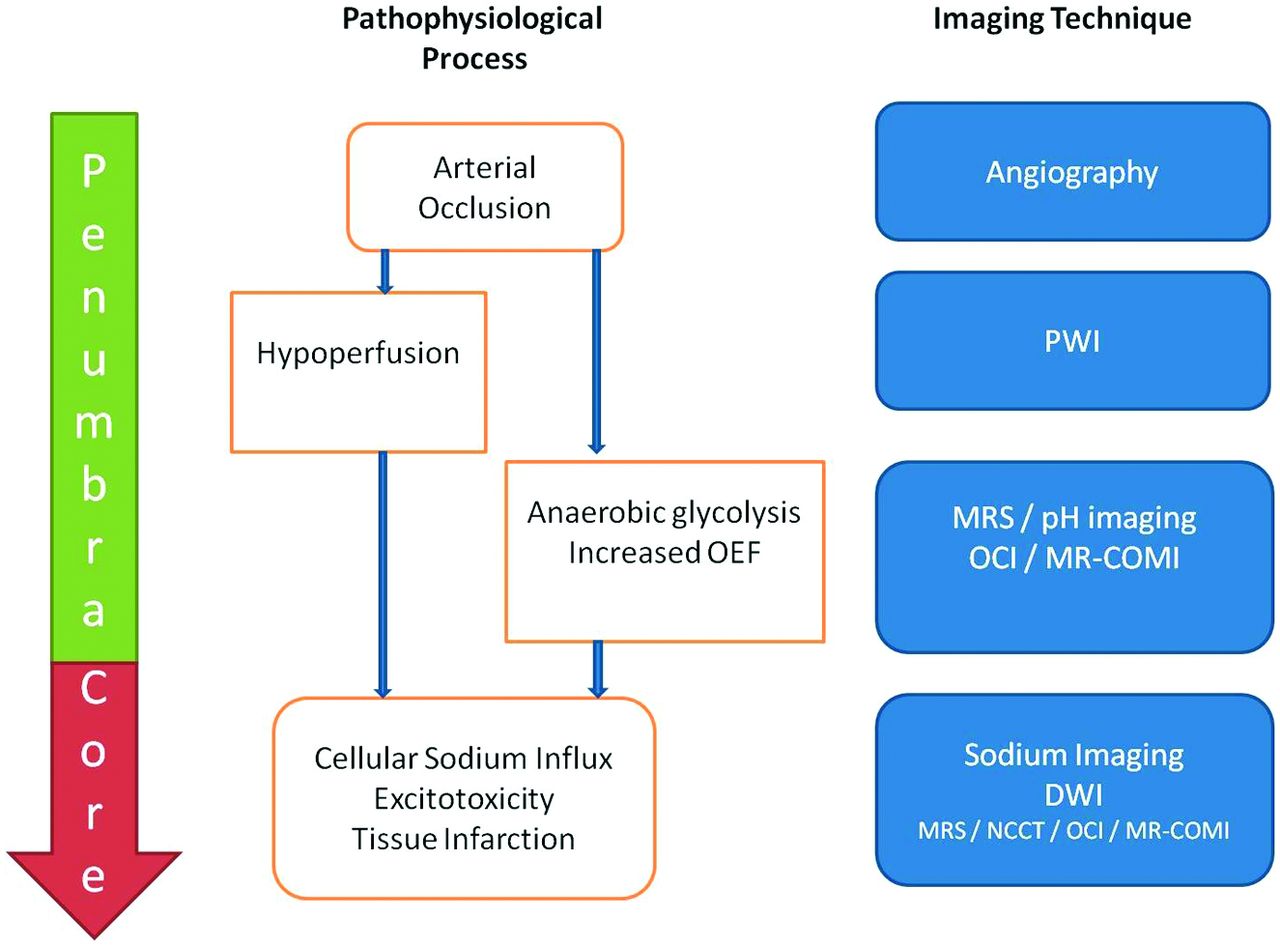
Over the past 2 decades, imaging markers that predict outcome after reperfusion therapies for acute ischemic stroke have continually been refined. Despite the promise offered by PWI and DWI MR studies to advance patient selection for reperfusion therapies beyond noncontrast CT, there remains a thirst to develop further techniques that may potentially provide more information about the cerebral pathophysiology of an individual patient. This may be achieved by targeting any one of the plethora of pathophysiologic consequences of stroke, the end point of which is reduced or absent metabolic activity. We review how measures of metabolic activity may be inferred from current and promising techniques (Fig 1).

Approach to metabolic imaging of acute stroke. On the left, the tissue compartments (penumbra/core) are delineated. In the middle, the pathophysiologic process is outlined. On the right, and aligned in the horizontal meridian, imaging techniques that may image the respective pathophysiologic process are documented.
Why Image Metabolism?
After arterial occlusion, CBF diminishes precipitously. However, tissue does not die immediately but enters a twilight state of electrical silence associated with maintained cerebral metabolic rate for oxygen (CMRO2)—the ischemic penumbra.1 The first adaptation to hypoperfusion is rapid dilation of the precapillary arterioles, which increases CBV. The next is an increase in the proportion of oxygen extracted from the blood (oxygen extraction fraction, OEF), which occurs concomitantly with a switch from aerobic to anaerobic metabolism. At the same time, however, a cascade of pathologic processes is set in motion including excitotoxicity, peri-infarct depolarization, oxidative stress, inflammation, and apoptosis. It is now appreciated that if there is reperfusion, tissue may be salvaged and infarction averted, and this is associated with clinical improvement.2 The NINDS trial3 was the first to show that reperfusion therapy with rtPA is beneficial when administered to patients with ischemic stroke presenting within a restricted time window, after NCCT has excluded major established infarction. However, there are a number of acknowledged limitations, including the small but significant risk of intracerebral hemorrhage after alteplase administration, the observation that not all patients benefit, and the increasing recognition that some patients beyond the current time window also have penumbral tissue.4 A goal of recent imaging developments has been to refine patient selection by not only identifying those patients with volumes of infarct core likely to predispose to hemorrhagic transformation but also by identifying those patients with large volumes of ischemic penumbra. The advanced imaging techniques that are the subject of most attention measure perfusion parameters (PWI) and cytotoxic edema (DWI). However, given that penumbra and core are defined by metabolic parameters, the ability to image metabolic activity directly may further aid patient selection for therapies. Ultimately, such imaging may be complementary to the use of the “time window” and PWI-DWI data. Metabolic imaging may also potentially guide future treatments in the subacute and chronic time periods and facilitate clinical trial end points.
PET: The Reference Standard
Although the use of PET in stroke remains a research tool, this technique deserves special mention because PET data have clarified important principles regarding stroke pathophysiology.15O multi-tracer PET can provide measures of not only CBV and CBF but also OEF and CMRO2. These PET techniques confirmed the presence of penumbral tissue in human acute ischemic stroke5 and facilitated the generation of operational PET criteria for penumbra identification characterized by a preserved CMRO2, elevated OEF, and a reduced CBF. Data from PET6 also cemented the concept of tissue compartments after stroke, with small volumes of core and large volumes of penumbra being the favored pattern for reperfusion. These concepts have influenced clinical trial design ever since.
Recently, other PET ligands that aim to avoid some of the practical difficulties associated with 15O multitracer PET have been investigated. These include radio-labeled flumazenil, which was reported to show decreased binding in irreversibly infarcted tissue,7 and radio-labeled fluoromisonidazole, which was reported to bind to viable but hypoxic tissue.8 However, recent rodent studies have challenged the specificity of binding to specific tissue compartments, and further investigation is required.9,10
What Do Current Routine Imaging Techniques Tell Us About Metabolism?
NCCT simply provides data through the use of x-rays, with tissue attenuation decreasing in regions of cytotoxic edema. Parenchymal hypoattenuation has been associated with tissue destined for infarction on PET11 and a “core” pattern of perfusion on CT perfusion imaging.12 In addition, sulcal effacement in the absence of hypoattenuation has been shown to be associated with elevated CBV, suggesting a “penumbral” perfusion pattern.12 However, it lacks sensitivity for early ischemic changes and for penumbra and cannot distinguish core from penumbra and from unaffected tissue in the hyperacute setting.
MR Imaging
DWI can detect subtle perturbations in the Brownian motion of water and is therefore more sensitive for cytotoxic edema than is CT. It is >80% sensitive for ischemic stroke,13 and lesions are often considered to represent infarct core. However, back-to-back studies of MR imaging and PET show some voxels within the DWI lesion fulfill the PET criteria for penumbra.14 Observations of DWI reversal after reperfusion further challenged the assumed equivalence of a DWI lesion to core.15 However, recent data show that whereas there can be some reversal of very early lesions on DWI, such reversal is rarely complete16 and a lesion on DWI provides a reasonable, if not perfect, measure of infarct core in the acute setting. DWI does not, however, provide measures of CMRO2 but rather provides a marker of cytotoxic edema occurring as a result of reduced CMRO2. Therefore it cannot, by itself, define features of the penumbra such as hypoperfusion or OEF changes.
FLAIR sequences are heavily T2-weighted sequences with nulling of signal from CSF. FLAIR sequences detect vasogenic edema associated with established infarction. Because they are not sensitive to early cytotoxic edema, these sequences are inferior to DWI for the detection of acute stroke lesions and do not define core in the first hours after stroke onset. Pilot studies suggest that stroke lesions that carry a DWI-positive–FLAIR-negative signature are highly specific for the prediction of being <3 hours since onset,17 and the WAKE UP18 and MR WITNESS (www.clinicaltrials.gov) trials are underway to evaluate whether this imaging pattern may predict response to treatment in wake-up strokes. However, this imaging pattern aims to provide a surrogate marker of time rather than penumbra, and therefore FLAIR cannot provide direct measures of metabolic activity in the hyperacute setting.
A detailed critique of the use of PWI in acute ischemic stroke is beyond the scope of this article. Nonetheless, a number of key points should be noted. PWI data describe a dynamic signal intensity reflecting the perfusion of the tissue, including measures of CBF and CBV. Most studies have investigated MR-based PWI and have focused on regions with a larger PWI deficit compared with DWI deficit as being potentially salvageable—the PWI-DWI mismatch.19 Initial studies used a variety of methodologies20 and definitions21 for this mismatch, but the field is rapidly converging to agreement on the optimal imaging parameters that define this mismatch.22 It should be noted that CT perfusion may also be used to define tissue compartments using measures of hypoperfusion to define both penumbra and core.23 Although the explicit aim of the use of such patterns is to identify imaging signatures of favorable response to reperfusion therapy, the implication is that patterns that predict a good response to reperfusion therapy have small volumes of core and large volumes of penumbra. Therefore, although the use of perfusion based measures does not define metabolic activity, they very clearly aim to identify different metabolic compartments. However, even though ongoing clinical trials may prove the clinical utility of such techniques, there will still be unanswered questions. For example, should all strictly defined PWI-DWI mismatch regions be considered equally or could metabolic imaging techniques further refine patient selection for treatment? For those with a matched PWI-DWI deficit, which (if any) patients will respond to reperfusion therapies within the time window?
The following sections discuss imaging techniques that may answer some of these questions.
What Are the Emerging Metabolic Imaging Research Techniques?
Proton MR Spectroscopy.
MRS can be performed for in vivo human brain studies to measure metabolite concentrations derived from prespecified brain regions. Several nuclei can be studied, but because of their high concentration,1 H nuclei (proton MRS) have been the focus. There are potentially a large number of metabolites that may be studied. However, for practical reasons, most studies have evaluated the concentrations of 4 main metabolites. NAA may be considered to be a marker of neuronal integrity, total creatine a marker of energy metabolism, choline a cell membrane marker, and lactate a marker of anaerobic glycolysis. The time course of metabolite concentration after stroke has been well characterized.24,25 After acute ischemic stroke, NAA falls within the first hour after arterial occlusion and continued decline is seen for up to 1 week after ictus. Creatine levels also fall after stroke, but changes in choline concentrations are more variable. Lactate concentration rises within minutes after stroke, and concentrations gradually decline after reperfusion.
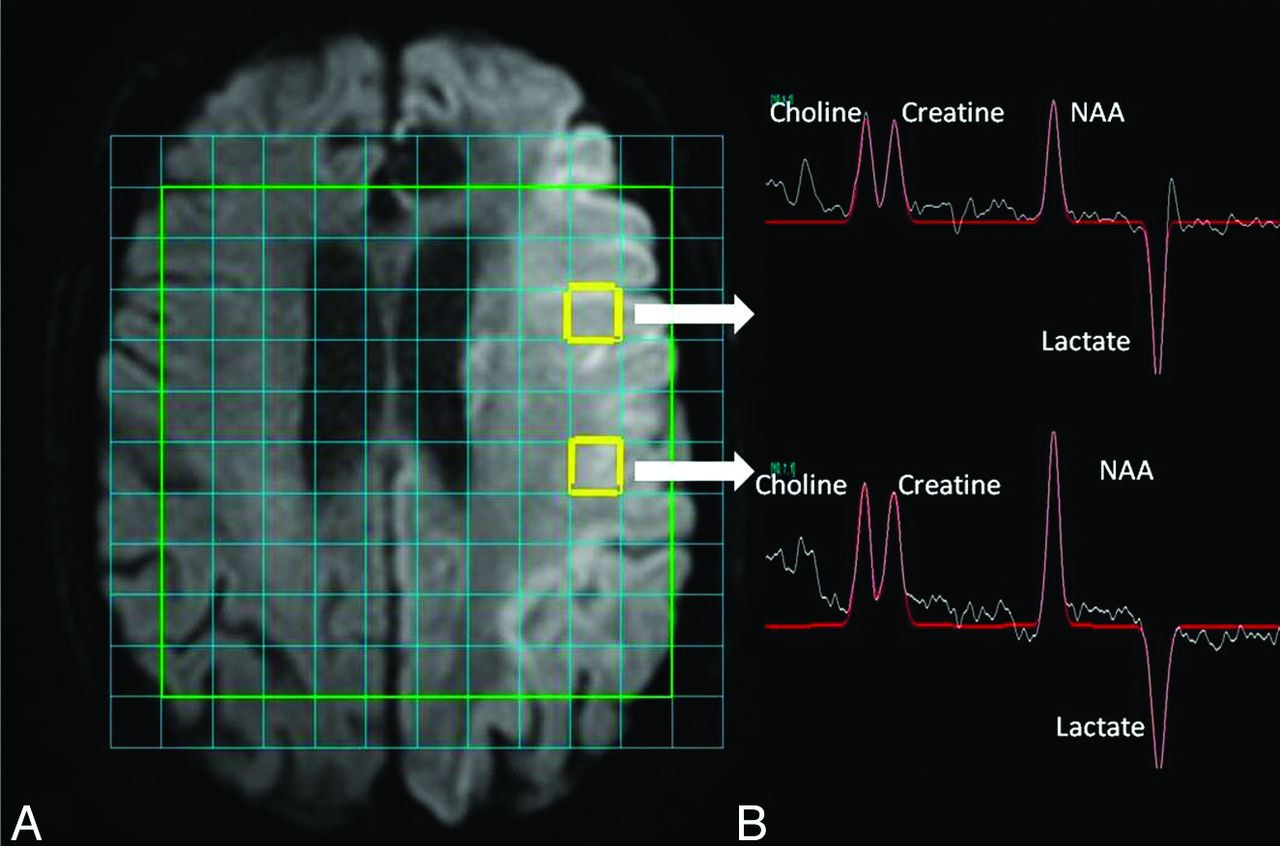
One of the key questions of this technique is, can it provide useful data compared with current MR techniques? There are signals in the literature that at least some of the metabolite concentrations may already be reflected by the routine stroke protocol MR. NAA concentrations in “possibly abnormal” voxels on DWI are higher than those in “definitely abnormal” voxels.26 Higher concentrations of lactate are seen in the DWI lesion compared with the PWI-DWI mismatch region.27 Indeed, up to 41% of the variance of the metabolite concentration was predicted by the routine stroke protocol MR.28 However, although some of the remainder of the unaccounted variance may have been caused by “noise,” it is likely that current MR protocols cannot provide us with as full a picture of metabolic activity as does MR spectroscopy. Indeed, we reported a case in which MRS demonstrated preserved NAA concentration with elevated lactate concentration in a DWI-negative patient imaged early after stroke, in a region that later further partially infarcted.28 However, the sensitivity of the identification of the “preserved NAA and elevated lactate” profile for the identification of penumbral tissue was questioned in that study. If lactate sensitivity can be optimized, however, identification of raised lactate that reverses with transient hyperoxia may be another route by which potentially salvageable tissue may be identified.27,29 MRS may also be able to show differences in neuronal integrity across a DWI lesion (Fig 2).

Data from MRS. A, Acute stroke lesion of the left hemisphere on DWI. There is a multi-voxel spectroscopy grid overlaid onto the time. Users can select data from any voxel. The 2 voxels highlighted in yellow show the regions from which spectroscopy data were derived and are illustrated in on the right-hand side. B, Spectroscopy data for the 4 major metabolites that are annotated. NAA appears low, and lactate concentration is elevated. Area under the peaks indicates relative metabolite concentration. Although the lesion on DWI appears relatively uniform throughout, the NAA concentration is less in the anteriorly placed voxel compared with the posteriorly placed voxel.
A number of limitations have been identified with the use of a clinically applicable MRS sequence in acute ischemic stroke. The technique has a low SNR, and shortening the sequence duration in acute stroke further compounds these problems. Moreover, movement of patients with acute stroke will increase the chances of lipid contamination of signal.
Despite these limitations, MRS may still find a niche, and this may include its use in clinical trials. For example, our recent description of the detection of elevated levels of reduced glutathione in a small number of patients with subacute stroke suggests that a repeatable in vivo marker of oxidative stress in stroke is now available.30 This could be used to confirm a tissue effect from investigational medicinal products in clinical trials as a surrogate marker of outcome.
17O Imaging.
Although most MRS studies have exploited proton nuclei, some studies have focused on oxygen nuclei. Unlike the more abundant 16O, 17O has MR visibility. Although it is naturally occurring, it is present in very low concentrations in human tissue. 17O may be detected directly by use of MRS or indirectly by detecting 17O-labeled water by exploiting the principle of coupling between protons and 17O by use of spin-echo MR images, both after 17O inhaled gas. The MR visibility makes assessment of results fairly straightforward because 17O is only detectable when oxidative metabolism is complete and H2 17O is produced. Therefore, confounds by signal from oxygen at other stages in the metabolic pathway are avoided. CMRO2 may be calculated if the perfusion-related clearance rate of water and recirculation characteristics are considered. In addition, Zhu et al31 have recently shown that the technique may also be used to determine CBF. The direction of changes in CMRO2, CBF, and OEF reported from PET studies after stroke has also been described in a recent murine study by use of 17O imaging.32 Human imaging by use of 17O has been shown to be safe33 and the production of CMRO2 maps to be feasible in human volunteers.34 Remaining limitations for the translation of this technique into humans include the different kinetics of 17O in humans compared with small animals and the requirement for high field strengths to optimize signal. Therefore, human studies remain limited.
Sodium Imaging.
It is well established that as adenosine triphosphate generation becomes insufficient to maintain cellular sodium-potassium adenosine triphosphatase pumps after ischemic stroke, there is influx of sodium into cells. Imaging tissue sodium therefore provides an attractive potential surrogate marker of sodium-potassium adenosine triphosphatase pump dysfunction that occurs in infarct core. Although the SNR of sodium imaging techniques is low, the production of image maps of sodium intensity is now feasible. A number of animal studies have confirmed an increase in brain tissue sodium concentration occurring after stroke35⇓–37 by use of field strengths of between 3T and 9.4T. Hussain et al38 imaged 21 patients with stroke and demonstrated that in the first 7 hours, there was only a very modest increase in tissue sodium (<10%), but this increased more rapidly after 7 hours and plateaued at 48 hours. The authors postulated that sodium imaging may be used as a tissue clock, with potential utility for evaluation of wake-up strokes. A further study confirmed that there were no sodium changes in the PWI-DWI mismatch region.39 Moreover, unlike the ADC derived from DWI, which was statically low over the first few days of infarction, sodium intensity steadily increased through this time. This suggests that sodium imaging may provide additional information in comparison to DWI, even though both are measures of cytotoxic edema. The study authors postulated that a potential niche for sodium may be in patient selection for reperfusion therapies, whereby the optimal imaging profile might be a PWI-DWI mismatch without any significant changes seen on sodium imaging.
Although it is an intriguing proposition, there are a number of potentially significant barriers to the widespread adoption of this technique. First, although feasible on 3T machines, higher field strengths would be advantageous, and these are not clinically routine at present. Second, low SNR also necessitates long imaging times. Third, it is still far from clear the additional clinical utility sodium imaging would provide. Studies of DWI-FLAIR mismatch to provide a “tissue clock” are well underway, and these imaging techniques are already part of the stroke MR protocol. Perhaps sodium imaging may further refine the definition of core and distinguish regions of DWI lesions that are penumbral and are already core.
T2*-Weighted MR Imaging.
The ability of PET to measure both CMRO2 and OEF simultaneously, in addition to providing measures of CBF and CBV, has ensured its status as the reference standard research metabolic imaging technique. Recently, attention has been paid to MR images sensitive to deoxyhemoglobin, because its concentration in the cerebral venous circulation changes as OEF varies in the presence of maintained CMRO2. T2*WI sequences are sensitive to magnetic susceptibility differences between blood and tissue parenchyma created by paramagnetic substances present in the tissue microcirculation, of which deoxyhemoglobin is one. As OEF and therefore venous deoxyhemoglobin increases in the penumbra, one would expect parenchyma and venous structures to appear dark. Indeed, Morita et al40 reported such findings on T2*WI gradient-echo sequences, which are routinely used to detect intracerebral hemorrhage. Similar findings have been reported on precontrast T2*-weighted PWI sequences in human and rodent studies.41,42 However, in a study that measured T2′ (T2* corrected for spin-spin effects), although differences in signal between core, penumbra, and healthy tissue were noted, wide confidence intervals precluded the determination of discriminative thresholds.43 Indeed, back-to-back PET and MR studies failed to confirm a correlation between T2*WI signal intensity on precontrast T2*-weighted PWI and OEF measures derived from PET imaging.44 This may be in part due to the fact that T2*WI signal is influenced by a number of factors including the increase in T2*WI signal occurring a number of hours after onset of stroke caused by vasogenic edema.
Owing to the limitations of static measures of T2WI or T2*WI signal intensity to provide measures of metabolic activity, other MR imaging measures have been investigated, including oxygen challenge imaging (OCI) and also potentially quantitative measures of CMRO2.
Oxygen Challenge Imaging.
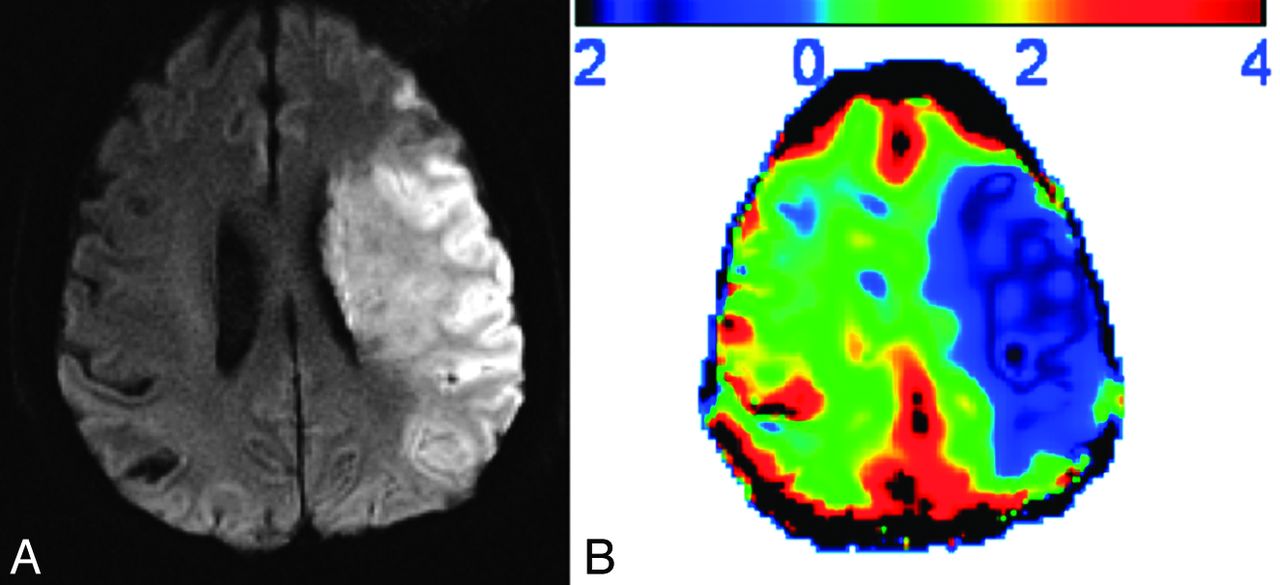
OCI uses transient hyperoxia during T2*-weighted MR images to demonstrate dynamic changes in deoxyhemoglobin concentration. The hypothesis of the technique is that in healthy actively metabolizing tissue in which the OEF is approximately 0.3–0.4, supplementary oxygen will aid the conversion of cerebral venous deoxyhemoglobin to oxyhemoglobin, which will be associated with a T2*WI signal intensity increase. In the penumbra, in which one would expect an increase in CBV, OEF, and therefore deoxyhemoglobin, an exaggerated increase in T2*WI signal intensity would be expected. In contrast, in infarct core, one would expect a diminished or absent response to OCI. Santosh et al45 confirmed these results in a rat model of MCA occlusion. With the use of [14C] 2-deoxyglucose autoradiography, the group subsequently showed preserved metabolic activity in the T2*WI signal–defined penumbra, and the exaggerated T2*WI signal was seen to normalize after reperfusion, consistent with the underlying hypothesis of the technique.46,47 Rodent studies by another group48 showed that the region of exaggerated OCI response was larger than the PWI-DWI mismatch region, suggesting that the technique may also be able to detect potentially salvageable tissue within the DWI lesion. A pilot human study was broadly consistent with the results from animal studies49 with diminished OCI response in DWI lesions (Fig 3). Unfortunately, small volumes of PWI-DWI mismatch in small numbers of subjects did not allow statistically significant proof of exaggerated OCI penumbral response, though some encouraging patterns were described.

An example of oxygen challenge imaging. A, Stroke lesion of the left hemisphere on DWI from a subject last seen well approximately 24 hours before imaging. B, Results from oxygen challenge imaging. The percentage change in T2*WI signal is indicated in the scale bar at the top (positive results indicate an increase in signal; negative results a decrease in signal). There is a diminished response to oxygen challenge in regions corresponding to the established lesion on DWI, suggesting a core pattern.
Although studies of OCI are still at an early stage, further validation studies are required to answer remaining questions. For example, are different oxygen concentrations required to image different tissue compartments? Does impaired vascular autoregulation affect results in humans? Which thresholds distinguish tissue compartments?
MR Measures of CMRO2.
Whereas some groups have investigated T2*WI sequences by use of the oxygen challenge technique, others have modeled either the T2WI or T2*WI signal to calculate metabolic parameters. By exploiting the “static dephasing regime” of Yablonskiy and Haake,50 which states that above a particular echo time a component of the T2*WI signal becomes dependent on OEF, the magnetic susceptibility of blood, venous CBV, hematocrit, and static magnetic field, An and Lin51 used a multiecho gradient and spin-echo sequence to provide measures of cerebral venous oxygen saturation and OEF. This measure can be combined with CBF measures to calculate the MR equivalent of CMRO2—the cerebral metabolic oxygen index (MR COMI). The group has since validated their findings in animals and healthy volunteers, and in general results have been consistent with the PET literature. The first stroke study was completed a decade ago,52 and in 7 patients imaged after an average of 7.5 hours post ictus, the putative core showed a diminished MR imaging–COMI value, as expected. The group has recently described 41 patients with stroke with baseline imaging at 3 hours post ictus and defined MR-COMI thresholds to predict the inner and outer border of the ischemic penumbra,53 with encouraging results. Although optimistic, the authors concluded that a large multicenter study is required to determine the clinical utility of these sequences.
pH Imaging.
Significant hypoperfusion precipitates a switch from aerobic to anaerobic metabolism with subsequent lactate production. One of the limitations of MRS for the detection of lactate is the limited spatial resolution, even with multivoxel MRS. Therefore, in an effort to identify the ischemic penumbra, other modalities to identify the tissue that has switched to anaerobic glycolysis have been investigated. Chemical exchange processes between amide protons of cellular peptides and proteins occurs in a pH-dependent fashion, and methods for detecting this chemical exchange have already been developed54: chemical exchange saturation transfer. Zhou et al55 coined the term amide proton transfer to describe the chemical exchange saturation transfer effect between water and protons. Given that amide proton transfer is pH dependent, measures of amide proton transfer may aid the measurement of pH. Most studies investigating this have been performed in rodents. Initial studies demonstrated the feasibility of detecting a reduced pH in the ischemic hemisphere,55 and subsequent studies have illustrated a number of features of lesions on pH-weighted imaging that are consistent with penumbra. First, a strong correlation between tissue pH and lactate concentration has been observed.56 Next, the abnormalities precede lesions on ADC and are bigger or equal to the volume of ADC lesions but smaller or equal to the volume of perfusion deficits in all rats. Finally, regions with reduced pH proceeded to infarction.57 These data suggest that the use of pH imaging may help to define the ischemic penumbra whereby hypoperfused tissue with normal ADC and pH represents benign oligemia, and hypoperfused tissue with normal ADC and low pH may represent ischemic penumbra. A further study evaluated multimodal MR, including pH imaging, in a rodent model of stroke to predict tissue outcome.58 The authors concluded that the addition of pH-weighted imaging data to a model to predict tissue outcome was superior to the use of PWI-DWI data alone.
The use of pH-weighted imaging in human data has so far been scarce, largely slowed by technical complexities in the translation of this technique to humans. However, study of a small number of volunteers and patients with stroke has confirmed the feasibility of this technique at 3T, in addition to the ability to detect low tissue pH in the stroke region.59
Conclusions
Imaging techniques included in current multimodal CT and MR protocols provide a wealth of information, including providing surrogate markers of metabolic activity. An immediate goal is to gain better understanding of how to use these techniques to make therapeutic decisions—several studies are ongoing in this regard. There are many techniques that are at an earlier stage of investigation for imaging penumbra and core (Figs 4 and 5); we have discussed some but not all of these here and have not discussed techniques which aim to image other processes such as inflammation. While promising, the emerging metabolic imaging techniques require substantial validation to determine how they would fit into current imaging protocols and precisely what information can be added that cannot already be inferred from existing techniques. Many of these will require technical improvements before being feasible for use in hyperacute stroke. Despite many uncertainties surrounding these novel techniques, there is one thing for certain: we will see plenty more studies over the next few years.

Current and potential markers of core. A, MR images of DWI (right) and FLAIR image (left) showing extensive established infarct core; B, list of potential imaging profiles that may refine definitions of core. OCI indicates oxygen challenge imaging; MR-COMI, MR cerebral oxygen metabolic index; CMRO2, cerebral metabolic rate for oxygen.

Current and potential markers of penumbra. A, MR images of DWI (right) and PWI (left) showing a region of PWI-DWI mismatch; B, list of potential imaging profiles that may refine definitions of penumbra. OCI indicates oxygen challenge imaging; MR-COMI, MR cerebral oxygen metabolic index; CMRO2, cerebral metabolic rate for oxygen.
Footnotes
Disclosures: Krishna Dani—UNRELATED: Grants/Grants Pending: Chief Scientists Office Scotland,* Neurosciences Foundation Glasgow,* Stroke Association,* National Health Service UK (NHS)* endowment funds, Comments: Numerous unrelated grants in the field of neuroimaging; Payment for Development of Educational Presentations: Later Life Learning, Comments: Basics of Stroke; OTHER RELATIONSHIPS: I am currently involved in studies of metabolic imaging.
Indicates open access to non-subscribers at www.ajnr.org
References
- Received August 8, 2013.
- Accepted after revision August 27, 2013.
- © 2014 by American Journal of Neuroradiology


