
Abstract
BACKGROUND AND PURPOSE: The characterization of peripheral nerve sheath tumors is challenging. The purpose here was to investigate the diagnostic value of quantitative proton MR spectroscopy at 3T for the characterization of peripheral nerve sheath tumors as benign or malignant, compared with PET.
MATERIALS AND METHODS: Twenty participants with 24 peripheral nerve sheath tumors underwent MR spectroscopy by use of a point-resolved sequence (TE, 135 ms). Six voxels were placed in 4 histologically proven malignant peripheral nerve sheath tumors and 22 voxels in 20 benign peripheral nerve sheath tumors (9 histologically proven, 11 with documented stability). The presence or absence of a trimethylamine signal was evaluated, the trimethylamine concentration estimated by use of phantom replacement methodology, and the trimethylamine fraction relative to Cr measured. MR spectroscopy results for benign and malignant peripheral nerve sheath tumors were compared by use of a Mann-Whitney test, and concordance or discordance with PET findings was recorded.
RESULTS: In all malignant tumors and in 9 of 18 benign peripheral nerve sheath tumors, a trimethylamine peak was detected, offering the presence of trimethylamine as a sensitive (100%), but not specific (50%), marker of malignant disease. Trimethylamine concentrations (2.2 ± 2.8 vs 6.6 ± 5.8 institutional units; P < .049) and the trimethylamine fraction (27 ± 42 vs 88 ± 22%; P < .012) were lower in benign than malignant peripheral nerve sheath tumors. A trimethylamine fraction threshold of 50% resulted in 100% sensitivity (95% CI, 58.0%–100%) and 72.2% (95% CI, 59.5%–75%) specificity for distinguishing benign from malignant disease. MR spectroscopy and PET results were concordant in 12 of 16 cases, (2 false-positive results for MR spectroscopy and PET each).
CONCLUSIONS: Quantitative measurement of trimethylamine concentration by use of MR spectroscopy is feasible in peripheral nerve sheath tumors and shows promise as a method for the differentiation of benign and malignant lesions. Trimethylamine presence within a peripheral nerve sheath tumor is a sensitive marker of malignant disease, but quantitative measurement of trimethylamine content is required to improve specificity.
ABBREVIATIONS:
- MPNST
- malignant peripheral nerve sheath tumor
- NF-1
- neurofibromatosis type 1
- PNST
- peripheral nerve sheath tumor
- SUV
- standard uptake values
- TMA
- trimethylamine
Peripheral nerve sheath tumors (PNSTs) are commonly encountered in the general population, and most PNSTs are benign schwannomas and neurofibromas, rather than malignant peripheral nerve sheath tumors (MPNSTs).1⇓–3 However, the characterization of PNSTs by anatomic imaging methods and clinical features is challenging, given that the features of various benign tumors are shared,4 and the features of benign PNSTs and MPNSTs overlap. Recent literature suggests some specific anatomic imaging features with MR imaging5⇓⇓–8 and specific metabolic imaging features with PET9⇓⇓⇓–13 to be associated with malignant disease in PNSTs. Yet, noninvasive characterization of malignant disease remains problematic, especially in patients with neurofibromatosis type 1 (NF-1), who may have both benign and malignant tumors simultaneously and have greater risk for the development of MPNSTs than the general population.7 Proton MR spectroscopy has been used extensively to characterize brain tumors, but far less has been done to evaluate musculoskeletal lesions with MR spectroscopy14 and, specifically, PNSTs.15⇓⇓–18 The detection of a signal from trimethylamine (TMA) and choline-containing compounds by MR spectroscopy has been established as a valuable indicator of malignant disease in other musculoskeletal lesions from alterations in the metabolism of phosphocholine and phosphatidylcholine.16⇓⇓⇓⇓⇓⇓–23
We hypothesized that MPNSTs would show high TMA content but that benign PNSTs would show undetectable or low levels of TMA when quantified. This study investigates the feasibility of performing quantitative MR spectroscopy in PNSTs and assesses the differential TMA measures of benign and MPNSTs, particularly in patients with NF-1. TMA measurements were also assessed between benign schwannomas and neurofibromas, given prior reports that these entities may have different metabolic profiles by FDG-PET imaging.24 Finally, we compared MR spectroscopy measurements with the FDG-PET results in a subset of patients who underwent PET imaging as part of their routine clinical evaluation.
Materials and Methods
Study Design
This study was approved by the Institutional Review Board, and informed consent was obtained from each participant. Twenty participants with 24 PNSTs (histologically proven, or with clinical presentation and longitudinal imaging features consistent with neurofibroma in patients with NF-1 or schwannomas in patients with schwannomatosis) underwent MR imaging and quantitative proton MR spectroscopy at 3T. Two observers reviewed the MR imaging and MR spectroscopy data for each tumor. TMA measurements were compared between benign and MPNSTs, as well as among benign PNSTs, to determine the diagnostic performance of MR spectroscopy for the characterization of PNSTs. TMA content was also compared with maximal standard uptake values (SUVmax) when FDG-PET scans were available.
Patient Population
Research was performed at a tertiary care center having a comprehensive neurofibromatosis center and specialized care for patients with PNSTs. Participants were prospectively enrolled between August 2009 and April 2012, in a nonconsecutive manner. Inclusion criteria consisted of patients with suspected or known PNSTs with available histologic confirmation; patients with a documented history of NF-1, neurofibromatosis type 2, or schwannomatosis (diagnosed by clinical criteria and with genetic confirmation when available) with stable peripheral nerve tumors, and target lesions > 1 × 1 × 1 cm3; and patients with no contraindication for MR imaging. Exclusion criteria were a contraindication for MR imaging, prior treatment for the PNST, or PNSTs with no subsequent histologic confirmation or definitive follow-up.
Patient medical records were reviewed for demographics, underlying diagnoses, and history of prior therapies to identify inclusion and exclusion criteria. Patient records were also reviewed to determine if FDG-PET imaging was performed as part of the patients' routine clinical care within 1 month of the MR spectroscopy examination, to assess the agreement of MR spectroscopy findings with FDG-PET.
Lesions were classified as malignant after surgical resection (4 MPNSTs with 6 voxel locations; 1 participant had a very large MPNST in which 3 single voxels were placed). Lesions were classified as benign neurofibromas if they had either histologic confirmation (3 histologically confirmed neurofibromas; in 2 of these cases, 2 MR spectroscopy voxels were located within the neurofibroma), or if the patient had a documented history of NF-1 and a stable clinical and imaging appearance consistent with neurofibroma (stable on follow-up evaluation between 5 and 7 months). Lesions were classified as benign schwannomas if the patient had either histologic confirmation (6 histologically proven schwannomas) or a documented history of schwannomatosis and a stable clinical and imaging appearance consistent with schwannoma (1 schwannoma stable for 18 months).
Imaging and MR Spectroscopy Acquisition
All studies were performed on a 3T MR system (Magnetom Trio or Magnetom Verio; Siemens, Erlangen, Germany) by use of a flexible phased-array body-matrix coil. Axial fat-suppressed T2-weighted images (spin echo: TR, 2886 ms; TE, 100 ms; FOV, 18; section thickness, 6 mm) and coronal STIR images (inversion recovery: TR, 2462 ms; TE, 100 ms; TI, 200 ms; FOV, 20; section thickness, 6 mm) of the body part in question were performed.
After the anatomic imaging was performed, water-suppressed MR spectroscopy was performed by use of a single-voxel point-resolved spectroscopy sequence (CHESS water suppression, 128 averages; TR, 2000 ms; TE, 135 ms; scan time, 4 minutes 16 seconds). The voxel size and location were determined by a radiologist to encompass most of the lesion, with careful attention to exclude structures outside the perimeter of the lesion, including adjacent bone cortex, muscle, and vascular structures. The range of voxel sizes used varied from 1–25 cm3. For the estimation of TMA concentrations, a phantom replacement technique was used; signals from the lesion were compared with those from a 20-mmol/L solution of TMA recorded separately. To account for the different radiofrequency coil loading between the phantom and in vivo, the water signal was also recorded (without suppression, 16 averages) from the localized volume by use of transmit body coil receive and phased-array receive, as described previously.25,26 No lipid suppression was applied. Shimming up to second order was performed to optimize the field homogeneity by a physicist with 8 years of experience. In 2 PNSTs, spectra were recorded by use of multivoxel MR spectroscopic imaging once it became available, with the same acquisition parameters, except that the nominal voxel size was smaller (1 cm3, FOV of 16 cm, and 16 × 16 phase-encoding steps, 1 signal average, scan time 7 minutes 40 seconds).
MR Spectroscopy Data Processing
Spectra were analyzed by a physicist with 8 years of experience in MR spectroscopy and a radiologist with 9 years of experience in MR spectroscopy and 11 years of experience in imaging of musculoskeletal tumors, in consensus. The quality of the spectra was determined by the visibility of discrete TMA and Cr peaks, the degree of separation of the peaks, and the presence or absence of artifacts. The signals evaluated included water (4.7 ppm), lipid (1.3 and 0.9 ppm), TMA (3.2 ppm), and Cr (3.0 ppm). Before analysis, each spectrum was judged for sufficient quality subjectively; if it had resolved TMA, Cr, water, and lipid peaks with no uncorrectable baseline distortions; and the absence of artifacts that might interfere with the TMA or Cr peak measurements. The presence or absence of a TMA peak was noted based on visual assessment.
Analysis of the spectra was performed by use of the “advanced method for accurate, robust, efficient spectral fitting” routine (AMARES)12 in the “java-based Magnetic Resonance User's Interface” (jMRUI; www.mrui.uab.es/mrui/mrui_download/) package,13 which fits the time-domain spectroscopy data as a model of exponentially decaying oscillators by use of a nonlinear least-squares algorithm. TMA and Cr concentrations were estimated by use of the phantom replacement method,25,26 modified from previous use in normal skeletal muscle.27 Metabolite concentrations were estimated by use of the formula:
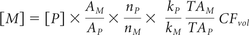 where M and P subscripts represent the in vivo (metabolite, M) and phantom (P) scans, respectively. [M] is the estimated in vivo (TMA or Cr) molar concentrations in “institutional units” (i.u.), [P] is the known (molar) concentration of the phantom, A represents the spectral peak area, n represents the number of protons in the molecular functional group (n=9 for TMA, n=3 for Cr), k is a term correcting for T1 and T2 relaxation times, TA is the radiofrequency transmitter amplitude (voltage) required for a 90° pulse in the phantom (P) and in vivo (M) MR spectroscopy acquisitions collection, and CFvol is a correction factor for the relative presence of water and fat within the voxel. T1 and T2 relaxation times were taken from the literature.28 Please see the On-line Appendix for additional information.
PET Imaging
Eight patients, 7 having NF-1 and 1 having schwannomatosis, had FDG-PET scans available for comparison. All but 1 FDG-PET study was performed with early and delayed acquisitions, as described previously,11,13 at the same institution where MR spectroscopy was acquired, and interpreted by nuclear medicine physicians; 1 FDG-PET study was performed with delayed imaging only, at a different institution, but was reinterpreted by the study institution's nuclear medicine physician.
PET results were recorded as “suspicious” (SUVs increased on delayed compared with early acquisition, or values ≥3.511,13) or “not suspicious” (SUVs not meeting criteria for suspicious activity) by 1 observer (with 14 years of experience in image interpretation).
Statistical Analysis Methods
Descriptive statistics were reported for each PNST, including demographic information, anatomic lesion characteristics, clinical characteristics, and results of PET imaging. Qualitative MR spectroscopy results (presence or absence of a TMA signal) were compared for benign and malignant lesions, as well as among benign lesions, with use of the Fisher exact test. Quantitative MR spectroscopy results for each PNST were recorded as the metabolite concentrations when metabolite peaks were found. A percentage “TMA fraction” was determined from the metabolite concentration ratios as [TMA]/([TMA] + [Cr]) × 100. Note that this is slightly different from the more commonly used metric in prior MR spectroscopy studies of a TMA/Cr ratio; the TMA fraction was used here because it is a more stable measurement when Cr concentrations are either very low or are zero. Quantitative results were compared between benign and MPNSTs, and between neurofibromas and schwannomas, by the Wilcoxon 2-sampled (Mann-Whitney) test. The level of statistical significance was set at P < .05. Finally, MR spectroscopy and FDG-PET findings were recorded as concordant if MR spectroscopy and FDG-PET both classified lesions as malignant/suspicious or as benign/nonsuspicious.
Results
The On-line Table lists the clinical, histologic, and imaging characteristics for the patients and imaged tumor(s), with documentation of follow-up. The median age of the participants was 42 years (age range, 11–78 years); there were 12 men and 8 women. Eight participants had NF-1, and 1 had schwannomatosis.
Two patients were excluded because of an aborted MR spectroscopy by patient preference (n=1), and nondiagnostic quality (n=1). Two additional participants were excluded because of a lack of histologic confirmation or definitive follow-up. Hence, a total of 6 voxels were placed in 4 MPNSTs and 18 voxels placed in 16 benign PNSTs. Diagnostic quality spectra were achieved for 22 of 24 included voxel locations.
A discrete TMA peak was identified in 9 of 18 voxels placed in benign PNSTs (4 schwannomas, 5 neurofibromas) and in 6 of 6 voxels placed in MPNSTs, suggesting that the absence of a detectable TMA signal is a useful sign of a benign PNST (P = .02). Sensitivity, specificity, positive predictive value, and negative predictive value to distinguish benign and malignant lesions, based on qualitative MR spectroscopy results, were 100%, 50.0%, 40.0%, and 100%, respectively (Table).
Accuracy of proton MR spectroscopy for distinction of benign and malignant PNSTs
TMA concentrations were significantly lower in benign PNSTs (mean, 2.2 ± 2.8; range, 0–9.2) than in MPNSTs (mean, 6.6 ± 5.8; range, 1.6–14.0) (P < .049). There was also a significant difference in the TMA fraction of benign PNSTs (27% ± 42%; range, 0%–100%) and MPNSTs (88% ± 22%; range, 51%–100%) (P < .012). Taking a TMA fraction > 50% as a definition for malignant disease resulted in a 100% negative predictive value and a sensitivity, specificity, and positive predictive value of 100%, 72.2%, and 54.5%, respectively. Figures 1 and 2 show examples of benign PNSTs and MPNSTs. Figure 3 is a graphic representation of TMA content between schwannomas, neurofibromas, and MPNSTs.

A 53-year old man with NF-1 and a left anterior thigh MPNST. Axial fat-suppressed T2-weighted (A) and coronal STIR (B) images show a heterogeneous mass within the left anterior thigh. Single-voxel placement is shown. (C) MR spectroscopy revealed a detectable TMA peak, with a TMA concentration of 14.0 institutional units and a TMA fraction of 74%.

A 41-year-old woman with a biopsy-proven neurofibroma. Axial fat-suppressed T2 weighted (A) and sagittal STIR (B) images of the right thigh show a soft tissue mass with a low internal signal and a high peripheral signal. Voxel placement is shown, from multivoxel MR spectroscopic imaging in this lesion. C, MR spectroscopy revealed a detectable TMA peak within the mass, with a TMA concentration of 3.5 institutional units and a TMA fraction of 7%.

Comparison of the TMA concentrations (A) and TMA fractions (B) of MPNSTs, neurofibromas, and schwannomas. These results indicate that both the TMA concentration and the TMA fraction are sensitive for the detection of malignant disease, but the TMA fraction is more specific for distinguishing benign neurofibromas from MPNSTs. TMA content does not reliably distinguish between schwannomas and neurofibromas.
In patients with a history of NF-1, lower TMA concentrations were found in benign neurofibromas compared with MPNSTs, though the differences were not statistically significant (0.9 ± 1.8 vs 6.6 ± 5.8, respectively; P < .61), but the spectral pattern in the TMA fraction was significantly different (23% ± 43% vs 88% ± 22%, respectively; P = .005). Taking a TMA fraction > 50% as a definition for malignant disease in the patients with NF-1 resulted in a sensitivity, specificity, positive predictive value, and negative predictive value for diagnosis of an MPNST of 100%, 77.8%, 75.0%, and 100%, respectively.
Schwannomas had 2 distinct patterns, either showing an absence of detectable metabolite signals (in 4/7), or a high TMA fraction (> 50% in 3/7), similar to that found in MPNSTs. For neurofibromas, most cases showed a TMA fraction < 10%, but 2 patients had a TMA fraction of 100%. Hence, comparing all schwannomas with all neurofibromas, differences in the TMA concentrations (3.0 ± 3.5 vs 1.5 ± 2.1, respectively; P < .66) and TMA fraction (46% ± 50% vs 12% ± 31%, respectively; P < .27) were not significant.
A total of 9 patients (16 lesions in total) with NF-1 or schwannomatosis also underwent FDG-PET. In the schwannoma case studied by FDG-PET (n=1), PET correctly classified the lesion as nonsuspicious, whereas MR spectroscopy suggested malignant disease (TMA fraction, 60%). For the benign neurofibromas (9 lesions), MR spectroscopy and FDG-PET results were concordant (and agreed with the final diagnosis) in 6 of 9 lesions, and were discordant in 3 of 9 lesions. In 1 case, MR spectroscopy produced a false-positive result, and in 2 cases, FDG-PET produced false-positive results (Table 1); however, in one of these cases, the FDG-PET was a single time point (rather than early and delayed acquisitions), possibly accounting for the discrepancy. For MPNSTs, results of MR spectroscopy and FDG-PET were concordant in all cases.
Discussion
PNSTs are among the most common soft tissue tumors that occur in the musculoskeletal system.1,29 Most nerve sheath tumors are benign, with schwannomas and neurofibromas accounting for 6% of soft tissue tumors, but MPNSTs are rare. However, patients with NF-1 carry a lifetime risk of up to 10% for the development of an MPNST.28 Unfortunately, the ability to distinguish benign PNSTs and MPNSTs with current clinical and imaging tools remains challenging, with only a few anatomic features6⇓–8 or markers of metabolic activity by PET10,13,24 assisting in the diagnosis of malignant disease. Our present study offers preliminary evidence that proton MR spectroscopy is feasible in PNSTs and is a potentially valuable method for their characterization. Although qualitative interpretation of the presence or absence of a TMA signal on MR spectroscopy appears to have a high sensitivity for diagnosis of malignant disease, it offers poor specificity because many benign lesions also show a detectable TMA signal. The specificity of MR spectroscopy is increased by quantitative estimates of either the TMA concentration or TMA fraction.
In musculoskeletal masses, previous proton MR spectroscopy studies have established TMA as a marker for malignant disease.18 The TMA peak resonating at 3.2 ppm is a composite peak with contributions from phosphocholine, glycerophosphocholine, and free choline itself, metabolites that are involved in the synthesis and degradation of cell membranes. During malignant transformation, several alterations in TMA metabolism are known to occur, including increases in the synthesis of phosphocholine due to choline-kinase activation, as well as upregulation of phosphatidylcholine metabolism by ras mutations, found in multiple tumor types, including sarcomas.30 Of note, the loss of neurofibromin that occurs as a result of the Nf1 mutation results in constitutive activation of ras.31 Consistent with prior investigations, all MPNSTs in the current series showed detectable levels of TMA, with a high TMA content reflected both in elevated TMA concentrations as well as in TMA fractions > 50%. However, several of the benign PNSTs in this study showed detectable TMA peaks consistent with a recent review that included 9 benign PNSTs,18 all of which had discrete TMA peaks. Quantitative analysis of TMA content in this study allowed further characterization because most benign PNSTs showed lower TMA concentrations and TMA fractions than those of MPNSTs, though there were outliers that had a similar TMA profile to MPNSTs. These results may be the result of a lack of specificity of the technique or the result of the heterogeneity of the tumor with some regions harboring atypical, but not yet malignant, histologic patterns.32 The cumulative results of this study suggest that MR spectroscopy has a high negative predictive value for malignant disease in PNSTs: When no detectable TMA peak was present, or TMA content (concentration or fraction) was low, a benign diagnosis was found in all cases.
FDG-PET, along with MR imaging, is a key technique used to assess for malignant transformation in the setting of NF-1 based on a sensitivity of 0.89 (95% CI, 0.76–0.96) and a specificity of 0.95 (95% CI, 0.88–0.98) in this patient population.11 In this study, FDG-PET findings were concordant with the MR spectroscopy findings in all cases of malignant disease (with no false-negative findings); however, both MR spectroscopy and FDG-PET had false-positive results and were discordant in 3 cases of benign neurofibromas. Hence, MR spectroscopy has initial results similar to FDG-PET for a diagnosis of malignant disease in patients with NF-1, and may be used clinically to further characterize FDG-avid lesions as either neurofibroma or MPNST. Further investigations are needed to assess the additive role and cost-effectiveness of MR spectroscopy and PET, alone or in combination, in patients with NF-1. It is interesting to note that metabolic activity within some schwannomas has been found to be similar to that of MPNSTs by PET,24 and this finding may explain why some schwannomas in the current series were metabolically active by MR spectroscopy, to a level similar to that of MPNSTs. Figure 4 shows a potential diagnostic algorithm for the incorporation of MR spectroscopy into the characterization of PNSTs, though further study is needed to determine the interplay of FDG-PET and MR spectroscopy in the characterization of PNSTs.

Flow chart suggesting the potential usefulness of proton MR spectroscopy for the assessment of PNSTs. Because MR spectroscopy offers a negative predictive value of 100%, the absence of detectable TMA within a PNST indicates a benign diagnosis. However, when a detectable TMA peak is present, quantitative results are helpful: A low TMA fraction indicates a benign PNST, whereas a high TMA fraction supports the diagnosis of malignant disease. In a patient with suspicious clinical features or risk factors for malignant disease (such as a history of NF-1), a high TMA fraction signifies the need for a biopsy. In a patient without suspicious clinical features or a history of NF-1 but with a high TMA fraction, close follow-up rather than biopsy may be entertained.
Another important clinical dilemma lies with the characterization of benign PNSTs, as no MR imaging finding is sufficiently specific to allow confident discrimination between neurofibromas and schwannomas,4 though their distinction carries therapeutic implications. Schwannomas may be amenable to nerve-sparing resection, whereas the resection of a neurofibroma has the potential for greater morbidity.33 Unfortunately, our investigations showed no significant differences in either TMA concentration or TMA fraction between schwannomas and neurofibromas, suggesting that other techniques will be required to assist in this distinction.
The small sample size of patients recruited from a single-center, tertiary institution in this study was a limitation, but the results provided preliminary data as a framework for future investigations with a larger number of participants and variety of PNST histologic features. Although all malignant cases in this study had histologic confirmation, several benign cases did not have a tissue diagnosis because these patients all had NF-1 or schwannomatosis, and there is rarely indication for surgical intervention for lesions that are behaving in a benign clinical fashion. All patients without histologic confirmation had clinical and radiographic follow-up confirming benign lesion behavior. However, the lack of histologic confirmation for these benign cases and the relatively short-term follow-up available remains a limitation of this study. It is challenging to determine when malignant transformation occurs within a benign neurofibroma in patients with NF-1, and, though rare, schwannomas may occur in NF-1 and neurofibromas may occur in schwannomatosis such that clinical diagnosis on the basis of tumor behavior and imaging features is not always accurate. Second, in patients with NF-1, the use of single-voxel MR spectroscopy may be suboptimal for the identification of MPNSTs, given that MPNSTs typically arise within benign neurofibromas and these tumors are large and heterogeneous. In the future, higher-spatial resolution multivoxel MR spectroscopic imaging (shown to be feasible in this study) may be used to map out lesion heterogeneity and may be a helpful approach to identify high-risk regions to biopsy. Finally, the performance of MR spectroscopy requires availability of a dedicated physicist familiar with the technique, and optimization before implementation clinically, given the complexities of the approach.
Conclusions
Quantitative MR spectroscopy measurements of Cho content in PNSTs provides good separation between benign and malignant nerve sheath tumors, offering a high negative predictive value when Cho content is negligible, and a high sensitivity when the Cho fraction is > 50%. With quantitative methodology, the specificity of MR spectroscopy to distinguish benign and MPNSTs is increased compared with a qualitative assessment of Cho content (the presence of detectable Cho). MR spectroscopy may prove to be especially useful in patients with NF-1 who are at high risk for malignant transformation of benign neurofibromas, and may offer supporting or complementary information to interpret FDG-PET results in this regard. Although MR spectroscopy is a promising technique, the true value of MR spectroscopy to clinical decision-making in the work-up of PNSTs remains to be elucidated with larger studies.
Footnotes
Disclosures: Laura M. Fayad—UNRELATED: Grants/Grants Pending: Gerard (2008–2010),* Siemens (2011).* Jaishri O. Blakeley—UNRELATED: Grants/Grants Pending: Children's Tumor Foundation,* National Institutes of Health (NIH),* GlaxoSmithKline,* Lilly,* Sanifo.* Daniel Durand—RELATED: Grant: Radiological Society of North America (RSNA) R&E Foundation, Comments: During the period in which I worked on this manuscript, I received 50% salary support from the RSNA Research & Education Foundation; UNRELATED: Consultancy: Osiris Therapeutics, Med IQ, Comments: I have served as a consultant for these companies at various points during the past 8 years; Employment: McKinsey & Company, Evolent Health, Comments: I work full time as a healthcare consultant and have held positions with McKinsey & Company, Evolent Health; Payment for Development of Educational Presentations: Usmlerx.com, McGraw-Hill, Comments: I was a longtime editor of the McGraw-Hill First Aid for Boards Study series. Michael Jacobs—UNRELATED: Grants/Grants Pending: NIH,* Comments: U01CA070095, U01CA140204, P50CA103175. Peter Barker—UNRELATED: Consultancy: Olea Medical; Grants/Grants Pending: NIH*; Payment for Lectures (including service on speaker bureaus): Philips Healthcare; Royalties: Cambridge University Press. *Money paid to institution.
Funding information: L.M. Fayad: GE Radiology Research Fellowship (GERRAF), Siemens Medical Systems, The William M.G. Gatewood M.D. Fellowship, The SCBT/MR Young Investigator Award.
Paper previously presented at: Annual Meeting of the Society for Skeletal Radiology, March 18–21, 2012; Miami Beach, Florida.
REFERENCES
- Received May 30, 2013.
- Accepted after revision August 13, 2013.
- © 2014 by American Journal of Neuroradiology


