
Abstract
BACKGROUND AND PURPOSE: VBM is widely applied to characterize regional differences in brain volume among groups of subjects. The aim of this study was to develop and validate a method for voxelwise statistical analysis of cord volume and to test, with this method, the correlation between cord tissue loss and aging.
MATERIALS AND METHODS: 3D T1-weighted scans of the spinal cord were acquired from 90 healthy subjects spanning several decades of life. Using an AS method, we outlined the cord surface and created output images reformatted with image planes perpendicular to the estimated cord centerline. Unfolded cervical cord images were coregistered into a common standard space, and smoothed cord binary masks, produced by using the cord outlines estimated by the AS approach, were used as input images for spatial statistics.
RESULTS: High spatial correlation between normalized images was observed. Averaging of the normalized scans allowed the creation of a cervical cord template and of a standardized region-of-interest atlas. VBM analysis showed some significant associations between a decreased probability of cord tissue and aging. Results were robust across different smoothing levels, but the use of an anisotropic Gaussian kernel gave the optimal trade-off between spatial resolution and the requirements of the Gaussian random field theory.
CONCLUSIONS: VBM analysis of the cervical cord was feasible and holds great promise for accurate localization of regional cord atrophy in several neurologic conditions.
ABBREVIATIONS:
- AP
- anteroposterior
- AS
- active surface
- C-C
- craniocaudal
- CSA
- cross-sectional area
- CSAn
- normalized cranial cross-sectional area
- ETL
- echo-train length
- FWHM
- full width at half maximum
- GM
- gray matter
- GRF
- Gaussian random field
- K
- cluster extent
- L-R
- left-right
- VBM
- voxel-based morphometry
The spinal cord is a clinically eloquent site in the central nervous system, often affected by pathologic processes leading to irreversible tissue loss. Several neurologic conditions, such as MS,1,2 amyotrophic lateral sclerosis,3 and demyelinating inflammatory myelopathies,4 lead to a preferential involvement of the cervical segment of the spinal cord.
Previous studies assessed cervical cord atrophy by measuring the cross-sectional area at a single anatomic level.5,6 Recently, a new semiautomatic method based on an AS has been developed, allowing the segmentation of large portions of the spinal cord.7 This approach has been successfully applied to the measurement of cord atrophy in a large cohort of patients with MS with different clinical phenotypes.8
The cord centerline is an explicit part of the cord AS model and is iteratively updated during the cord-segmentation process, which consists of an increasing refinement of the AS describing the cord surface.7 The definition of this centerline allows the cord to be resampled in planes to which the centerline forms the normal vector, to obtain a 3D image in which the cord is artificially straightened and can be visualized as a cylinder-like structure.7 In this reformatted image, the spinal cord is also centered in the AP and L-R directions along its whole length. Because the complex 3D curvature of the cord has been removed in such unfolded images, the procedure of artificially straightening the cord opens up the opportunity to test whether spinal cord images from different subjects can be coregistered in the same space. This coregistration would allow the creation of a reference image of the cervical cord and the performance of voxelwise statistical analyses of cord atrophy, using techniques similar to those used for voxel-based analysis of the brain.9,10 VBM has been used to study the reductions in WM and GM volumes that resulted from spinal cord injury.11,12 Until now, the only attempt to create a template of the cervical cord was made by Stroman et al,13 who created a reference space for localizing significant clusters of cord fMRI activity. However, normalization and voxel-based analysis techniques have not been used to quantify the spatial distribution of cervical cord atrophy.
The aims of this study were to develop, by using a large group of healthy subjects, a method for voxelwise statistical analysis of cord volume and to validate the method by examining the correlation between cord tissue loss and aging.
Materials and Methods
Local ethics committee approval and written informed consent from all individuals were obtained before study initiation.
Subjects
Ninety healthy subjects (men/women, 32:58; mean age = 44.1 years, range = 18–73 years; mean height = 167.8 cm, range = 150–187 cm) were enrolled in this study. Subjects had no history of previous neurologic disorders and normal neurologic examination findings. Neck, shoulder, and arm symptoms had not occurred at any time during their lives. A history of cervical trauma and deformity on previous MR imaging scans was an exclusion criterion for the study. Evidence of cord compression on conventional MR imaging scans acquired for this study was an additional exclusion criterion.
MR Imaging Acquisition
Using a 1.5T Avanto scanner (Siemens, Erlangen, Germany), we acquired the following sequences from all study subjects:
Cervical Cord.
1) Sagittal 3D T1-weighted magnetization-prepared rapid acquisition of gradient echo scan: TR = 1160 ms, TE = 4.24 ms, TI = 600 ms, slab thickness = 80 mm, NEX = 2, matrix = 256 × 256 × 88 zero-filled to 512 × 256 × 88, FOV = 230 × 115 mm; 2) sagittal dual-echo TSE: TR = 2000 ms, TE = 30/145 ms, ETL = 23, number of sections = 7, section thickness = 4.0 mm, no gap, NEX = 5, matrix = 320 × 320, FOV = 300 × 300 mm. This sequence was acquired to exclude the presence of any disk protrusion or bony spondylosis, which might bias the assessment of regional cord atrophy.
Brain.
Axial dual-echo TSE: TR = 3460 ms, TE = 27/109 ms, ETL = 5, number of sections = 44, section thickness = 3.0 mm, no gap, matrix = 256 × 256, FOV = 250 × 250 mm.
Cord Unfolding and Registration
The sagittal T1-weighted scans of the cervical cord from all subjects were first reformatted in the axial plane and resampled to 1-mm section thickness. Then, the AS method7 was applied to each scan to estimate the cord surface and cord centerline. An initial estimate of the cord centerline was manually provided by placing landmarks at the extremes of the cord region to be studied (ie, the most cranial section in which the odontoid process of the epistropheus [C1] was visible and the section passing through the inferior border of C7) and approximately every 10 mm between these landmarks. A single operator performed the placement of all landmarks. A high intraoperator and interoperator reproducibility of this procedure has already been shown.7 Cord centerline and cord outlines at each section were calculated by using a segmentation algorithm with a steadily increasing refinement of the AS model describing the cord outline.7
The total cord length was calculated as the distance along the centerline between the 2 landmarks at C1 and C7. The mean cervical cord CSA was derived as the total cord volume divided by the cord length. Because there is a considerable intersubject variation in cord CSA, it was normalized to the CSAn, as previously described,7 and then entered into the statistical analysis. The intracranial cross-sectional area was measured at the level of the inferior margins of the corpus callosum, on an axial section of the proton-attenuation-weighted scan, by using the Jim software package (http://www.xinapse.com/home.php).7 The mean CSAn at C2–3, C3–4, C4–5, C5–6, C6–7, and C7–T1 disks was also obtained.
Unfolded cervical cord images of each subject were created by reformatting the input images in planes perpendicular to the estimated cord centerline.7 In the unfolded cervical cord images, the cord was always central in the FOV in the AP and L-R directions. Cervical cord contours estimated by the AS method were used to produce binarized cervical cord masks, which were also unfolded by applying the same reformatting procedure.
To adjust for intersubject variability, unfolded cord images were first standardized in length by rescaling them in the through-section direction to the median cord length of the entire study group (ie, 115 mm). Then, images from all healthy subjects younger than 40 years of age were averaged, and the mean image served as an initial estimate of the cervical cord template. Unfolded images of all subjects were coregistered to this template by using the VTK CISG tools (http://www.cma.mgh.harvard.edu/iatr/display.php?spec=id&ids=154).14 The transformation between an individual subject's image and the template image consisted of a scaling factor along the C-C direction, to account for any slight variation in the positioning of the landmarks at C1 and C7. No translation or rotation was necessary because images were already aligned in the L-R and AP directions. Also, rescaling in the L-R and AP directions was not permitted, to avoid artificial expansion/contraction of the cord area and inaccurate assessment of cord atrophy. The transformation was then applied to the unfolded cord mask of the same subject.
The goodness of the overlap among transformed images was quantitatively assessed in 2 ways: 1) by measuring the spatial correlation coefficient among normalized images, and 2) by determining the correspondence between subjects of the cervical intervertebral disks. Furthermore, any possible effect of subject height on the normalization procedure was investigated (see On-line Appendix for further details).
Creation of a Cervical Cord Atlas
Normalized images of all study subjects were averaged, and the resulting volume was taken as a reference template of the cervical cord. Cord outlines on this template were created by using the AS method,7 and the corresponding binary mask of the template cord was produced. This mask was then divided into cervical cord segments, from C1 to C7. C-C limits of each level were placed in accordance with the most probable position of the intervertebral disks, as defined by the previous 1-sample t test. Finally, each cord segment was divided into AP and L-R sections. We constructed a 3D color-coded map, labeling each voxel according to the corresponding anatomic zone.
Smoothing
Before statistical tests can be performed, voxel-based analysis usually requires smoothing of the input images with a 3D Gaussian kernel. Smoothing is performed to increase the SNR, to ensure the validity of the GRF theory,15 and to correct for possible imperfections of the normalization process.16 However, the filter size used for smoothing is highly variable between studies.17 The matched-filter theorem18 states that the filter width should be tailored to the size of the expected differences; however, because such differences are frequently difficult to predict a priori, an often quoted “rule of thumb” is that a kernel of approximately 2–3 times the voxel dimension should be used.19 Against this background, we tried different smoothing settings, by using 3D Gaussian kernels with FWHM ranging from 0.5 to 2.5 mm in steps of 0.5 mm. Given the anisotropic structure of the cord and its small transverse section, to preserve the in-plane resolution but to ensure the validity of GRF theory, we also tried smoothing with anisotropic Gaussian kernels having in-plane FWHMs ranging from 0.5 to 2 mm and FWHMs in the C-C direction ranging from 1 to 3 mm, in steps of 0.5 mm.
Spatial Statistical Analysis
Statistical tests on smoothed cervical cord masks were performed with SPM8 (Wellcome Department of Imaging Neuroscience, London, United Kingdom). Multiple regression models were used to assess the correlation with age (P < .001, uncorrected for multiple comparisons; cluster extent, k ≥ 20). Sex and total cervical cord volume between C1 and C7 were included in all the models as confounding covariates. The total numbers of suprathreshold voxels in the anterior, posterior, left, and right cervical cord were counted. To check the results of voxelwise analysis against those from whole-cord analysis, we used the Spearman rank correlation coefficient to assess the univariate correlation between mean CSAn and subject age.
Results
No hyperintense cervical cord lesions were seen on conventional MR images obtained from any of the subjects. Some degree of spondylosis/disk protrusion was found in 30 subjects (33%), but only in 7 subjects had it resulted in cord compression. To avoid any potential bias on atrophy measures, we excluded these subjects from the analysis. Thus, 83 subjects (men/women, 29:54; mean age = 43.6 years, range = 18–73 years) were actually included in the study. Thirty-nine of these subjects were younger than 40 years of age (men/women, 12:27), while the remaining 44 subjects were older than 40 years of age (men/women, 17:27). The mean CSAn over the whole cervical cord was 75.5 ± 5.4 mm2. The mean CSAn at the different cervical cord levels was the following: 76.2 ± 5.7 mm2 at C2–3, 80.7 ± 6.7 mm2 at C3–4, 82.7 ± 6.7 mm2 at C4/C5, 77.1 ± 6.8 mm2 at C5–6, 67.0 ± 6.7 mm2 at C6–7, and 53.5 ± 5.5 mm2 at the C7–T1 disks. Subject age was not correlated with overall CSAn (r = −0.02, P = .85) and mean regional CSAn values (r ranging from −0.13 to 0.07, P ranging from 0.20 to 0.95).
Cord Unfolding, Registration, and Creation of a Cervical Cord Template
All scans of the subjects included in the analysis were successfully unfolded and coregistered with VTK to the temporary cord template. The average of the normalized scans from all study subjects is shown in Fig 1A. The spatial correlation coefficient among normalized cord images was very high (average, r = 0.91 ± 0.02), and there was a significant overlap in the position of all cervical intervertebral disks in the final images (On-line Fig 1). Finally, results of the normalization procedure were demonstrated to be independent from subject height, as reported in the On-line Appendix.

A, Coronal, sagittal, and axial views of the cervical cord template created as average of the 83 healthy subjects included in the study. B, Coronal, sagittal, and axial sections (at different cervical cord levels) of the corresponding color-coded normalized region-label mask reporting the 24 reference anatomic regions. Areas outside the cervical cord were masked out.
Figure 1B shows the normalized color-coded region-labeled cervical cord mask. This mask comprises 24 anatomic zones (anterior, posterior, left, and right sections of C1/C2, C3, C4, C5, C6, and C7).
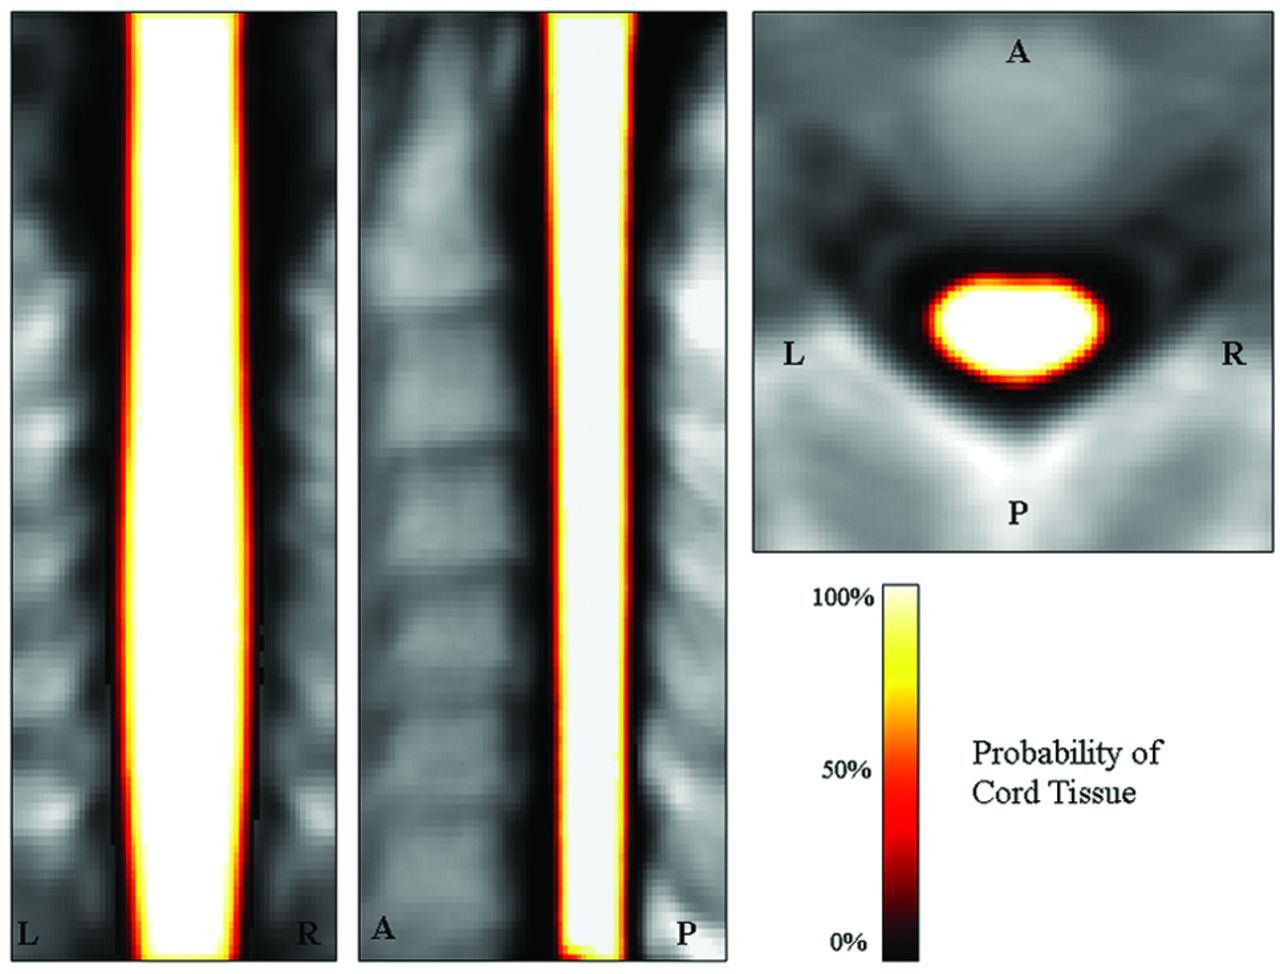
Voxelwise Statistical Analysis
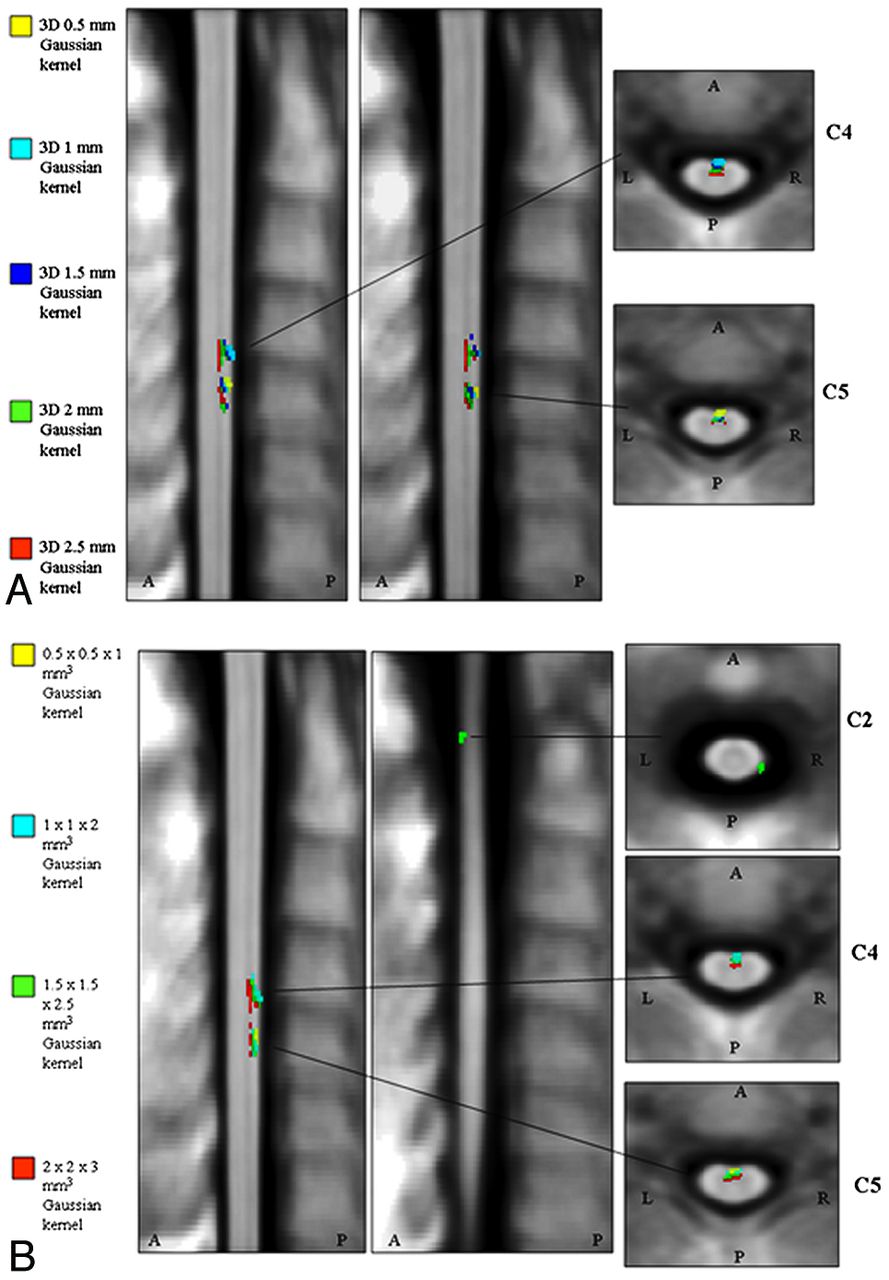
The mean probability map of the cord tissue was obtained by averaging all normalized cord masks (Fig 2). Some clusters showing a significant association between a lower probability of having cord tissue and aging were detected (r ranging from −0.37 to −0.44, P < .001) (Table and Fig 3). These clusters were present, with variable spatial extent, with almost all smoothing filters used (Table). Most significant voxels were located in the anterior rather than in the posterior cord and on the right rather than on the left (Table). Larger smoothing kernels lead to slight increases in the t values associated with the spatial statistics, but they also lead to a partial contamination of the results, with pixels indicating significant atrophy located away from the cord edges (Fig 3). The use of anisotropic smoothing with a relatively small in-plane width (eg, 1 × 1 × 2 mm3 FWHM) seems to give a good trade-off between the need to satisfy GRF assumptions and the maintenance of precise spatial localization of volume differences.

Coronal, sagittal, and axial views of the mean cord tissue probability map for the 83 study subjects.

Significant clusters of correlation between cervical cord atrophy and subject age, corrected for the possible confounding effects of sex and total cord volume (P < .001, uncorrected for multiple comparisons; cluster extent, k ≥ 20) with the different smoothing options applied to our cervical cord masks. A, Isotropic Gaussian kernels with FWHM ranging from 0.5 to 2.5 mm3. B, Anisotropic Gaussian kernels with FWHM ranging from 0.5 × 0.5 × 1 mm3 to 2 × 2 × 3 mm3.
Significant clusters of correlation between cord atrophy and aging revealed by voxel-based analyses with different smoothing optionsa
Discussion
In this study, we developed a procedure able to normalize cervical cord images to a standard space and to produce cord masks that could be analyzed with voxelwise statistical tests similar to those currently applied for VBM brain analysis. An AS approach was used to create the normalized cervical cord scans and to build a reference space for VBM of cord atrophy. This was possible because the cord centerline is parameterized by the AS model,7 enabling reformatting of the original cervical cord images with the curved centerline parameter as the new C-C coordinate in the resampled image. The planes of the output image are always perpendicular to the centerline along its whole length, resulting in an unfolded image in which the cord is a cylinder-like straight structure. Because cord curvature was removed, a simple scaling along the C-C direction was sufficient to create well-coregistered cervical cord scans, as quantitatively demonstrated. To date, a similar normalization procedure has been performed only by Stroman et al,13 who used a reference line manually drawn on the anterior cord edge to reformat sagittal fMRI scans perpendicular to this line. The distance between 2 reference points (ie, the pontomedullary junction and the C7–T1 intervertebral disk) was adjusted to a standard value for all subjects. This approach was also very powerful and allowed the creation of a precise cervical cord template; however, the use of a reference line drawn on the anterior cord edge might cause better alignment of the anterior compared with the posterior cord regions (which would have seen higher displacements during the reformatting step). Because we used a line passing exactly through the cord center estimated by the AS method when reformatting cord scans, we should have largely avoided this drawback. Moreover, because the AS method also provides cord outlines on each section, we were able to generate binary cervical cord masks, which could be used as input images for a voxel-based analysis of regional differences of cord volume.
Our cervical cord template was further segmented into 24 anatomic regions, with 6 cervical cord levels (eg, C1/C2, C3, C4, C5, C6, and C7), each divided in 4 quadrants. Accurate partitioning of the template was possible by using the most probable position of each disk as the inferior and superior borders of each segment. Because the cord centerline is placed at the cord center of the cross-sectional area, this placement provides a natural subdivision of the cord into AP and L-R quadrants, each of equal area. Several parcellated atlases of the brain20⇓–22 have been constructed to accurately localize clusters of fMRI activity and regional atrophy. Our cervical cord region-of-interest-labeled mask was built for the same purposes and should prove extremely useful for any subsequent study aimed at localizing, objectively and automatically, clusters of cervical cord atrophy. A similar region-of-interest-labeled mask was also created by Stroman et al,13 who included brain stem regions in their atlas, due to the larger FOV of his sagittal fMRI scans.
Contrary to what was found when analyzing diffusion anisotropy images of the brain,17 our voxel-based statistical analysis showed relatively stable results with varying degrees of smoothing. Clusters of significant association between a lower cord volume and aging varied little with different smoothing kernels, though the trend was for cluster extent and associated peak t values to increase with a larger Gaussian kernel size. This may be due to both reduced variance and residuals that are more normally distributed, as is required by the GRF theory. On the other hand, larger smoothing kernels seemed to cause a loss of spatial accuracy of the results, with the inclusion of false-positive significant pixels of cord atrophy. The best approach might be, therefore, to use an anisotropic Gaussian kernel with smaller FWHM in the in-plane directions compared with the C-C direction. For example, a Gaussian kernel of 1 × 1 × 2 mm3 is compliant with the proposed “rule of thumb” for smoothing19 (ie, that the kernel width should be at least 2 times the voxel size) while preserving the spatial precision of the statistical results.
Although our analysis needs to be interpreted cautiously because it was tested at an uncorrected threshold, we found some clusters of correlation between cervical cord regional volume and aging, whereas the whole-cord volume analysis did not detect a significant association between these. While there is general agreement, especially when taking into account data from postmortem studies, that spinal cord tissue is not spared by age-related pathologic changes,23⇓–25 it is still a matter of debate whether these changes lead to visible whole-cord atrophy, which was reported by some MR imaging studies26,27 but not by others.1,28 Our results might suggest that these neurodegenerative processes do produce some subtle tissue loss, though it is not always extensive enough to be detected at a global level. Moreover, most voxels significantly associated with a lower probability of containing cord tissue were located in the anterior portion the cord. This seems to be in agreement with the results of previous postmortem studies,23⇓–25 which found that neuronal loss was mainly located in the anterior horns of the GM.25 Because the contrast between GM and WM in our sequence did not allow these 2 tissues to be distinguished, we cannot confirm whether GM is more affected by atrophy than WM.
Another aspect that should be considered is the possible impact on our results of intersubject somatic variability. We believe that the subject's weight is not likely to have influenced our voxel-based results a great deal because it was demonstrated that the body mass index is not correlated with the cervical cord area.1,29 On the other hand, cord area is influenced by cord length;29 nevertheless, because our postprocessing pipeline included a rescaling of all images to the same cord length, our results are likely to be independent from this potentially confounding factor.
One limitation of the proposed method may be that it is not straightforward to apply it to subjects with vertebral column disease causing cervical cord compression. Indeed, to exclude the possibility of clusters of cord atrophy simply due to cord compression rather than to cord pathology, we left out 7 subjects from our analysis. On the other hand, methods assessing cord atrophy at single anatomic levels5,6 simply require the absence of cord compression at that level. Another limitation, compared with brain VBM, is the inability to study regional GM and WM atrophy. This would require the use of advanced high-resolution MR imaging sequences optimizing the contrast between GM and WM30,31 and the application of algorithms automatically segmenting cord GM and WM. Such algorithms have been developed for brain segmentation,32,33 but their successful extension to the cervical cord would need to be demonstrated.
Conclusions
VBM of the cervical cord is feasible, produces reliable results, and holds great promise for accurate localization of regional cord atrophy in several neurologic conditions.
Footnotes
-
Disclosures: Mark Horsfield—UNRELATED: Consultancy: GE Healthcare, Comments: consultancy not relevant to publication, Stock/Stock Options: Xinapse Systems, Comments: not relevant to publication. Giancarlo Comi—UNRELATED: Consultancy: Novartis, Teva Pharmaceutical Industries Ltd, Sanofi-Aventis, Merck Serono, Bayer Schering, Actelion, Payment for Lectures (including service on Speakers Bureaus): Novartis, Teva Pharmaceutical Industries Ltd, Sanofi-Aventis, Merck Serono, Bayer Schering, Serono Symposia International Foundation. Massimo Filippi—UNRELATED: Board Membership: Teva Pharmaceutical Industries Ltd, Genmab A/S, Comments: scientific advisory boards for trials in MS, Consultancy: Bayer Schering Pharma, Biogen-Dompè, Genmab A/S, Merck Serono, Teva Pharmaceutical Industries Ltd, Grants/Grants Pending: Bayer Schering Pharma, Biogen-Dompè, Genmab A/S, Merck Serono, Teva Pharmaceutical Industries Ltd, Fondazione Italiana Sclerosi Multipla, Payment for Lectures (including service on Speakers Bureaus): Bayer Schering Pharma, Biogen-Dompè, Genmab A/S, Merck Serono, Teva Pharmaceutical Industries Ltd, Payment for Development of Educational Presentations: Bayer Schering Pharma, Travel/Accommodations/Meeting Expenses Unrelated to Activities Listed: Bayer Schering Pharma, Biogen-Dompè, Genmab A/S, Merck Serono, Teva Pharmaceutical Industries Ltd.
References
- Received January 18, 2012.
- Accepted after revision March 14, 2012.
- © 2012 by American Journal of Neuroradiology
In this issue


Jump to section
Related Articles
Cited By...
- Connectome Spatial Smoothing (CSS): concepts, methods, and evaluation
- Heritability of cervical spinal cord structure
- Considerations for Mean Upper Cervical Cord Area Implementation in a Longitudinal MRI Setting: Methods, Interrater Reliability, and MRI Quality Control
- Anatomical Changes at the Level of the Primary Synapse in Neuropathic Pain: Evidence from the Spinal Trigeminal Nucleus
- Spinal cord imaging in multiple sclerosis: Filling the gap with the brain