
Abstract
BACKGROUND AND PURPOSE: The Chiari I malformation, characterized by tonsils extending below the foramen magnum, has increased CSF velocities compared with those in healthy subjects. Measuring the effect of tonsillar herniation on CSF flow in humans is confounded by interindividual variation. The goal of this study was to determine the effect of herniated tonsils on flow velocity and pressure dynamics by using 3D computational models.
MATERIALS AND METHODS: A previously described 3D mathematic model of the normal subarachnoid space was modified by extending the tonsils inferiorly. The chamber created was compared with the anatomy of the subarachnoid space. Pressures and velocities were calculated by CFA methods for sinusoidal flow of a Newtonian fluid. Results were displayed as 2D color-coded plots and 3D animations. Pressure gradients and flow velocities were compared with those in the normal model. Velocity distributions were also compared with those in clinical images of CSF flow.
RESULTS: The model represented grossly the subarachnoid space of a patient with Chiari I malformation. Fluid flow patterns in the Chiari model were complex, with jets in some locations and stagnant flow in others. Flow jets, synchronous bidirectional flow, and pressure gradients were greater in the Chiari model than in the normal model. The distribution of flow velocities in the model corresponded well with those observed in clinical images of CSF flow in patients with Chiari I.
CONCLUSIONS: Tonsillar herniation per se increases the pressure gradients and the complexity of flow patterns associated with oscillatory CSF flow.
Abbreviations
- AP
- anteroposterior
- CFA
- computational flow analysis
- LR
- left-right
- PCMR
- phase-contrast MR imaging
- Pmax
- maximum pressure
- Pmin
- minimum pressure
- SI
- superior-inferior
CSF flows alternately downward and upward through the foramen magnum during the cardiac cycle because of the expansion and contraction of the brain during cardiac systole and diastole. The oscillatory CSF flow during the cardiac cycle has a complex pattern with some regions of relatively high velocity and others with relatively low velocity. The flow patterns have been demonstrated by means of axial PCMR.1 Pressure gradients associated with the cranial and caudal flow have been demonstrated in an animal model in which tonsillar herniation was simulated with a balloon catheter.2
CSF flow is incompletely characterized by PCMR. The images show velocities at the levels selected for study but not throughout a volume. Furthermore, PCMR images do not show CSF pressure gradients. The cyclic CSF flow through the craniocervical region has recently been investigated in an idealized 3D model of the normal subarachnoid space by means of CFA.3 The model demonstrates flow and pressure throughout the selected space, with greater spatial and temporal resolution than PCMR. The flow characteristics in the model were found to correspond well with flow patterns demonstrated by PCMR in healthy adult human subjects. This model allows an investigator to measure flow changes resulting from changes in 1 single anatomic or physiologic parameter.
In the Chiari I malformation, CSF flows with higher velocities than in normal subjects,1,4,5 and pressures are increased.5 The hyperdynamic CSF flow and altered pressure dynamics in the Chiari malformation hypothetically have a role in the pathogenesis of syringomyelia,6,7 motor and sensory abnormalities, headache, and so forth associated with the Chiari I malformation.5 The effect of tonsillar herniation on CSF flow dynamics, therefore, needs further elaboration. A technique for investigating the effect of changing anatomy on CSF flow is the application of CFA to suitable models. The parameters affecting CSF flow are better controlled in such an experiment than in measurements in patient groups because of significant interindividual variation. In this study, we used a mathematic model of the subarachnoid space to measure the effect of tonsillar herniation on CSF velocities and pressures in the craniocervical region during a complete cardiac cycle.
Materials and Methods
Geometric Model of the Subarachnoid Space
We used a geometric model3 of the subarachnoid space in which the brain and the spinal cord were modeled respectively as a cone-shaped structure and a tube. These were located inside another conical structure and tube so that the space between the 2 formed an idealized model of the cranial and upper cervical subarachnoid space. With the Star-CD graphics program (CD-Adapco, Melville, New York),8 2 cones were added to the inferior surface of the brain model, to simulate tonsils extending into the posterior portion of the upper cervical spinal canal. The “tonsils” had a length of 3.5 cm and a diameter of 0.5 cm at foramen magnum so that they narrowed the posterior subarachnoid space (Fig 1A). In all other aspects, the model with herniated tonsils was identical to the previously described idealized model of the normal subarachnoid space (Fig 1B). No structure to represent the tentorium or channels corresponding to the fourth ventricle or its foramina was included in the model. The region that corresponded to the craniovertebral junction was located midway between the top and bottom of the model, extending 20 cm superoinferiorly. The cross-sectional geometry of the superior and inferior ends of the model was extended 2 cm as they were in the normal model so that inflow and outflow boundary conditions could be specified more efficiently. The walls of the model were assumed rigid, nonpermeable, and immobile. Sagittal and axial sections of the model were inspected by a neuroradiologist who determined if the model had the gross appearance of the subarachnoid space in a Chiari I malformation.

The idealized model (A) of a subarachnoid space with herniated tonsils and the original model (B) with normally positioned tonsils. The models are shown with sagittal MR images illustrating a typical normal individual and a typical Chiari I malformation. For the normal model, a midline sagittal plane is shown and for the tonsillar herniation case, its paramedian through the nearest tonsil. A white reference line indicates the midpoint of the model at the correlate of the craniovertebral junction. The extensions to the model to facilitate the description of boundary conditions are demonstrated by the red lines. Anterior is to the reader's left and posterior to the right.
Simulation of Flow and Pressure in the Model
The geometry of the Chiari model was converted in ICEM CFD9 to a hexahedral computational mesh with 615 680 nodes. Each computational cell had the smallest distance between nodes ranging from 0.15 to 1.25 mm. The higher resolutions were used in places with higher geometric complexity. Standard CFA methods available in Star-CD were used to calculate velocities and pressures during several cycles of oscillatory flow through the model. The boundary conditions and fluid characteristics that were used previously for the normal model3 were also used for the simulation of flow in the Chiari model. We assumed a pressure at the top of the model corresponding to 20 cm of water. We assumed a plug-shaped inflow velocity profile varying sinusoidally at 1 cycle per second. The magnitude of peak flow was set at 17 mL/s, which corresponds to the flow rate selected empirically for the normal model to produce peak velocities of 2–3 cm/s near the cranio-occipital junction. Flow was assumed laminar in all of flow space. No-slip (zero-velocity) conditions were specified at the walls. The flowing fluid was assumed to have the properties of water. With the finite volume method in Star-CD, the Navier-Stokes equations were solved numerically to give a fluid velocity vector and a scalar pressure at each computational point in the grid at millisecond intervals. Data from the simulations were postprocessed in Star-CD and Matlab10 to display color-coded velocity and pressure data in 2D sagittal and axial sections and to display the velocity vector cinematically. Simulations were initiated with zero-flow velocity, but a steady periodic state was reached already in the third flow cycle, allowing this cycle to be used for our investigations. To confirm that grid resolution was sufficient, we repeated simulations with another grid having 35% fewer computational points.
Plots of the velocity vectors in sagittal planes and in successive axial planes were inspected for evidence of flow jets, stagnant flow, and synchronous bidirectional flow (ie, flow simultaneously in both cranial and caudal directions). The location in the subarachnoid space and the time in the flow cycle for the peak velocities and pressures were determined by inspection. Velocity characteristics in the Chiari model and the normal model were compared.
Animation
Animations were created with the volume-rendering tool VoluViz.11 The animations use particle-tracking display to demonstrate the direction of flow.12 They have color scales to demonstrate the magnitude of flow. The animations were inspected interactively to describe the flow patterns.
Velocities as a Function of Level
Components of the velocity vector in the SI, LR, and AP directions were plotted for the time of maximal inferior and maximal superior flow (t = 0.25 and 0.75 seconds) and for change in flow direction (t = 0.00 and 0.50 seconds) for both the Chiari and the normal model. Changes in velocity vectors along the spinal column were assessed. Differences between the Chiari model and the normal model were noted.
Pressure Gradients
Pressure gradients were assessed by inspection of sections made in sagittal and axial planes through the models. Pressure differences (top-bottom) were tabulated for 4 phases of the cycle (t = 0.00, 0.25, 0.50, and 0.75 seconds). Pressures in the Chiari model and the normal model were compared.
Validation of Chiari Model
A neuroradiologist (the second author) compared axial displays of flow velocity distributions at the craniovertebral junction in the Chiari model with velocities in axial PCMR images from patients with Chiari I. The model was considered validated if visual inspection revealed similar distribution and magnitudes of velocities in the tonsillar herniation model and in the PCMR images from patients.
Reynolds Number Calculation
Reynolds number (Re) is defined as

where us is the mean fluid velocity in m/s, L is the characteristic length (hydraulic diameter) in m, and v is the kinematic fluid viscosity in m2/s, for which we used a value of 0.700 ·10−6 m2/s (water at 37°C). The numbers were calculated for maximal fluid velocity and characteristic length.
Results
Geometric Model of the Subarachnoid Space
The geometric model of the Chiari I malformation had diminished volumes of the craniovertebral junction and upper posterior cervical subarachnoid space compared with the normal idealized model. In sagittal and axial sections, the geometric model with inferiorly displaced tonsils was judged by the neuroradiologist to approximate the subarachnoid space in the Chiari I malformation (Fig 1).
Simulations of Flow and Pressure in the Chiari Model
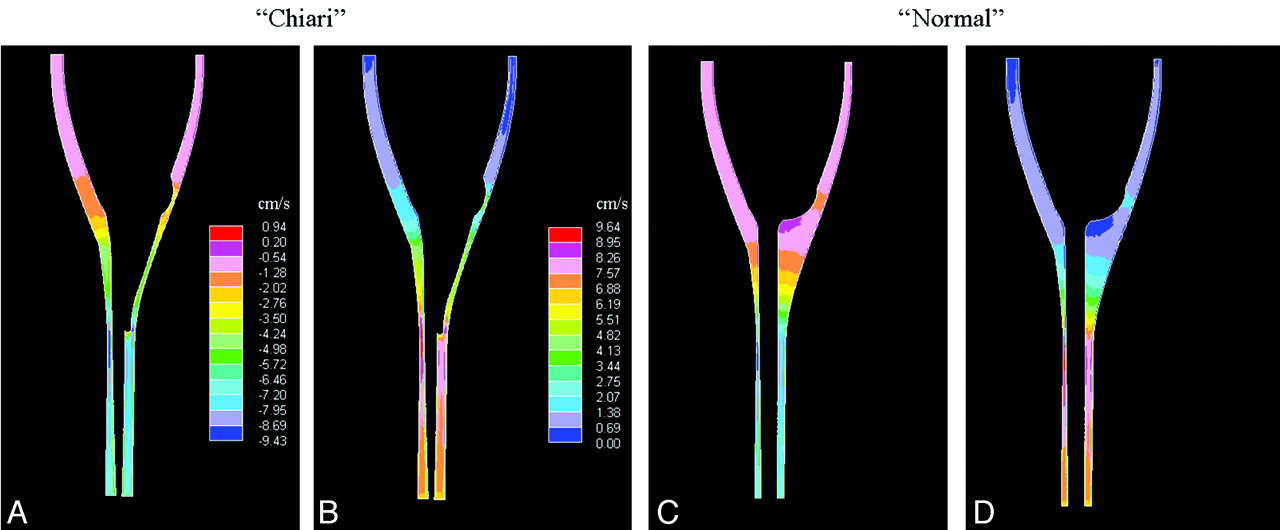
The simulations showed velocity patterns changing in space and with the phase of the cardiac cycle (Figs 2 and 3). Sagittal images showed larger velocities in the spinal canal than in the cranial vault (Fig 2). Axial images showed regions of localized above-average velocities (“jets”) in cardiac phases with caudal flow. These jets had velocities of 5.7 cm/s at peak caudal flow (Fig 3A), more than twice the velocity in the normal model (Fig 3B). The AP and LR components of the velocity vectors (in-plane or x and y components) showed the same patterns (Fig 4 A, -B). At the peak cranial volume flow rate, velocity components in the superior direction had no clear jet pattern. However, the transverse velocity components had clear jet patterns (Fig 4C, -D). These jet patterns were seen for both in-plane velocity components in any axial plane chosen for t = 0.00, 0.25, 0.50, or 0.75 seconds.

Sagittal plane sections showing flow velocities in the Chiari model at the time when the caudal volume flow rate is maximal (t = 0.25 seconds, A) and when cranial volume flow rate is maximal (t = 0.75 seconds, B). C and D, For comparison, corresponding sections in the normal model are shown. Velocity scales in are the same as in A and B, respectively. The plane selected for the Chiari model is paramidline to demonstrate the extension of the tonsils into the spinal canal.

Axial sections show flow velocity at the craniovertebral junction in the Chiari model at the time when caudal volume flow rate is maximal (t = 0.25 seconds). B, For comparison, a corresponding section for the original model (without tonsil herniation) is shown at an equivalent time in the cycle. Note that the distribution of peak velocities in both models is similar and that in the presence of tonsillar herniation, velocities are more than double those in absence of tonsillar herniation.

Axial sections showing the LR (A) and AP components (B) of the flow velocity vector at the craniovertebral junction in the Chiari model at the time when the caudal volume flow rate is maximal (t = 0.25 seconds). C and D, Similar velocity components are also shown, when cranial volume flow rate is maximal (t = 0.75 seconds). Velocity scales are the same as in A and B, respectively.
Results were essentially identical when simulations were run on the coarser grid. For example, in the axial section from the craniovertebral junction at the time when the caudal flow rate was maximal (Fig 3A), minimum and maximum velocities differed by <1 mm/s.
Animation
Animations display differences in fluid velocities and flow directions in the entire fluid space of the model through the entire flow cycle (http://home.simula.no/∼sveinlin/CSFChiari.m1v, Fig 5). At the time of maximal caudal or cephalad flow, the greatest velocities are present both in the spinal canal and in the craniovertebral junction. Flow patterns are complex throughout the flow cycle, especially at the time that flow reverses.

A single frame from the particle-tracking display for the Chiari model shows a complex pattern of CSF movement in 1 portion of the subarachnoid space. Note the arrows in multiple directions. The animation (http://home.simula.no/∼sveinlin/CSFChiari.m1v) displays CSF movement by means of particle tracking (left) and color coding (right) over 5 cardiac cycles, while the model is rotated 360°. The particle-tracking animation displays the direction of CSF flow; the color animation displays the velocity of flow. For the color display, velocities of ≥6 cm/s in the caudal direction are displayed in blue and ≥6 cm/s in the cephalad direction in red. The displays show complex flow patterns, especially when flow direction reverses. Flow transiently occurs in a direction perpendicular to that of the SI. Flow direction in different locations in the subarachnoid space changes at slightly different times in the cardiac cycle. Peak velocities in both caudal and cephalad directions appear to be reached in the spinal canal before they are reached at the craniovertebral junction. In comparison with the normal model (http://home.simula.no/∼sveinlin/CSFnormal.mpg), greater velocities are found in the craniovertebral junction and greater complexity of flow is demonstrated as flow direction changes.
Velocities as a Function of Level
In the Chiari model (solid lines, Fig 6), peak SI velocity components at the time of maximal caudal flow (t = 0.25 second, systole) and maximal cranial flow (t = 0.75 second, diastole) ranged from 5 to 10 cm/s. These components exceeded the components in the LR or AP direction by a factor of 2–6. Velocities increased along the spinal canal from approximately 5 cm/s at the foramen magnum to approximately 10 cm/s at the level 3 cm below the foramen magnum.

Peak velocity components (absolute values) for the Chiari model (solid lines) and the normal model (dotted lines). The SI (black), LR (red), and AP (blue) velocity components are shown in 4 axial sections at 4 different times during the flow cycle, when flow changes direction from cranial to caudal (t = 0.00 seconds), at maximal caudal flow (t = 0.25 seconds), when flow changes direction from caudal to cranial (t = 0.50 seconds), and, finally, at maximal cranial flow (t = 0.75 seconds). Sections are 1 cm apart, with section 1 located at the craniovertebral junction, and sections 3–7, at successively more inferior locations, with section 7 being near the tip of the tonsils.
In the normal model (dotted lines, Fig 6), peak velocities ranged from 2 to 9 cm/s. The SI components of the vector exceeded the AP and LR components by a factor in the range 3–21. Compared with the normal model, the 3 components of the velocity vectors were greater in the Chiari model at every level (except for the SI component in section 7 at t = 0.00 seconds). The variation of velocity with respect to level also differed in the 2 models (Fig 7), with a steeper gradient in the normal model than in the Chiari model.

Peak SI flow velocities at the time when the caudal volume flow rate is maximal (t = 0.25 seconds), shown as a function of the axial section for the Chiari model and the normal model. Section 1 is at the craniovertebral junction, and section 8 is just below the herniated tonsils. Sections are 0.5 cm apart. The peak velocity for the Chiari model is greater at the foramen magnum and increases less steeply with distance.
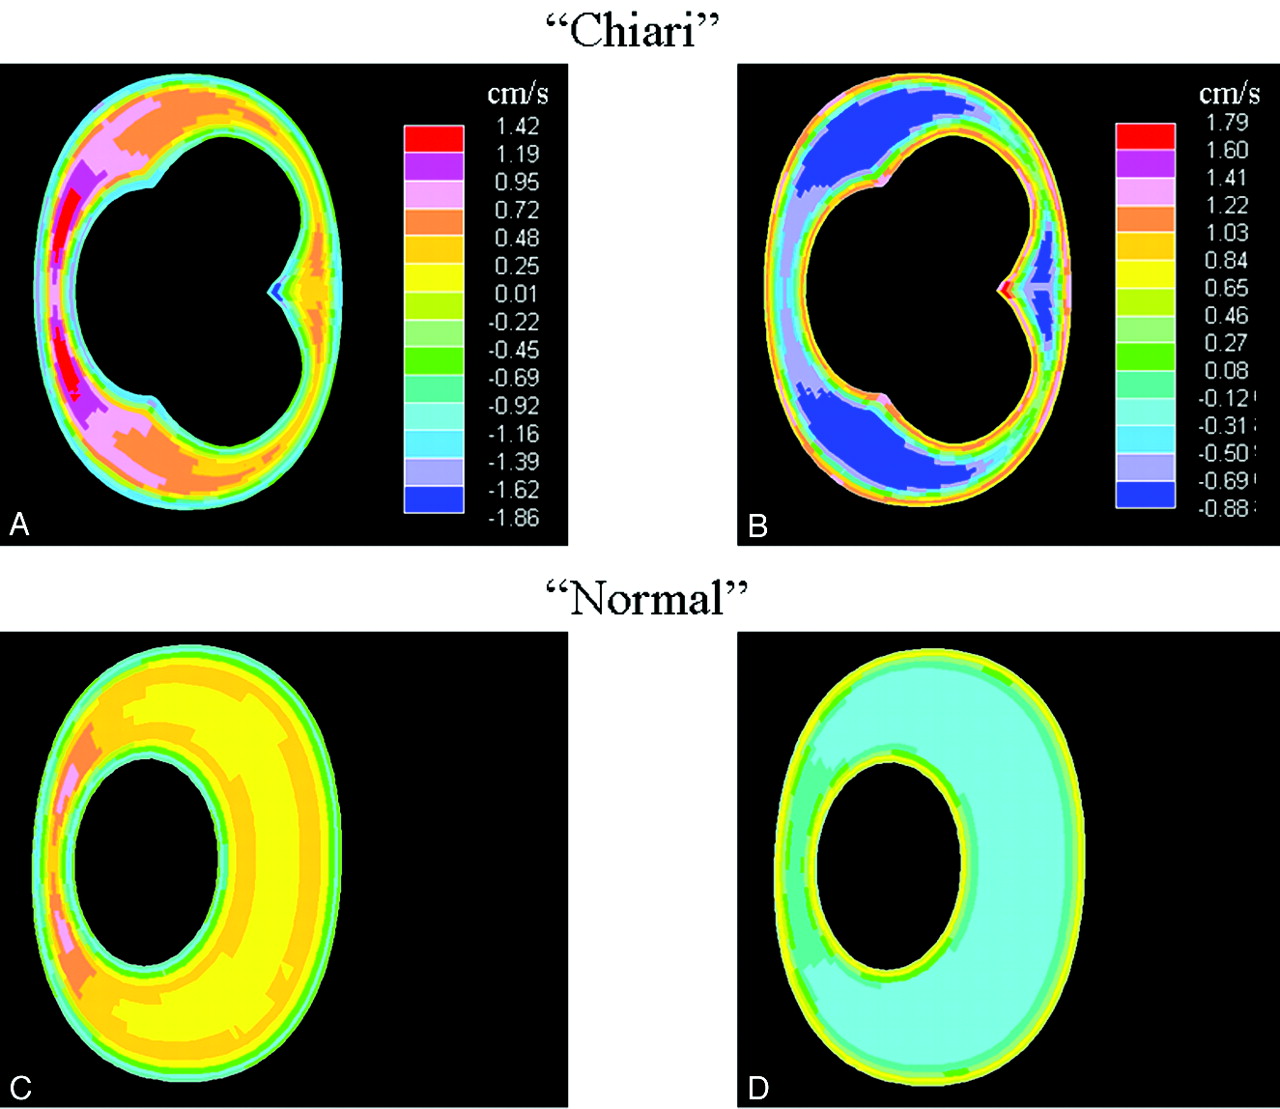
In the Chiari model, when CSF flow changed direction (t = 0.00 and t = 0.50 seconds), synchronous bidirectional flow occurred (Figs 8 A, -B). The countercurrent was evident as an oppositely directed flow primarily along the boundaries of the flow channel. At the times of flow reversal, flow was also characterized by high-velocity regions symmetrically located at each side of the sagittal plane that continued several centimeters down along the spinal cord. The synchronous bidirectional flow was more extensive in the Chiari model than in the normal model. For example, as flow changed direction from cranial to caudal in the normal model (Fig 8C), the largest difference found for oppositely directed flows was 2.0 cm/s, while in the Chiari model (Fig 8A), this number reached 3.3 cm/s (ie, an increase of 65%). Also, in the Chiari model, synchronous bidirectional flow lasted ≤0.4 seconds, twice as long as that for the normal model.

Axial sections showing flow velocity at the craniovertebral junction in the Chiari model at the time when flow direction changes from cranial to caudal (A) (t = 0.00 seconds) and when flow direction changes from caudal to cranial (B) (t = 0.50 seconds). C and D, For comparison, corresponding sections are also shown for the normal model at these times in the cycle. Note that oppositely directed flow is observed at the boundaries of the subarachnoid space (ie, there is synchronous bidirectional flow). The velocities are greater in the Chiari model. Velocity scales are the same as in A and B, respectively.
Pressure Gradients
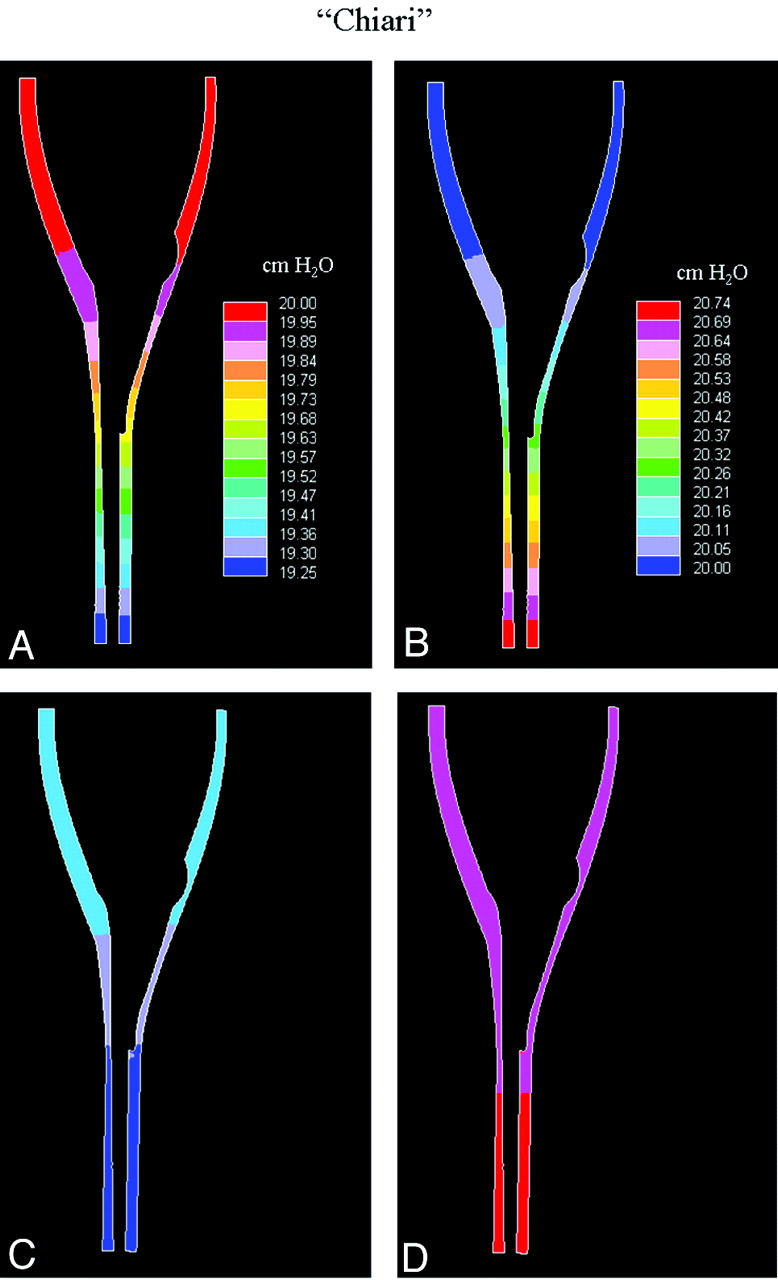
Pressure gradients varied with the phase of the CSF flow. Pressure gradients reached maximum at the time when flow direction reversed and minimum at the time when flow velocities were maximal (Fig 9). At all times during the cycle, pressure gradients were uniform along the spinal axis. Pressure difference between the top and bottom reached 0.75 cm H2O over the Chiari model (Table 1). Compared with the normal model, the sagittal pressure gradients were 14%–30% greater in the Chiari model. In the axial planes, pressure gradients were evident in the Chiari model (Fig 10A, -B). These gradients were small in magnitude, but 2–3 times larger than those in the normal model (Tables 2 and 3). The average relative pressure difference (averaging the quantity Pmax − Pmin / 0.5 * [Pmax + Pmin] over all axial planes) was 2 times higher in the Chiari model (ie, 0.6/1000 versus 0.3/1000). In-plane pressure gradients (Fig 10A, -B) correlated with in-plane flow velocity components (Fig 10C, -D), as previously noted (Fig 6).

Sagittal plane sections showing pressure distributions along the cord in the Chiari model at the time when flow direction changes from cranial to caudal (A) (t = 0.00 seconds) and when flow direction changes from caudal to cranial (B) (t = 0.50 seconds). At these times, the pressure gradient along the cord is at its maximum. At the times of maximal caudal (C) (t = 0.25 seconds) and cranial (D) (t = 0.75 seconds) flow, the pressure gradient was at its minimum. Pressure scales are the same as in A and B, respectively.
Pressure differences between top and bottom of the model at 4 points in time during the flow cycle for the Chiari and the normal modela

Axial sections showing pressure at the time of maximal cranial flow (t = 0.75 seconds) in an axial section in the Chiari model (A) and in the normal model (B). The sections are 2 cm below the foramen magnum (Section 5). The increased in-plane pressure gradient in the Chiari model correlates with the increased in-plane flow velocity components. C and D, The corresponding LR velocity components are shown for the Chiari and normal models, respectively. The pressure scale in B is the same as the one in A, and the velocity scale in D is the same as the one in C.
Axial section pressures (maximum and minimum) in the Chiari model l, for the same sections as in Table 1a
Axial section pressures (maximum and minimum) in the normal model, for the same sections as in Table 1a
Validation of Chiari Model
A neuroradiologist judged flow velocities in axial sections to have a pattern similar to that of PCMR flow images in patients with the Chiari I malformation. Both the inhomogeneity of flow and the jets anterolateral to the spinal cord in the model resemble the characteristics of flow in the Chiari I malformation.1 The peak velocities of CSF flow in the Chiari model, 9–10 cm/s, correlated with measurements in some patients with Chiari I.
Reynolds Number Calculation
At the levels of the herniated tonsils, Reynolds numbers were increased compared with the normal model. However, they were still lower than 780, which was the maximum Reynolds number found for the normal model further down in the spinal canal. The moderate Reynolds numbers suggest that the assumption of laminar flow is adequate.
Discussion
In an idealized model of the subarachnoid space, herniated tonsils had the effect of increasing CSF pressure gradients and the complexity of flow patterns. The Chiari model had similar CSF flow patterns and magnitudes as those in the PCMR images of CSF flow in patients with Chiari I. The study shows that tonsillar herniation alone is a sufficient cause for hyperdynamic CSF flow.
The idealized Chiari model does not reproduce the pathologic anatomy of any individual or any group of patients. Rather, its essential characteristics are within the range of what is found in patients. The model is simplified in several ways. Some structures, such as the fourth ventricle and tentorium, were not included in the model. These may affect CSF flow, but their absence in the model did not nullify the flow patterns observed clinically in patients with Chiari I with PCMR imaging. Model boundaries were assumed rigid and immobile, even if the cord and tonsils in vivo are known to move with the pulsating CSF. The extent of this motion is directly affected by medical disorders (arachnoidal adhesions, tethering, and so forth), and measurements depend on factors like measurement site, phase-contrast sequence, and temporal sampling rates. However, according to Levy,13 cord deflections tend to be <1 mm, so the assumption of rigidity and immobility seems justified. Oldfield et al,14 by using sonography in patients who were undergoing cranio-occipital decompression, reported abrupt downward systolic movement of the tonsils. These displacements of the tonsils, if they occur in awake unoperated patients with Chiari I, may increase CSF pressures and magnitudes above the levels that we found. The assumption of plug flow at model ends did not likely affect simulated flow patterns because the region of study was relatively far from the ends. Also, starting CSF flow simulations from a nonphysical rest seems justified because periodic flow patterns stabilized after 2–3 cycles.
Our idealized mathematic model allowed full control of study parameters, circumventing the problem of individual variations met in typical patient group studies. The results of the simulations in this study agree with previous reports on CSF velocities in patients with Chiari I. Our results can only be compared with clinical reports in which axial PCMR sections have been obtained. The peak velocities of 9–10 cm/s that we calculated compare well with previous measurements.1,5 Cyclic CSF pressure gradients through the cardiac cycle have not, to our knowledge, been reported. In an experimental study2 with animals, the simulation of tonsillar herniation with a balloon catheter increased pressure gradients as did the herniated tonsils in our model. We found Reynolds numbers in this model similar to those in the normal idealized model, suggesting that herniated tonsils change the Reynolds numbers in only small portions of the total subarachnoid space. A finding relevant to the debate on syrinx formation is the locality we observed in flow distortion. Flow velocities were clearly elevated at the level of the tonsils but were almost immediately restored above and below (Figs 2 and 6). Often, a syrinx develops far below the herniated tonsils. In such cases, our results suggest that flow patterns at the level of syrinx formation are not abnormal, implying that trigger mechanisms other than local flow velocity changes should be sought.
The significance of these results is 2-fold. First, they show that tonsillar ectopia causes increased pressure gradients and complexity of flow patterns along the cord and in axial sections. These are accompanied by amplified flow jets. Second, they show that CFA applied to idealized models of the subarachnoid space may help determine the effect of specific anatomic abnormalities on CSF flow patterns. Additional CFA studies to measure the effect of posterior fossa dimensions, of spinal canal tapering, of heart rate, and of syrinx formation on CSF flow are warranted. Finally, we stress the need to evaluate the optimal size and extent of decompressive surgery to normalize CSF flow dynamics, another pressing issue that can be safely studied with mathematic models.
Footnotes
-
Svein Ohm Linge was supported by a Center of Excellence grant from the Norwegian Research Council to Center for Biomedical Computing at Simula Research Laboratory.
Indicates open access to non-subscribers at www.ajnr.org
References
- Received October 14, 2010.
- Accepted after revision December 6, 2010.
- © 2011 by American Journal of Neuroradiology
In this issue


Jump to section
Related Articles
Cited By...
- Cerebro-spinal Flow Pattern in the Cervical Subarachnoid Space of Healthy Volunteers: Influence of the Spinal Cord morphology
- Spinal Fluid Biomechanics and Imaging: An Update for Neuroradiologists
- Simulating CSF Flow Dynamics in the Normal and the Chiari I Subarachnoid Space during Rest and Exertion
- Patient-Specific 3D Simulation of Cyclic CSF Flow at the Craniocervical Region