
Article Figures & Data
Figures
- Fig 1.
The idealized model (A) of a subarachnoid space with herniated tonsils and the original model (B) with normally positioned tonsils. The models are shown with sagittal MR images illustrating a typical normal individual and a typical Chiari I malformation. For the normal model, a midline sagittal plane is shown and for the tonsillar herniation case, its paramedian through the nearest tonsil. A white reference line indicates the midpoint of the model at the correlate of the craniovertebral junction. The extensions to the model to facilitate the description of boundary conditions are demonstrated by the red lines. Anterior is to the reader's left and posterior to the right.
- Fig 2.
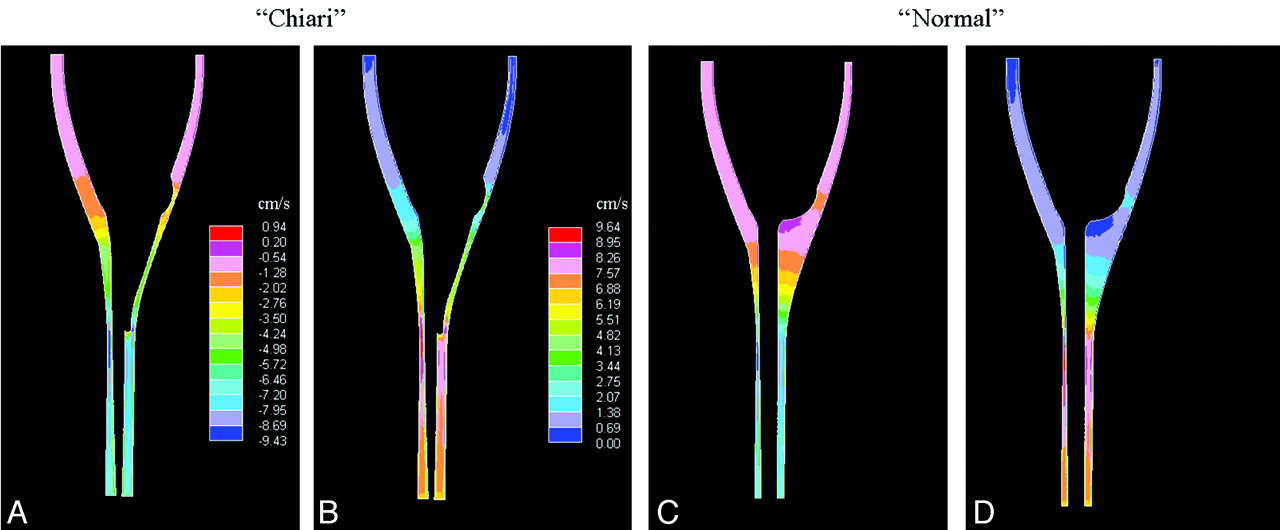
Sagittal plane sections showing flow velocities in the Chiari model at the time when the caudal volume flow rate is maximal (t = 0.25 seconds, A) and when cranial volume flow rate is maximal (t = 0.75 seconds, B). C and D, For comparison, corresponding sections in the normal model are shown. Velocity scales in are the same as in A and B, respectively. The plane selected for the Chiari model is paramidline to demonstrate the extension of the tonsils into the spinal canal.
- Fig 3.
Axial sections show flow velocity at the craniovertebral junction in the Chiari model at the time when caudal volume flow rate is maximal (t = 0.25 seconds). B, For comparison, a corresponding section for the original model (without tonsil herniation) is shown at an equivalent time in the cycle. Note that the distribution of peak velocities in both models is similar and that in the presence of tonsillar herniation, velocities are more than double those in absence of tonsillar herniation.
- Fig 4.
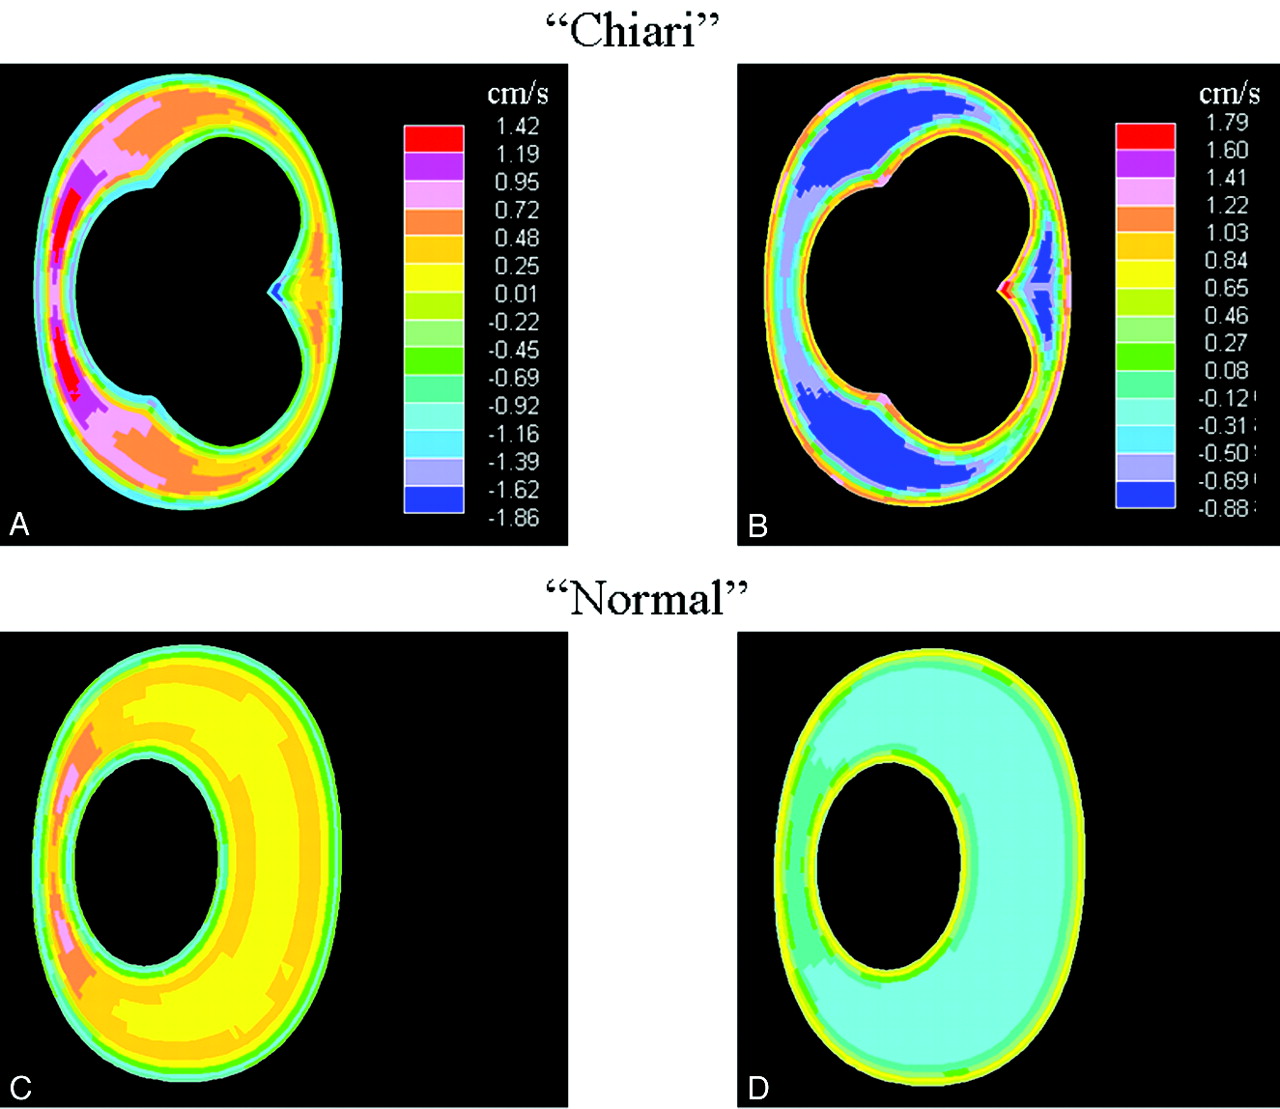
Axial sections showing the LR (A) and AP components (B) of the flow velocity vector at the craniovertebral junction in the Chiari model at the time when the caudal volume flow rate is maximal (t = 0.25 seconds). C and D, Similar velocity components are also shown, when cranial volume flow rate is maximal (t = 0.75 seconds). Velocity scales are the same as in A and B, respectively.
- Fig 5.
A single frame from the particle-tracking display for the Chiari model shows a complex pattern of CSF movement in 1 portion of the subarachnoid space. Note the arrows in multiple directions. The animation (http://home.simula.no/∼sveinlin/CSFChiari.m1v) displays CSF movement by means of particle tracking (left) and color coding (right) over 5 cardiac cycles, while the model is rotated 360°. The particle-tracking animation displays the direction of CSF flow; the color animation displays the velocity of flow. For the color display, velocities of ≥6 cm/s in the caudal direction are displayed in blue and ≥6 cm/s in the cephalad direction in red. The displays show complex flow patterns, especially when flow direction reverses. Flow transiently occurs in a direction perpendicular to that of the SI. Flow direction in different locations in the subarachnoid space changes at slightly different times in the cardiac cycle. Peak velocities in both caudal and cephalad directions appear to be reached in the spinal canal before they are reached at the craniovertebral junction. In comparison with the normal model (http://home.simula.no/∼sveinlin/CSFnormal.mpg), greater velocities are found in the craniovertebral junction and greater complexity of flow is demonstrated as flow direction changes.
- Fig 6.
Peak velocity components (absolute values) for the Chiari model (solid lines) and the normal model (dotted lines). The SI (black), LR (red), and AP (blue) velocity components are shown in 4 axial sections at 4 different times during the flow cycle, when flow changes direction from cranial to caudal (t = 0.00 seconds), at maximal caudal flow (t = 0.25 seconds), when flow changes direction from caudal to cranial (t = 0.50 seconds), and, finally, at maximal cranial flow (t = 0.75 seconds). Sections are 1 cm apart, with section 1 located at the craniovertebral junction, and sections 3–7, at successively more inferior locations, with section 7 being near the tip of the tonsils.
- Fig 7.
Peak SI flow velocities at the time when the caudal volume flow rate is maximal (t = 0.25 seconds), shown as a function of the axial section for the Chiari model and the normal model. Section 1 is at the craniovertebral junction, and section 8 is just below the herniated tonsils. Sections are 0.5 cm apart. The peak velocity for the Chiari model is greater at the foramen magnum and increases less steeply with distance.
- Fig 8.
Axial sections showing flow velocity at the craniovertebral junction in the Chiari model at the time when flow direction changes from cranial to caudal (A) (t = 0.00 seconds) and when flow direction changes from caudal to cranial (B) (t = 0.50 seconds). C and D, For comparison, corresponding sections are also shown for the normal model at these times in the cycle. Note that oppositely directed flow is observed at the boundaries of the subarachnoid space (ie, there is synchronous bidirectional flow). The velocities are greater in the Chiari model. Velocity scales are the same as in A and B, respectively.
- Fig 9.
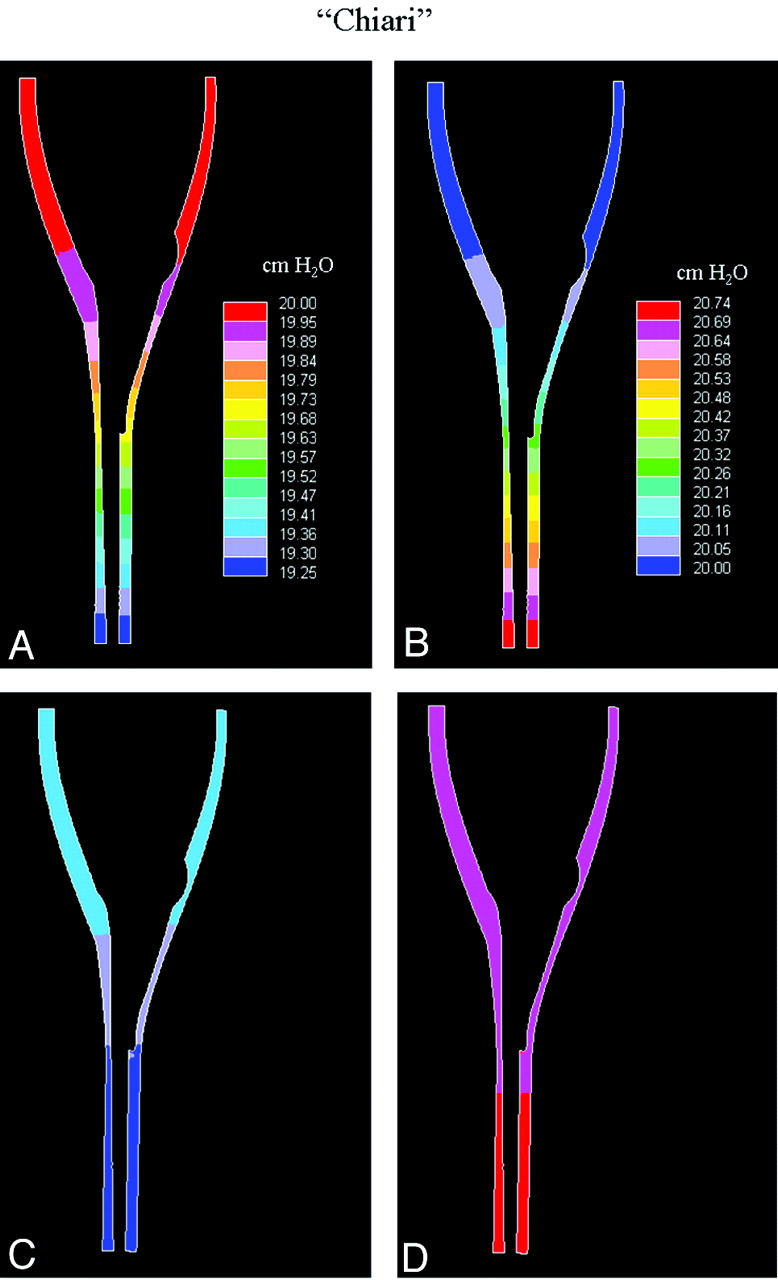
Sagittal plane sections showing pressure distributions along the cord in the Chiari model at the time when flow direction changes from cranial to caudal (A) (t = 0.00 seconds) and when flow direction changes from caudal to cranial (B) (t = 0.50 seconds). At these times, the pressure gradient along the cord is at its maximum. At the times of maximal caudal (C) (t = 0.25 seconds) and cranial (D) (t = 0.75 seconds) flow, the pressure gradient was at its minimum. Pressure scales are the same as in A and B, respectively.
- Fig 10.
Axial sections showing pressure at the time of maximal cranial flow (t = 0.75 seconds) in an axial section in the Chiari model (A) and in the normal model (B). The sections are 2 cm below the foramen magnum (Section 5). The increased in-plane pressure gradient in the Chiari model correlates with the increased in-plane flow velocity components. C and D, The corresponding LR velocity components are shown for the Chiari and normal models, respectively. The pressure scale in B is the same as the one in A, and the velocity scale in D is the same as the one in C.


Tables
- Table 1:
Pressure differences between top and bottom of the model at 4 points in time during the flow cycle for the Chiari and the normal modela
Model Pressure Differences (centimeters of water) Top to Bottom Systole Diastole t = 0.00 seconds t = 0.25 seconds t = 0.50 seconds t = 0.75 seconds Normal 0.66 0.10 −0.64 −0.07 Chiari 0.75 0.13 −0.74 −0.09 Increase 14% 30% 16% 29% -
a The gradient follows by dividing the difference by the distance from top to bottom. The 4 times correspond to when flow changes direction from cranial to caudal flow (t = 0.00 seconds), when caudal volume flow rate is maximal (t = 0.25 seconds), when flow changes direction from caudal to cranial flow (t = 0.50 seconds), and when cranial volume flow rate is maximal (t = 0.75 seconds). Note that the minus sign appears when pressure is highest at the caudal side of the geometry (ie, related to cranial flow). Note also that data from the times of flow reversal (ie, t = 0.00 and t = 0.50 seconds) are arbitrarily included in systole and diastole, respectively.
-
- Table 2:
Axial section pressures (maximum and minimum) in the Chiari model l, for the same sections as in Table 1a
Section Chiari Model, Axial Section Pressures Pmax/Pmin (centimeters of water) Systole Diastole t = 0.00 seconds t = 0.25 seconds t = 0.50 seconds t = 0.75 seconds 1 19.85/19.83 19.97/19.96 20.16/20.14 20.02/20.01 3 19.81/19.79 19.96/19.95 20.21/20.18 20.02/20.01 5 19.77/19.75 19.95/19.94 20.25/20.23 20.03/20.01 7 19.70/19.69 19.93/19.92 20.31/20.29 20.05/20.05 19.57/19.56 19.91/19.91 20.44/20.43 20.04/20.04 -
a In addition, 1 extra section (bottom row) is used 2 cm below the tip of the tonsils. Note that data from the times of flow reversal (ie, t = 0.00 and t = 0.50 seconds) are arbitrarily included in systole and diastole, respectively.
-
- Table 3:
Axial section pressures (maximum and minimum) in the normal model, for the same sections as in Table 1a
Section Normal Model, Axial Section Pressures Pmax/Pmin (centimeters of water) Systole Diastole t = 0.00 seconds t = 0.25 seconds t = 0.50 seconds t = 0.75 seconds 1 19.92/19.91 19.99/19.99 20.09/20.08 20.01/20.01 3 19.90/19.89 19.99/19.99 20.11/20.10 20.01/20.01 5 19.86/19.85 19.98/19.97 20.15/20.14 20.01/20.00 7 19.80/19.80 19.96/19.95 20.21/20.20 20.00/20.00 19.67/19.66 19.94/19.94 20.33/20.33 20.01/20.01 -
a In addition, 1 extra section (bottom row) is used 2 cm below the tip of the tonsils. Note that data from the times of flow reversal (ie, t = 0.00 and t = 0.50 seconds) are arbitrarily included in systole and diastole, respectively.
-
In this issue


Jump to section
Related Articles
Cited By...
- Cerebro-spinal Flow Pattern in the Cervical Subarachnoid Space of Healthy Volunteers: Influence of the Spinal Cord morphology
- Spinal Fluid Biomechanics and Imaging: An Update for Neuroradiologists
- Simulating CSF Flow Dynamics in the Normal and the Chiari I Subarachnoid Space during Rest and Exertion
- Patient-Specific 3D Simulation of Cyclic CSF Flow at the Craniocervical Region