
Abstract
BACKGROUND AND PURPOSE: Functional brain variability has been scarcely investigated in cognitively healthy elderly subjects, and it is currently debated whether previous findings of regional metabolic variability are artifacts associated with brain atrophy. The primary purpose of this study was to test whether there is regional cerebral age-related hypometabolism specifically in later stages of life.
MATERIALS AND METHODS: MR imaging and FDG-PET data were acquired from 55 cognitively healthy elderly subjects, and voxel-based linear correlations between age and GM volume or regional cerebral metabolism were conducted by using SPM5 in images with and without correction for PVE. To investigate sex-specific differences in the pattern of brain aging, we repeated the above voxelwise calculations after dividing our sample by sex.
RESULTS: Our analysis revealed 2 large clusters of age-related metabolic decrease in the overall sample, 1 in the left orbitofrontal cortex and the other in the right temporolimbic region, encompassing the hippocampus, the parahippocampal gyrus, and the amygdala. The division of our sample by sex revealed significant sex-specific age-related metabolic decrease in the left temporolimbic region of men and in the left dorsolateral frontal cortex of women. When we applied atrophy correction to our PET data, none of the above-mentioned correlations remained significant.
CONCLUSIONS: Our findings suggest that age-related functional brain variability in cognitively healthy elderly individuals is largely secondary to the degree of regional brain atrophy, and the findings provide support to the notion that appropriate PVE correction is a key tool in neuroimaging investigations.
Abbreviations
- AD
- Alzheimer disease
- APOE
- apolipoprotein E
- BA
- Brodmann area
- CERAD
- Consortium to Establish a Registry for Alzheimer's Disease
- CMRglc
- cerebral metabolic rate for glucose consumption
- DARTEL
- Diffeomorphic Anatomical Registration Through Exponentiated Lie Algebra
- FDG
- [18F]fluorodeoxyglucose
- FCHDR
- Framingham Coronary Heart Disease Risk
- FWHM
- full width at half maximum
- GM
- gray matter
- HWE
- Hardy-Weinberg equilibrium
- MCI
- mild cognitive impairment
- MNI
- Montreal Neurological Institute
- PET
- positron-emission tomography
- PVE
- partial volume effects
- SNP
- single nucleotide polymorphism
- SPAH
- São Paulo Ageing and Health study
- SPM
- statistical parametric mapping
- SVC
- small-volume correction
- VBM
- voxel-based morphometry
PET with FDG has emerged as a key tool for examining cerebral processes and is used to measure CMRglc, which indicates the level of neurosynaptic activity.1 A thorough understanding of the influence of age on glucose metabolism is important to ensure a better distinction between normal and pathologic brain changes associated with the process of human aging. The first wave of PET studies designed to investigate normal brain aging was during the 1980s and was characterized by an overall agreement that there is no glucose hypometabolism in individuals without dementia.2–6 Nevertheless, more recent studies have reported decrements in glucose metabolism in several prefrontal, parietal, and temporal areas during the life span, with relative preservation of limbic structures, the cerebellum, and occipital cortex.7–12
One possible explanation for the difference between newer and older reports of aging-associated brain functional variability is the improvement in PET scanners13 and the development of automated methods of analysis,14 which together have clearly increased the power to detect CMRglc changes associated with normal aging. However, it has been suggested that such aging-related CMRglc variability in cognitively healthy individuals could be due to PVE, which cause an apparent metabolic reduction in areas with steep GM atrophy and artificial metabolic preservation in areas with less pronounced GM reduction.6,12,15–17 According to this view, CMRglc decrements that persist after correction of PET images for PVE, representing hypometabolism that exceeds brain atrophy, should be interpreted as indicative of pathologic brain aging,18,19 thus placing PVE correction as a critical methodologic tool to differentiate normal and pathologic brain aging in PET studies. Accordingly, recent PET studies of glucose metabolism using PVE correction have suggested that regional hypometabolism exceeds brain atrophy in patients with MCI or AD,20–22 but not in normal aging.15,16 Nevertheless, to the best of our knowledge, no PET study has confirmed these findings in a representative sample of cognitively healthy elderly individuals.
With the purpose of dealing with the above-mentioned issue, this study tested whether there is regional cerebral age-related hypometabolism specifically in later stages of life through the analysis of PET images from a sample comprising individuals older than 65 years of age. To ensure that the effects of brain atrophy and demographic variables were taken into consideration, we chose to perform our functional analysis with and without correction for PVE and accounted for the effects of demographic variables through statistical approaches described in the next section.
Materials and Methods
Subjects and Assessment Schedules
The pool of possible participants for our cross-sectional investigation was from a sample of 248 elderly subjects without dementia classified according to their cardiovascular risk and selected for an ongoing morphometric MR imaging study by our research group. They were recruited initially from the data base of the SPAH,23,24 an epidemiologic investigation aimed at determining the incidence and prevalence of dementia, other mental disorders, and risk factors for these conditions. On the day of MR imaging, subjects were assessed with the Hamilton Depression Rating Scale25 and the Global Assessment of Function Scale from the Diagnostic and Statistical Manual of Mental Disorders-IV.26
The epidemiologic database from the SPAH was inspected so that we could ascertain the following exclusions: incomplete 2-year clinical follow-up; active hypo- or hyperthyroidism; epilepsy; diabetes mellitus; lung or liver diseases; major psychiatric disorders; and personal or first-degree family history of neurodegenerative disorders, such as AD. Subjects with gross brain lesions identified at MR imaging, such as tumors and silent brain infarcts, were also excluded.
Identification and exclusion of patients with dementia and other major psychiatric disorders followed the protocol developed by the 10/66 Dementia Research Group.27 This protocol included the following instruments: the Community Screening Interview for Dementia28; an adapted version of the CERAD 10-word list29; the animal naming verbal fluency task from the CERAD; the Geriatric Mental State30; a structured neurologic assessment; and a structured cardiology evaluation. The criterion for cognitive impairment was defined as a performance in the cognitive battery 1.5 SDs below the mean performance obtained from all subjects between 65 and 75 years of age from the original SPAH sample.
Data concerning age, blood pressure, smoking, and cholesterol level were extracted to generate the FCHDR score, a summary index that was devised to synthesize the combination of different cardiovascular risk factors.31 This score is especially suitable for the elderly population, which shows several overlapping risk factors,32 and represents a comprehensive and objective measure to be accounted for in the statistical analyses. The FCHDR calculated for each subject was then used to classify them into the following 3 subgroups according to their cardiovascular risk: low (FCHDR score, <9%); medium (FCHDR score, 10%–19%); and high (FCHDR score, >20%).
To reach sufficient statistical power, we used the software G*Power3 (http://www.softpedia.com/get/Science-CAD/G-Power.shtml)33 to perform a priori power analysis for the identification of significant correlations between age and glucose metabolism. Therefore, collection of PET data was devised for a minimum sample size of 34 to reach a power of 0.80 with an α error probability of .05 and an effect size of 0.40. On the basis of this process, we selected 20 elderly subjects from each of 3 subsets divided according to cardiovascular risk. Two subjects were excluded because their performance in the cognitive battery was in the MCI range (slightly lower than 1.5 SDs below the mean performance obtained from all subjects between 65 and 75 years of age from the original SPAH sample); thus, the resulting sample was 19 low-risk, 20 medium-risk, and 19 high-risk individuals from 66 to 79 years of age with available PET data for the current study.
Genomic DNA was extracted from ethylenediaminetetra-acetic acid–anticoagulated whole blood. The SNPs (rs429358 and rs7412) that determine the APOE isoforms were genotyped by Prevention Genetics (www.preventiongenetics.com) using the Amplifluor SNPs genotyping system (Chemicon International, Temecula, California). Tests for deviation from the HWE were performed for the whole sample of the SPAH. The 2 loci were tested and did not deviate from the HWE. This study received approval from the local committee for ethics and research, and written consent was obtained from all subjects.
Imaging Data Acquisition
MR imaging data were acquired by using a 1.5T Signa LX CVi scanner (GE Healthcare, Milwaukee, Wisconsin). The acquisition protocol included the following: 1) a dual spin-echo sequence of 120 transaxial sections across the entire brain (axial proton attenuation/T2), with TR/TE of 2800 ms/25 ms, 5-mm section thickness; 2) a T2-weighted fast spin-echo transaxial sequence with 88 images, TR/TE of 4200 ms/12.5 ms, echo-train length of 16, and a 5-mm section thickness; 3) a 3D gradient-echo (spoiled gradient-recalled echo acquisition) sequence of 124 sections with TR/TE of 121 ms/4.2 ms, a flip angle of 20°, a 220-mm FOV, 1.5-mm section thickness, NEX of 1 in a 256 × 192 matrix. Datasets were reconstructed and checked visually by an experienced radiologist, with the aim of identifying major artifacts during image acquisition and the presence of any gross brain lesions, such as tumors and silent brain infarcts (stroke or lacunar infarcts).
PET data were acquired on average 354.75 ± 215.84 days after the MR imaging acquisition by using a dedicated lutetium oxyorthosilicate-16-section PET-CT scanner (Biograph-16; Siemens, Erlangen, Germany) with a spatial resolution of 2.5-mm FWHM, 3.38-mm section thickness, and 500-mm axial FOV. Following exactly the same protocol, we determined blood glucose levels after at least 12 hours of fasting; then we administered an intravenous injection of 370 MBq (10 mCi) of FDG. Subjects remained in a quiet dimly lit room with their eyes closed, and PET imaging was initiated 60 minutes after FDG administration, by using 1-bed-position 3D protocol with 15 minutes of acquisition. Data were collected in 256 × 256 matrices, by using a smoothing factor of 5. Voxel size was set to 1.06 × 1.06 × 3.38 mm (x, y, z). Interactive reconstruction was applied by using 6.0 subsets and an interaction number of 16. Images were corrected for attenuation by using the CT algorithm.
Image Processing
All imaging data were processed with SPM software (SPM5; http://www.fil.ion.ucl.ac.uk/spm), operating in the Matlab software environment, Version 7.6 (MathWorks, Natick, Massachusetts).
For VBM analysis, MR images were first resectioned (2 × 2 × 2 mm); then we applied DARTEL,34 an algorithm for accurate diffeomorphic image registration widely validated as a toolbox for SPM5,35,36 to create a set of group-specific templates. The brain images were segmented, normalized, and modulated by using these templates. Additional warping from the MNI space was given to the brain images. Finally, GM probability values were smoothed by using a 12-mm FWHM Gaussian kernel.
The processing of PET datasets without PVE correction used a customized template created specifically for the present study. To build this template, we spatially transformed the original PET images to the standard SPM templates, on the basis of the MNI models.37 Such a spatial normalization step was restricted to linear 12-parameter affine transformations to minimize deformations of the original images. Subsequently, images were smoothed with an isotropic Gaussian kernel of 8-mm FWHM and averaged to provide the mean PET template in stereotactic MNI space. The processing of the original images was then carried out by using the study-specific template and comprised spatial normalization with 12-parameter linear as well as nonlinear (7 × 9 × 7 basis function) transformations. Images were resectioned by using trilinear interpolation to a final voxel size of 2 × 2 × 2 mm and smoothed by using a 12-mm Gaussian kernel.
For the analysis of PET data with correction for PVE, all images underwent a series of preprocessing steps before spatial normalization. First, individual MR images were subjected to coregistration onto their corresponding PET images. Then, coregistered PET images were corrected for PVE through the modified Müller-Gartner method, an optimized voxel-based algorithm that is fully implemented in pvelab software (http://nru.dk/downloads/software). This method is described in detail by Quarantelli et al38 and has been validated against several other algorithms as the most suitable for voxel-based analyses. PET datasets were then normalized with the optimal spatial parameters (7 × 9 ×7 basis function) of their corresponding MR imaging obtained from the DARTEL tool in SPM5 and smoothed with a 12-mm isotropic Gaussian kernel.
Statistical Analysis
Voxel-based linear negative and positive correlations between age and relative GM volume or relative metabolism in the overall sample of cognitively healthy elderly subjects were conducted by using SPM5 with the inclusion of the FCHDR group and the number of APOE ε4 alleles as covariates of no interest. The inclusion of such covariates was based on the fact that demographic variables significantly affect brain metabolic profiles in the general population.10,39,40 For the analysis of PET images, the resulting statistics at each voxel were thresholded at a 1-tailed P < .001 level of significance and displayed as SPMs into standard anatomic space, with a minimum cluster size of 20 voxels. This analysis was conducted by using the “proportional scaling” routine of SPM5 to control for individual variations in total FDG uptake. For the analysis of MR imaging data, which was devised to compare uncorrected metabolic data with GM structural variability, a less stringent 1-tailed P < .005 level of significance was accepted to enhance sensitivity. This analysis was conducted by using the amount of GM in the brain as a covariate.
Each SPM was inspected initially in a hypothesis-driven fashion, searching for clusters of voxels in brain regions where volumetric and metabolic decreases or relative increases due to aging had been described in normal aging (anterior cingulate gyrus, frontal and lateral temporal cortices, hippocampus, parahippocampal gyrus, and amygdala). This hypothesis-driven analysis was conducted by using the SVC approach, with the purpose of constraining the total number of voxels included in the analysis. Each region was circumscribed by merging the spatially normalized region-of-interest masks41 that are available within the Anatomical Automatic Labeling SPM toolbox. Five masks were used in each hemisphere, involving, respectively, the anterior cingulate gyrus, dorsolateral frontal cortex, dorsomedial frontal cortex, orbitofrontal cortex, lateral temporal neocortex (superior, middle, and inferior temporal gyri), and temporolimbic region (amygdala, hippocampus, and parahippocampal gyrus). Subsequently, the SPM maps were inspected for metabolic changes in unpredicted regions across the entire brain. For the analysis of PET images, any clusters of voxels with significant findings were reported if they survived family-wise error correction for multiple comparisons or cluster-level correction at the Pcorrected < .05 level.42 For the analysis of MR imaging data, a less stringent uncorrected P < .005 threshold level was accepted.
Finally, with the aim of identifying sex-specific age-related profiles that could be underestimated in the analysis of the overall sample, we repeated voxelwise calculations of linear correlation indices after dividing our sample by sex.
Results
Demographic and Clinical Data
The sample investigated in the current study included 58 cognitively healthy elderly subjects (mean age, 70.72 ± 2.77 years), among whom 3 were excluded from our analysis because of failure in genotyping the APOE isoforms. Thus, the final study sample comprised 55 subjects (33 men and 22 women) spanning 11 years of elderly life (age range, 66–77 years) with a mean age of 70.55 ± 2.56 years. Male and female subgroups did not differ in demographic characteristics such as age, years of education, global assessment of functioning, and APOE genotype. There was a statistically significant difference between men and women regarding the Hamilton Depression Rating Scale for depression scores, but both subgroups scored within the range of normal values in this scale. Men had higher FCHDR than women, with a greater proportion of subjects in the high-risk group. A summary of their demographic and clinical characteristics is given in On-line Table 1.
Voxel-Based Morphometry Analysis of MR Imaging Data for the Effects of Age on Relative GM Volumes
On-line Table 2 summarizes the significant clusters of relative age-related GM changes detected by using VBM. Local areas of negative correlations in the overall sample, indicating accelerated GM volume decrease, were observed in the right temporolimbic region, left dorsolateral frontal cortex, bilateral orbitofrontal cortex, and left temporal neocortex. We found no significant positive correlations indicating relative GM preservation in the overall sample.
The voxelwise search for significant negative correlations between regional GM volumes and age separately in men and women revealed local areas of negative correlations in the bilateral dorsolateral frontal cortex and temporal neocortex in men and in the right temporolimbic region and temporal neocortex in women. We found no significant positive correlations indicating relative GM preservation in male and female subgroups.
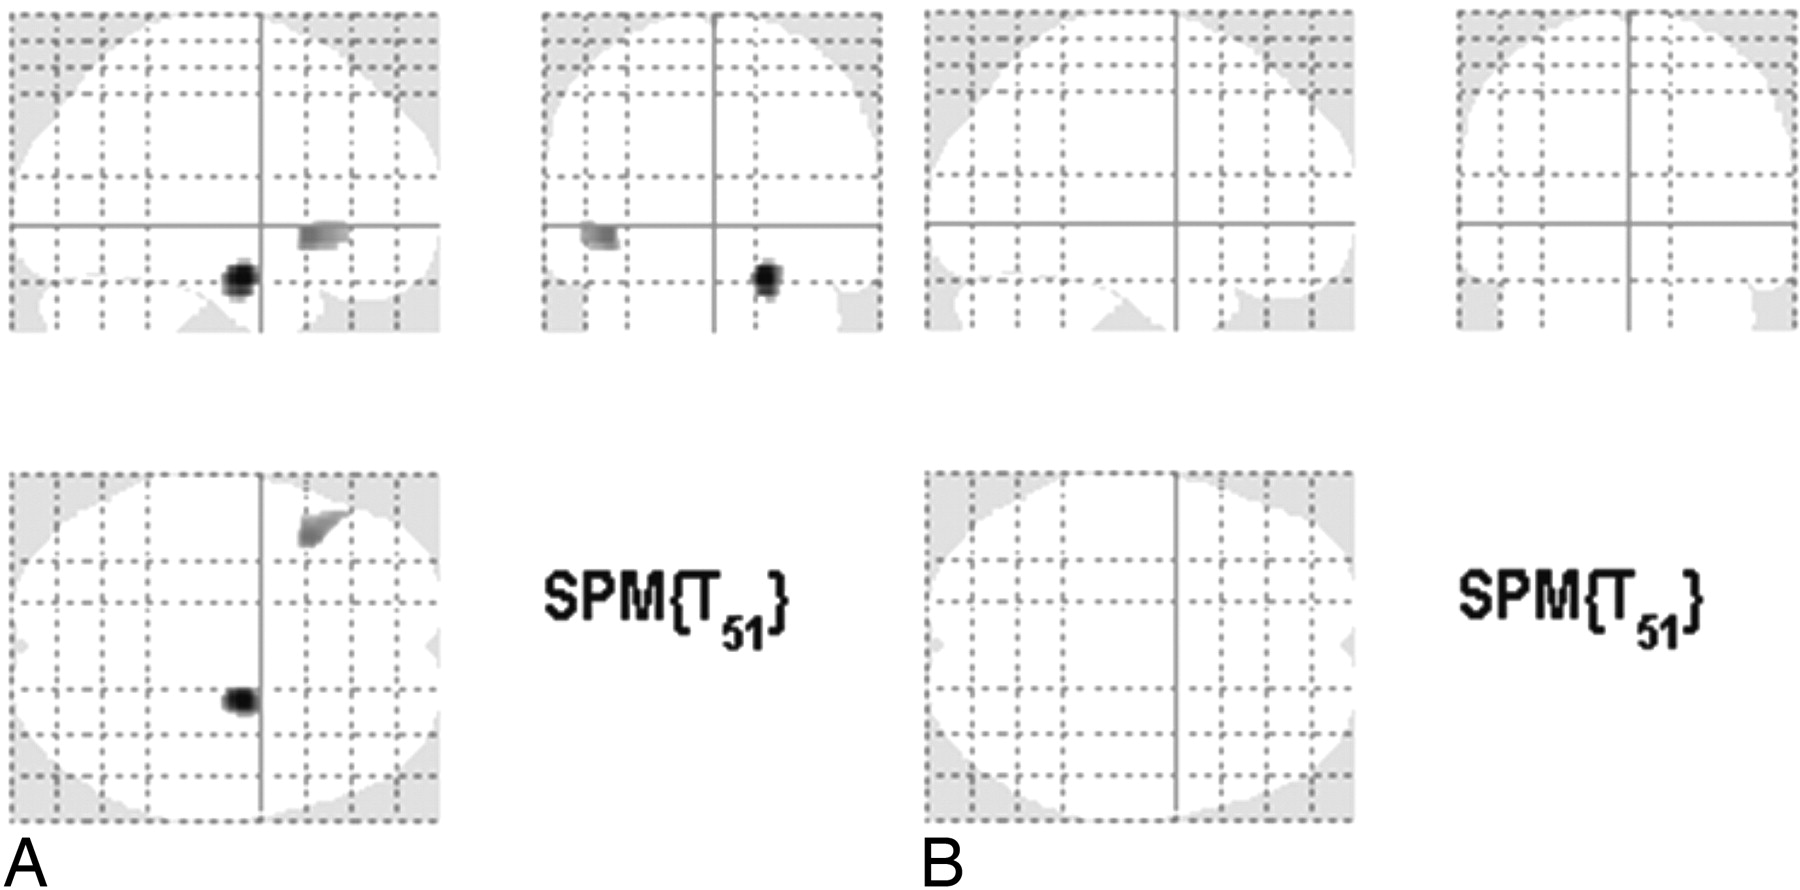
Voxel-Based Analysis of PVE Uncorrected FDG-PET Images for the Effects of Age on Relative Metabolism (On-line Table 3 and Fig 1)
The voxelwise search for correlations in the overall sample of cognitively healthy elderly individuals revealed 2 large clusters of age-related metabolic decrease, 1 in the right temporolimbic region, encompassing the hippocampus, the parahippocampal gyrus, and the amygdala; and another in the left orbitofrontal cortex, encompassing BA 47 of the inferior prefrontal gyrus. The division of our sample by sex revealed a significant sex-specific age-related metabolic decrease in 2 different brain structures, the left temporolimbic region of men and the left dorsolateral frontal cortex of women, encompassing BA 9 and the middle frontal gyrus. Our analyses did not yield any statistically significant positive correlations.

SPMs of the whole-brain search of significant negative correlations between relative metabolism and age in the overall sample of cognitively healthy elderly individuals (n = 55) at the z > 3.09 threshold, corresponding to P < .001, with an extent threshold of 100 voxels. A, Foci of negative correlations with the inclusion of the FCHDR group and number of APOE ε4 alleles as covariates of no interest in the analysis of PET images uncorrected for PVE. B, Lack of foci of negative correlations without the inclusion of covariates of no interest in the analysis of PET images corrected for PVE.
Voxel-Based Analysis of PVE-Corrected FDG-PET Images for the Effects of Age on Relative Metabolism
The voxelwise search for correlations between age and regional metabolism by using the PET datasets corrected for PVE in the overall sample did not yield statistically significant results or trends in any of the statistical analyses, either for positive or negative correlations, even at the uncorrected threshold (Fig 1).
Discussion
This cross-sectional MR imaging and FDG-PET study investigated the relationship between aging, relative GM volume, and relative metabolism in a large sample of cognitively healthy elderly subjects by testing linear correlations in images with and without correction for PVE. To the best of our knowledge, this study is the first of its kind to investigate metabolic profiles in a representative sample of the general elderly population. Also, this is the first neuroimaging investigation to perform PVE correction of PET images strictly in such an elderly population.
The voxelwise analyses of PET data without PVE correction revealed significant negative correlations in several brain structures, involving the orbitofrontal cortex, dorsolateral frontal cortex, and temporolimbic region. The location of these foci of inverse correlation is highly consistent with our current VBM findings and with data obtained in an expanded sample of subjects recruited from the same pool of elderly individuals investigated in the present PET study.43 When we applied PVE correction to our PET data, none of the above-mentioned significant correlations between FDG uptake and aging remained significant. Taken together, our findings of brain metabolic reductions due to aging are largely secondary to GM atrophy and that despite the volume loss that characterizes the aging process, the remaining cerebral tissue is shown to have a normal glucose consumption rate in cognitively healthy elders.
In a previous morphometric MR imaging study, significant foci of negative correlations between GM volumes and aging were found in the parahippocampal gyrus, in the amygdala, in the right orbitofrontal cortex, and in a few other neocortical regions, such as the dorsomedial frontal cortex and the temporal neocortex, even with the use of more stringent statistical thresholds, suggesting that for such a VBM analysis, a higher number of subjects might be needed to achieve adequate statistical power. Regarding the anterior cingulate, in which age-related metabolic reduction has been shown in younger samples,7,8 the lack of negative correlations in our analyses might reflect a specific pattern of the elderly population. According to the study of Fujimoto et al,7 the effect size of this correlation in normal aging during adult life is particularly high. Therefore, a small number of subjects would be necessary to accurately detect it, and it is unlikely that our lack of results is secondary to a type II error.
Although PVE are particularly critical in conditions in which GM atrophy is involved, such as normal aging and AD,16 the PVE correction for functional neuroimaging data has only recently gained a great deal of attention. This is mainly due to recent propositions regarding the potential of PVE correction to accurately differentiate normal and pathologic age-related processes through the dissociation between metabolic changes and brain atrophy.12,44 It has been shown that regional hypometabolism exceeds brain atrophy in patients with MCI,20,21 AD,22,45 and other types of dementia,46 but not in normal aging.12,15,47
Most interesting, the study of Kalpouzos et al8 was the only investigation on normal brain aging that reported areas of metabolic decline or preservation through the analysis of PVE-corrected PET images. Their analysis included 45 subjects with a mean age of 49.4 years, ranging from 20 to 83 years of age, and did not account for demographic variables. Indeed, all of the latter PET studies that used PVE-corrected data have investigated glucose metabolic changes associated with normal brain aging in samples spanning several decades of life,12,15,47 and there is a remarkable lack of information on the effects of PVE correction in PET studies conducted specifically during elderly stages of life. Our results give support to the notion that there is actually no regional brain hypometabolism specifically during the age range investigated and that the analysis of PVE-corrected PET images may play an important role in the differentiation between normal and pathologic brain changes associated with the aging processes.
The lack of cerebral hypometabolism during normal brain aging, assessed through the analysis of PVE-corrected PET data, might be related to the maintenance of global function and cognitive skills in elders without dementia. Further studies are necessary to test the relationship between cognitive deficits and CMRglc decrements that exceed brain atrophy to confirm this hypothesis.
Methodologic Considerations
The present study had methodologic limitations that warrant caution in the interpretation of its results. We cannot discard the presence of underlying degenerative diseases, such as preclinical AD, in some of the subjects included in the sample. To diminish the chance that our findings were secondary to such conditions, we selected the sample investigated among cognitively healthy individuals according to a transcultural protocol developed by the 10/66 Dementia Research Group27 and tested for APOE genotype, which was included in our analysis as a covariate of no interest. One potential factor that could have influenced the results of our study was the inclusion of subjects with conditions that might affect brain volume and function through vascular changes, such as dyslipidemia and hypertension.39,48 However, because we aimed to investigate brain aging in a representative sample of cognitively healthy elderly subjects, the exclusion of individuals with such prevalent chronic diseases would lead to results that might not reflect the reality of the overall elderly population. Because we had a pool of elderly individuals preclassified according to their cardiovascular risk, we were able to select our sample including the same proportion of subjects in each category of low, medium, and high cardiovascular risk. Moreover, the influence of cardiovascular risk was accounted for in our analysis by covarying results to the FCHDR.
This study used a cross-sectional design, in which correlations between CMRglc and age at specific time points were used to make inferences about how the aging process affects the brain structure with time. Therefore, replication of our results is warranted in longitudinal voxel-based studies involving the acquisition of serial PET measurements with time in the same subject samples.49
Finally, the lack of significant correlations in the analysis of PVE-corrected PET images could have been caused by a lack of power to reach a statistically significant threshold after correction of the correlations between age and regional metabolism for family-wise error. Nevertheless, it is not likely that metabolic changes were underestimated in our investigation, once the lack of statistically significant correlations was confirmed with the inspection of all SPMs with a less stringent cluster-level-corrected threshold. Also, the SVC approach, used with the purpose of constraining the total number of voxels included in the analysis, was intended to increase the sensitivity of our analysis in regions where CMRglc variability has been previously described.
Further studies with larger samples of elderly individuals and spanning a broader segment of elderly life are necessary to confirm our findings and are particularly critical to detect subtle age-related metabolic profiles characterized by a low effect size and, therefore, the need for higher statistical power.
In cerebral areas with accelerated brain atrophy, a delay between MR imaging and PET measurements could lead to the classification of white matter and CSF as GM in PVE-corrected data due to an altered proportion of brain tissue components related to brain aging. This misclassification could result in the underestimation of brain relative metabolism in atrophy-corrected images and in the overestimation of age-related metabolic decrease in these analyses. However, in the current study, PVE correction was shown to be effective and unaffected by such factors because none of the negative correlations between age and relative metabolism that were found in uncorrected data remained significant with the use of this methodologic approach.
Conclusions
This study provided evidence that glucose metabolism is not influenced by aging within a narrow age range of elderly life. Our findings indicate that aging-related functional brain variability detected in PET images of cognitively healthy elderly individuals is largely secondary to the degree of regional brain atrophy, and they provide support to the notion that appropriate PVE correction is a key tool in the investigation of biologic markers for the neurodegenerative disorders that are highly prevalent in elderly life. Further research is needed to confirm our findings and to investigate brain metabolic profiles in younger and older samples with narrow age ranges, given that brain aging does not follow a steady pattern across the life span.
Acknowledgments
We thank Paulo Andrade Lotufo, MD, Mauricio Wajngarten MD, and Claudia C. Leite, MD, for assistance in the development of this project.
Footnotes
This work was supported by the Wellcome Trust, UK (GR066133MA); the “Fundação Amparo a Pequisa Estado São Paulo” (04/15336–5, 04/12694–8, 06/04405–1), Brazil; and the Conselho Nacional de Desenvolvimento Científico e Tecnológico, Brasil, to M.S., P.R.M. and G.F.B.
indicates article with supplemental on-line tables.
Indicates open access to non-subscribers at www.ajnr.org
References
- Received June 19, 2010.
- Accepted after revision August 4, 2010.
- Copyright © American Society of Neuroradiology


