
Abstract
BACKGROUND AND PURPOSE: Recently, voxel-based statistical parametric images have been developed as additional diagnostic tools for AD. However these methods require the generation of a data base of healthy brain images. The purpose of this study was to produce and evaluate an automatic method using a data base−independent estimation system for the diagnosis of mild AD.
MATERIALS AND METHODS: We retrospectively selected 66 subjects, including 33 patients with early AD and 33 age-matched healthy volunteers. Individual brain metabolic images were obtained by using FDG-PET. These were transformed by using 3D-SSP. We then produced CADDIES, which compares the parietal and sensorimotor metabolic counts by using t tests. If parietal metabolism was significantly lower than the sensorimotor metabolism, the subject was automatically diagnosed as having AD. The FDG-PET images were also analyzed by using a previous automatic diagnosis system (CAAD) that is dependent on the construction of a “normal data base” of healthy brain images. Diagnostic performance was compared between the 2 methods.
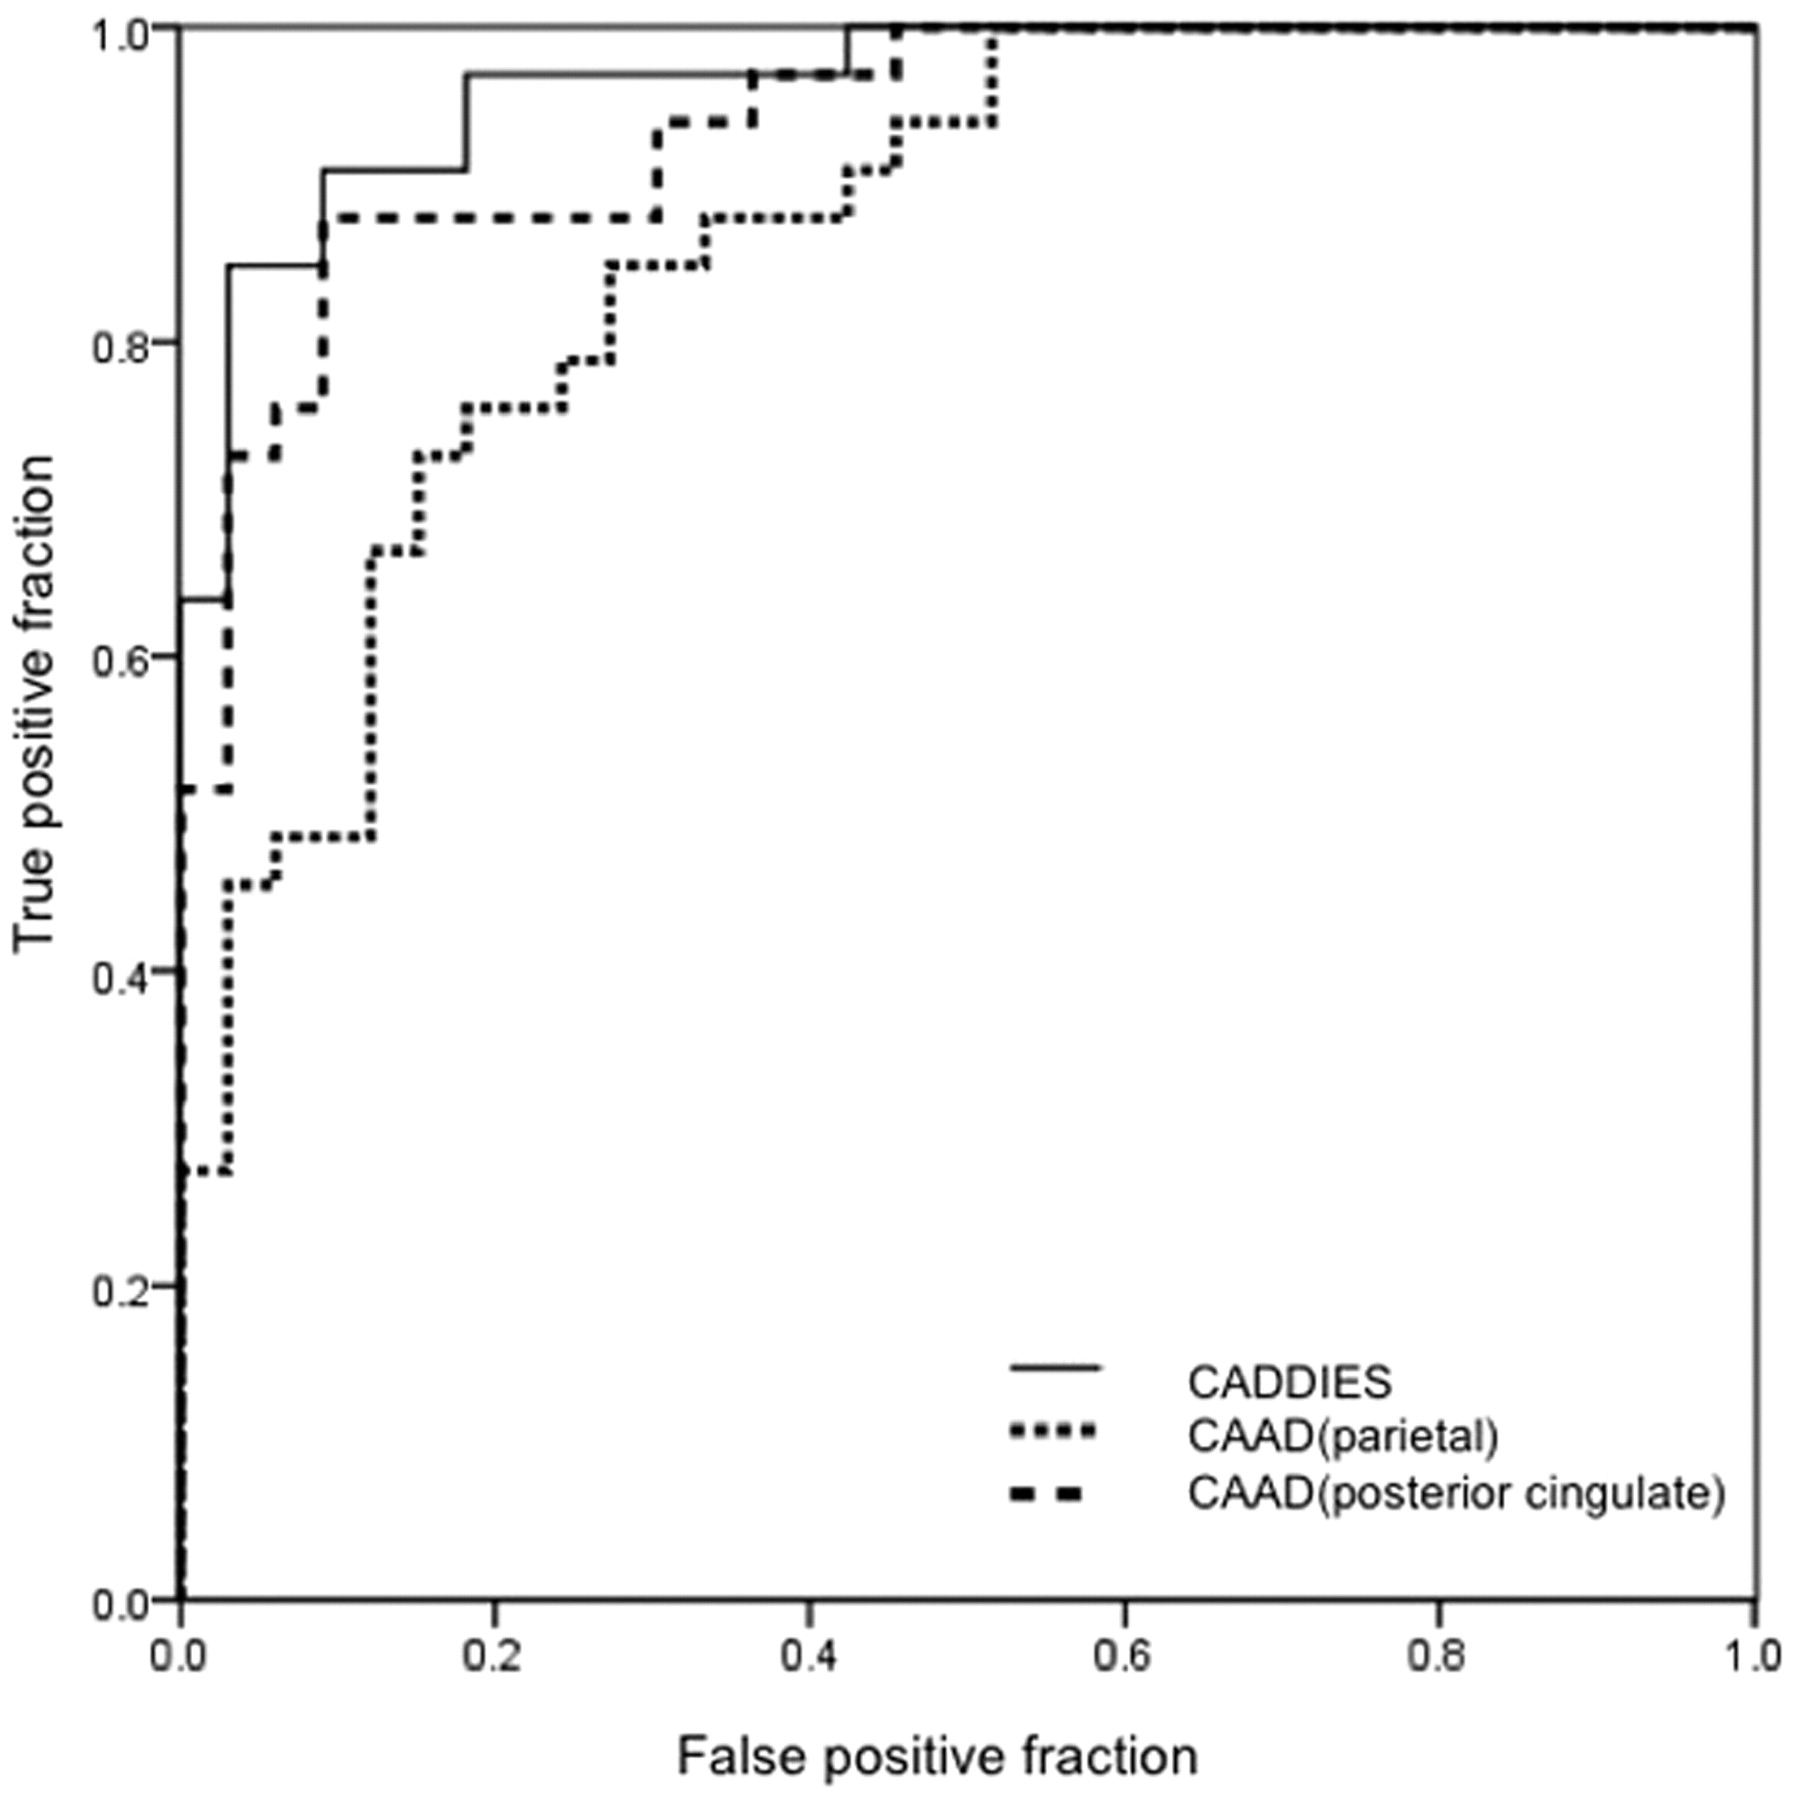
RESULTS: The CADDIES demonstrated a sensitivity of 88%, specificity of 79%, and accuracy of 85%, while the CAAD system demonstrated a sensitivity of 70%, specificity of 94%, and accuracy of 82%. The area under the ROC curve of CADDIES was 0.964. The areas under ROC curves of the CAAD method in the parietal and posterior cingulate gyri were 0.843 and 0.939, respectively.
CONCLUSIONS: The CADDIES method demonstrated a diagnostic accuracy similar to that of the CAAD system. Our results indicate that this method can be applied to the detection of patients with early AD in routine clinical examinations, with the benefit of not requiring the generation of a normal data base.
Abbreviations
- AD
- Alzheimer disease
- CAAD
- computer-assisted AD diagnosis system
- CADDIES
- computer-assisted diagnosis with a data base−independent estimation system
- DLB
- dementia with Lewy bodies
- FDG
- fluorodeoxyglucose
- FDG-PET
- fluorodeoxyglucose−positron-emission tomography
- 3D-SSP
- 3D-stereotactic surface projections
- MMSE
- Mini-Mental State Examination
- PET
- positron-emission tomography
- ROC
- receiver operating characteristic analysis
- VOI
- volume of interest
AD is a progressive neurodegenerative disorder of the central nervous system. Regional cerebral glucose metabolism measured with FDG-PET1,2 is established as a sensitive index of neuronal dysfunction. FDG-PET has revealed reduced glucose metabolism in the parietotemporal, frontal, and posterior cingulate cortices in AD.3 In contrast, glucose metabolism in the primary sensorimotor cortices, primary visual cortices, basal ganglia, thalami, and cerebellum is relatively preserved in AD.4,5 In the past, AD diagnosis has been aided by visual inspection of reduced metabolic regions on PET images. Recently, voxel-based statistical parametric images have been used as additional diagnostic tools.6 Published data regarding automated statistical image analysis have consistently demonstrated a high diagnostic performance of FDG-PET for distinguishing patients with AD from healthy individuals.7–9
Voxel-based statistical parametric analysis, however, requires the generation of a “normal data base” of healthy brain images. Generating such a data base requires the recruitment of healthy volunteers, and the time and effort involved make this process infeasible for some institutions. The sample size of a given normal data base affects the diagnostic performance of FDG-PET, which uses a statistical voxel-based approach. Moreover, using a data base from another facility may produce some artifacts because the margin of error depends on the specific scanner type and protocol, which differ between facilities. To solve these problems, we devised an automatic diagnosis method with a data base−independent estimation system. In AD-affected brains, metabolism in the parietal association cortices is significantly lower than that in the sensorimotor cortices. Although in DLB the parietal metabolism is significantly lower than sensorimotor metabolism, the differentiation of AD and DLB is considered to be the next step after distinguishing them from normal aging. In the current study, we used a voxel-based statistical system to directly compare these metabolic differences between healthy age-matched controls and patients with AD.
Materials and Methods
Subjects and PET Procedure
We selected subjects from a data base of patients with dementia registered at our institution. Our study was approved by the ethics committee of our institution. Informed consent was obtained from each subject after explaining the details of our imaging data base. From the data base, we selected consecutive patients between April 2000 and March 2002 with MMSE scores of >20 and clinical diagnoses of mild AD confirmed with >2 years of follow-up. We examined 66 participants in total: 33 patients with AD (mean age, 71.2 ± 2.5 years) and 33 age-matched healthy volunteers (mean age, 70.6 ± 4.2 years). The mean MMSE scores for the AD and healthy volunteer groups were 22.8 ± 1.7 and 29.9 ± 0.4, respectively. The mean clinical dementia rating score of the AD group was 1.0 ± 0.3. All patients with AD fulfilled the criteria of the National Institute of Neurological and Communicative Disorders and Stroke and Alzheimer's Disease and Related Disorders Association for probable AD.10 All patients were examined by both neuropsychologists and psychiatrists. Patients also underwent electroencephalography, laboratory and neuropsychological tests, MR imaging, and MR angiography of the neck and head.
The details of our MR imaging and PET scanning methods are described elsewhere.5 In brief, all subjects fasted for 4 hours before PET scanning, and following a transmission scan, a 12-minute emission scan began 60 minutes after intravenous injection of 185–296 MBq of FDG. PET images were obtained by using a Headtome IV scanner (Shimadzu, Kyoto, Japan). Data were collected in 128 × 128 matrices. The section interval was 6.5 mm when the z-motion mode was used.
Automatic Diagnosis with the Data Base−Independent Estimation System
We developed our CADDIES on the basis of the hypothesis that metabolism in the parietal association cortices would be significantly lower than that in the sensorimotor cortices in AD brains.4,5 Glucose metabolism in the posterior cingulate and precuneus is also decreased in AD brains. Although the metabolic rate in the posterior cingulate and precuneus is much larger than that in the sensorimotor cortices in healthy brains, it is not easy to detect the difference when comparing metabolic rates in the posterior cingulate and precuneus with those in sensorimotor cortices in AD and healthy brains. Therefore, in this study, we adopted the comparison between the parietal association and sensorimotor metabolisms.
All the datasets were first transformed by using stereotactic anatomic standardization and surface counts extraction performed with NEUROSTAT software, which forms the basis of 3D-SSP (Dr Minoshima, Department of Radiology and Bioengineering, University of Washington, Seattle, Washington).11 The metabolic counts in each voxel in the parietal and sensorimotor cortices were then calculated by using a VOI template (Fig 1). To produce this VOI template, we used data investigated in a previous study.8 The area for parietal association cortices was adapted from the template produced from the comparison between the 20 patients with AD and 20 healthy controls.8 The area for sensorimotor cortices was also produced from the comparison between the AD and healthy control groups; the relative FDG uptake counts were significantly higher in the AD group than in the controls. The number of voxels in the unilateral sensorimotor and parietal areas was 248 and 317, respectively. Using this VOI template, we then compared the sensorimotor and parietal metabolic counts in the subjects in this study voxel by voxel by using t tests. The threshold was set at P < .05, and if the unilateral or bilateral parietal metabolic counts were significantly lower than sensorimotor metabolic counts, the subject was automatically diagnosed as having AD.

Region-of-interest map for the CADDIES. Checkerboard pattern indicates sensorimotor area; dark gray, parietal area.
Comparison of Diagnostic Performance of CADDIES and a Computer-Assisted Data Base−Dependent Diagnosis System
To evaluate the diagnostic performance of the CADDIES system, we compared it with a data base−dependent computer-assisted diagnosis system (CAAD8), which was previously reported to show diagnostic performance equal to that of visual inspection by experts. Individual FDG-PET images were analyzed with CAAD and diagnosed as healthy or AD. The CAAD method produces summed z scores in the parietal and posterior cingulate gyri by performing statistics with a healthy subjects' data base. If >2 areas of summed z scores exceed the thresholds, the subject is diagnosed as having AD.
In addition, we performed ROC. ROC curves were created from summed t values obtained from CADDIES and summed z scores obtained from CAAD. Evaluation was based on the area under the curve. The sensitivity, specificity, accuracy, and the area under the ROC curve were calculated for the 2 systems, and diagnostic performance was compared.
Results
The CADDIES system indicated that metabolism in the parietal association cortices in 29 patients with AD and 6 healthy controls was significantly lower than that in the sensorimotor cortices. This system demonstrated a sensitivity of 88%, specificity of 79%, accuracy of 85%, a positive predictive value of 83%, and a negative predictive value of 87%. For the CAAD methods, 23 patients with AD and 2 healthy controls exhibited >2 areas of summed-z scores that exceeded the threshold. The CAAD system demonstrated a sensitivity of 70%, specificity of 94%, accuracy of 82%, a positive predictive value of 92%, and a negative predictive value of 76%. Thus, our new data base−independent system performed at a diagnostic accuracy similar to that of CAAD methods.
The ROC curves for discriminating patients with AD from healthy control subjects were compared between the CADDIES and CAAD methods (Fig 2). The area under the ROC curve for the CADDIES system was 0.964. The area under ROC curve for the CAAD method in the parietal and posterior cingulate gyri was 0.864 and 0.938, respectively. The area under the ROC curve for the CADDIES system was not significantly different from that for the CAAD method.

ROC curves for patients with AD versus healthy controls with our new system (CADDIES) and CAAD.
Discussion
To the best of our knowledge, this is the first study to report the usefulness of an automatic data base−independent diagnosis system for AD by using FDG-PET and 3D-SSP. Our primary finding was that a data base−independent system showed equal diagnostic performance to a computer-assisted diagnosis system using a data base.
Previous work has shown reductions of neural metabolic activity in AD to be most prominent in the parietotemporal and posterior cingulate cortices and to extend to the frontal areas in advanced disease. In contrast, glucose metabolism in the primary sensorimotor cortices, primary visual cortices, basal ganglia, thalami, and the cerebellum is relatively preserved in AD.4,5 In particular, a pattern of parietotemporal and posterior cingulate cortical hypometabolism is considered a reliable hallmark of AD. These features of glucose metabolism in AD indicate that metabolism in the parietal association cortices may be significantly lower than that in the sensorimotor cortices. It is this hypothesis that led us to develop the automatic diagnosis system for AD by using a data base−independent system tested in the present study.
Published data using automated statistical image analysis have consistently reported the high diagnostic performance of FDG-PET for distinguishing patients with AD from healthy subjects. The t-sum method of Herholz et al7 demonstrated a good level of performance in distinguishing mild AD from relatively young healthy controls (mean age, 57 years of age), excluding the influence of aging by using regression analysis. This method enabled the identification of mild-to-moderate AD with a 93% sensitivity and specificity and of very mild AD with an 84% sensitivity and 93% specificity. The present study of a new automatic data base−independent diagnosis system for AD enabled identification of AD with 88% sensitivity, 79% specificity, and 85% accuracy.
By using an automated statistical approach, Chen et al12 showed that the sample size of a normal data bases affects the diagnostic performance of FDG-PET, and they recommended the inclusion of at least 10 subjects in the generation of normal data bases, though 20 is preferable.12 CADDIES does not require a normal data base but, nevertheless, obtained a diagnostic performance equaling that of data base−dependent voxel-based comparison systems. Yakushev et al13 evaluated the effect of the optimal count normalization reference region on the accuracy of FDG-PET in detecting AD-specific metabolic abnormalities by using voxel-based group comparisons among sensorimotor cortices, the cerebellum, and a cerebral global mean. They reported that the overall accuracy of discrimination was 94%, 91%, and 80% after normalization to sensorimotor cortices, cerebellum, and cerebral global mean, respectively. It was found that in general, normalization to the sensorimotor cortices was superior to cerebellar normalization, allowing the detection of more pronounced metabolic deficits and the more accurate discrimination of patients from healthy controls. Previously, we also reported that the sensorimotor cortex was an optimal reference region for normalization in the diagnosis of AD.8,14 The current findings support the selection of the sensorimotor cortices as a control region for comparison with the parietal cortices, indicating that AD affects glucose metabolism in specific cerebral regions.
The concept of CADDIES could be applied to further differential diagnosis of dementia by using other disease-specific regions of interest and could be applied to not only FDG-PET images but also single-photon emission tomography or MR images.
Conclusions
We developed an automatic diagnosis method with a data base−independent estimation system by using FDG-PET and 3D-SSP imaging. The diagnostic value of this system was found to be comparable with that of data base−dependent computer-assisted diagnosis systems. Most important, our new method can be applied to the detection of AD in patients in routine clinical examinations without requiring the time-consuming production of an institution-specific normal data base of FDG-PET images.
Acknowledgments
We thank Shuya Miki for providing and improving the interface 3D-stereotactic surface projections, which use the 3D-SSP program and was dedicated to this automatic method.
References
- Received July 2, 2010.
- Accepted after revision August 14, 2010.
- Copyright © American Society of Neuroradiology


