
Abstract
BACKGROUND AND PURPOSE: Optimal tube voltage and tube current settings are not well established. The purpose of our study was to investigate the image quality on 3D CT angiograms of the brain at various kilovoltage settings by evaluating the depiction of simulated intracranial lesions by using a vascular phantom.
MATERIALS AND METHODS: An anthropomorphic vascular phantom with superimposed bone skull structures was designed to simulate various intracranial aneurysms with aneurysmal blebs. We performed CT angiography by using a 64-detector row CT scanner for various effective tube currents with 4 tube voltages of 80, 100, 120, and 135 kV(p). Simulated aneurysm enhancement and image noise were quantified; SNR and CNR were calculated. The depiction of the simulated aneurysms and blebs on 3D CT angiograms obtained with the volume-rendering technique was subjectively assessed. The effective dose was calculated on the basis of a CTDIw. The results of several protocols were compared by using the Student t test.
RESULTS: At identical doses levels (CTDIw), the mean SNR and CNR at 100 kV(p) were significantly higher than those at 80, 120, and 135 kV(p); and the mean qualitative image score at 100 kV(p) was significantly superior to those at 80 and 135 kV(p).
CONCLUSIONS: Our phantom study suggests that the tube voltage of 100 kV(p) is desirable for cerebral 3D CT angiograms, and the higher or lower kilovoltage settings may result in the degradation in diagnostic image quality.
Abbreviations
- CNR
- contrast-to-noise ratio
- CTDIw
- weighted CT dose index
- kV(p)
- kilovolt (peak)
- MDCT
- multidetector row CT
- ROI
- region of interest
- SNR
- signal-to-noise ratio
CT angiography has increasingly been recognized as an efficient noninvasive imaging method in the evaluation of patients with suspected intracranial aneurysms. The recent introduction of MDCT can offer volumetric acquisition with considerable improvement in the image quality and spatial resolution. A recently published series has shown that 64-detector row CT angiography is an imaging method with a good interobserver reproducibility and a high sensitivity and specificity for the detection and the morphologic evaluation of intracranial aneurysms, though MDCT angiography still has limited sensitivity in detecting aneurysms of <3 mm.1 On the other hand, there is a trend toward an increased radiation dose with MDCT compared with the dose used for single-detector row CT.2,3 Therefore, the evaluation of potential options for dose reduction is important and has become the focus of research.4–7
In an attempt to mitigate the hazards of radiation exposure, various technologic- and patient-based strategies have been evaluated to optimize the tube voltage and tube current settings.6,8–10 Ertl-Wagner et al9 have reported that higher tube voltage resulted in better image quality. However, their study was conducted to evaluate the 80 kV(p) techniques for lowering the radiation dose; therefore, the tube currents were not increased when 80 kV(p) was used. On the other hand, some investigators recommended low-tube-voltage scanning with properly adjusted tube currents for reducing the radiation dose at cerebral CT scanning.3,10 Waaijer et al3 reported that, in a phantom study, with identical CT dose index volume, a tube voltage of 90 kV(p) resulted in a 45%–52% increase of SNR2 compared with SNR2 at 120 kV(p). An important limitation of the study of Waaijer et al was their phantom design without superimposed bone skull structures; the phantom, which could not produce the x-ray attenuation or scatter of a skull, may have collected much more radiation exposure for generating these images than would have been the case in a human examination.
Some researchers, for evaluation of the normal small vessels in patients, reported better image quality at 80 or 90 kV(p) scanning than at 120 kV(p).3,10 However, they have not evaluated the diagnostic value of cerebral vascular lesions such as intracranial aneurysms. Moreover, to our knowledge, there have been no studies on the evaluation of the ability of 3D CT angiograms with MDCT to delineate cerebral vascular lesions at various kilovoltage settings. Thus, the purpose of our study was to investigate image quality on 3D CT angiograms of the brain at various kilovoltage settings by evaluating the depiction of simulated intracranial aneurysms and aneurysmal blebs by using an anthropomorphic vascular phantom with superimposed bone skull structures.
Materials and Methods
Phantom Design
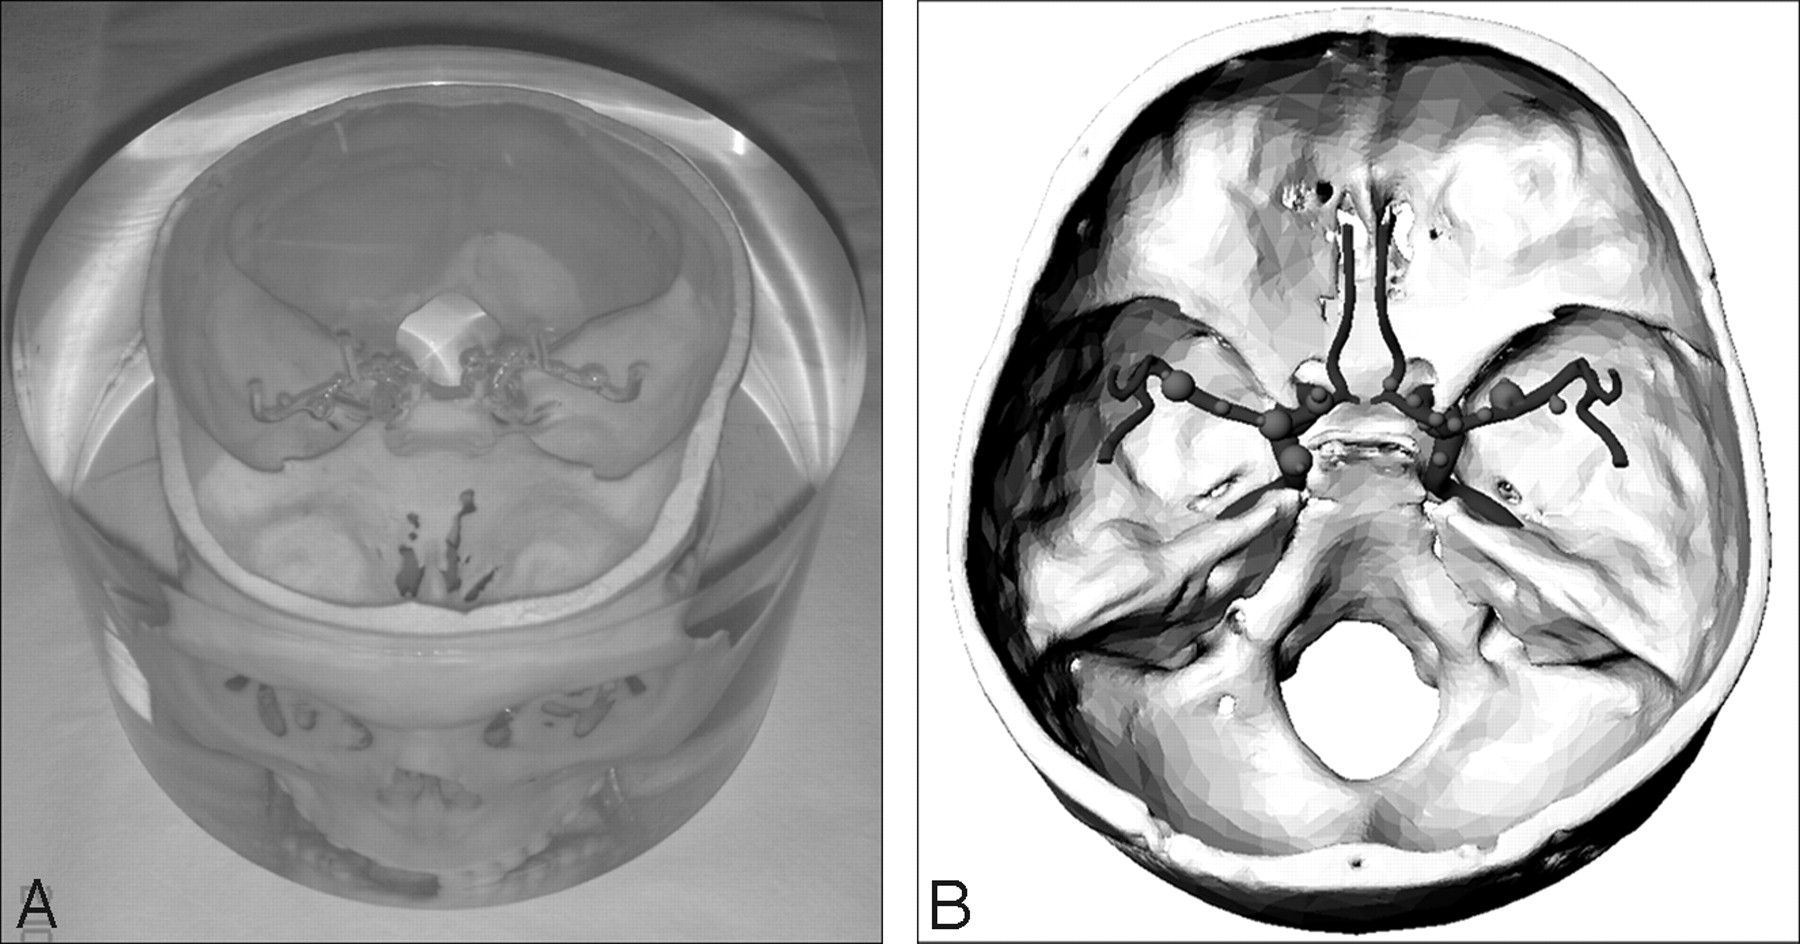
An anthropomorphic vascular phantom (Renaissance of Technology, Shizuoka, Japan), which consisted of a 19-cm-diameter cylinder made of silicone rubber, was designed to simulate the intracranial arteries with various intracranial aneurysms; the arteries and aneurysms were bored through the silicone rubber (Fig 1). Two types of simulated aneurysms (8 aneurysms with diameters of 3 mm and 6 with diameters of 6 mm) were placed on the simulated internal carotid and middle cerebral arteries. Of the 14 aneurysms, 6 had an aneurysmal bleb with a diameter of 2 mm, which was placed at a tip onto the surface of the aneurysm. This phantom also had superimposed bone skull structures, which were made of gypsum.

Photograph (A) and schematic drawing (B) of the anthropomorphic vascular phantom used in this study.
Image Acquisition
All CT examinations were performed with a 64-section scanner (Aquilion 64; Toshiba Medical Systems, Tokyo, Japan). Before the phantom study, by using CT angiograms obtained with 5 clinical patients, we calculated the CNR of the internal carotid artery with respect to the background (brain parenchyma) by drawing a 2-mm2 ROI. For the clinical patients, the scanning parameters were a tube current of 200 mA, tube voltage of 120 kV(p), a detector collimation of 64 × 0.5 mm, beam pitch of 0.641:1, and a 0.75-second gantry-rotation time. The CNRs were calculated as follows: (ROIa − ROIb) / SDb, where ROIa and ROIb were the CT numbers of the artery ROI, and background ROI, and SDb [background noise] was the SD of the CT numbers of the background. The mean CNR with clinical patients was 16.0 ± 2.4. To emulate the clinical conditions for CT angiography, we examined the vascular phantoms filled with various concentrations of nonionic contrast material (iohexol, Omnipaque 300 [300-mg iodine per milliliter]; Daiichi Sankyo, Tokyo, Japan) and distilled water, and we prepared 2 kinds of contrast material concentrations (20 and 15 mg I/mL). The CNRs obtained with the vascular phantoms by using the same CT parameters as in the clinical patients were 13.4 and 17.8 at 15 and 20 mg I/mL, respectively. These 2 kinds of contrast material solutions were prepared just before scanning to prevent settling of the solution. Then, we sank the vascular phantom into a column-shaped container filled with the iodinated solutions so as to fill the hollow intracranial arteries and aneurysms of the vascular phantom with the contrast material without introduction of air bubbles.
By drawing a 20-mm2 ROI, we measured the CT number at 3 points (frontal bone, temporal bone, and occipital bone) of the calvaria on CT angiograms in 5 clinical patients who did not have bone lesions (2 men, 3 women; mean age, 66.2 years; range, 57–72 years) and the CT number at 5 points of the superimposed bone skull structures of the phantom. The mean CT number was 1017 ± 1.92 for the phantom and 853.6 ± 187.8 for the clinical patients.
Each vascular phantom with the iodinated solution was scanned with 4 tube voltages, 80, 100, 120, and 135 kV(p), in combination with various effective tube-current settings, which ranged from 110 to 470 mA (Table 1). For the standard 160-mm CT dose index phantom, a weighted average of the measurements obtained in the 4 peripheral positions and in the central position was used to calculate the CTDIw, which, in a static setup, is identical to the CT dose index volume. We could not perform the CT angiography at 80 kV(p) in high CT dose index volumes (48 and 53 mGy) because of a technical problem with MDCT system. For all CT angiograms, the following parameters were kept constant: a detector collimation of 64 × 0.5 mm, beam pitch of 0.641:1, and 0.75-second gantry rotation time. The images were reconstructed with a section thickness of 0.5 mm and a reconstruction increment of 0.5 mm.
Scanning parameters for CT angiography
Qualitative Image Analysis
SNR and CNR Measurements.
Measurements were obtained by 1 observer (Y.M.) at a workstation (Leonardo; Siemens, Erlangen, Germany). For 6 different aneurysms with diameters of 6 mm in the vascular phantom, we measured the mean CT number (attenuation) and SD by placing a circular ROI in the center of the simulated aneurysms. The ROI area was kept to 18 mm2. The SNR was calculated by dividing the mean CT number in the aneurysms by the SD. Additionally, we measured the CT numbers of the background (silicone rubber) by using the same ROI cursor for calculation of the background CNR of the aneurysms. The CNRs were calculated as follows: (ROIa − ROIb) / SDb, where ROIa and ROIb were the CT numbers of the background ROI, and SDb (background noise) was the SD of the CT numbers of the background.
Qualitative Image Analysis
A radiologist (Y.M.) interpreted the CT angiograms and selected the 8 simulated aneurysms with diameters of 3 mm and 6 blebs with diameters of 2 mm for the evaluation; the aneurysms containing air bubbles in the phantom lumen were eliminated in this process. The image quality of the CT angiography was evaluated by 2 experienced neuroradiologists (S.K, K.K.) together, according to the depiction of the aneurysms and blebs, and the final judgments were obtained by consensus. For interpretation of CT angiography, these radiologists were blinded to the CT imaging parameters (effective tube current, tube voltage). The volume-rendered display was used for this evaluation of CT angiography. In assessing the CT angiography, each image was analyzed separately, and only 1 image was shown at a time. The schematic drawing of an anthropomorphic vascular phantom was always used as the standard of reference (Fig 1B), and the radiologists rated the aneurysm and aneurysmal bleb depiction by using a 5-point scale as follows: 5 = excellent (an aneurysm or aneurysmal bleb was depicted with same quality, which was close to that at the schematic drawing), 4 = more than adequate (aneurysm or aneurysmal bleb was clearly depicted but image quality was somewhat reduced compared with that at the schematic drawing), 3 = adequate (depiction of the aneurysm or aneurysmal bleb was still sufficient), 2 = insufficient visualization, 1 = not visible. After determining consensus in each aneurysm as to the depiction of an aneurysm and aneurysmal bleb, a single neuroradiologist reviewer (S.K.) measured the width of the aneurysm on the 3D renderings of the CT angiography to evaluate the accuracy of aneurysm measurements by using the schematic drawing of the phantom as the standard of reference. The 8 simulated aneurysms with diameters of 3 mm (width of the aneurysm, 3 mm) were evaluated.
The CT angiograms were displayed and interpreted on a diagnostic monitor (Flexscan L365; EIZO NANAO, Ishikawa, Japan). An intuitive and efficient user interface allows the manipulation of these views in real-time, and the radiologists determined the threshold of vessel images in each subject by interactively observing the CT angiograms at the workstation.
Statistical Analysis
For each subset of CT images, the qualitative image scores and the objective image quality (background noise and SNR and CNR measurements) for the cerebral vascular lesions were reported as mean ± SD, and a paired t test (StatView, Version I-5.0; SAS Institute, Cary, North Carolina) was used to determine significant differences between the results of the following parameters: SNR, CNR, and qualitative image scores. A P value < .05 was considered to indicate a statistically significant difference.
Results
At identical doses levels (CTDIw), the background noise significantly increased as tube voltage decreased (P < .05) (Table 2). At identical doses levels, the mean SNR and mean CNR at 100 kV(p) from contrast material concentrations of 15 and 20 mg I/mL were significantly higher than those at 80, 120, and 135 kV(p) (P < .05) (Figs 2 and 3). For the mean qualitative image score with regard to the depiction of the simulated cerebral vascular lesions, 100 kV(p) was significantly superior to that at 80 and 135 kV(p) for both contrast material concentrations (P < .05) (Table 3 and Fig 4). When we compared them at identical doses levels (CTDIw), the mean qualitative image scores were higher at 100 than at 120 kV(p) at both contrast material concentrations, and there was a significant difference between 100 and 120 kV(p) in CT dose index volumes of 33, 38, and 43 mGy at contrast material concentrations of 15 mg I/mL (P < .05) (Table 3). At identical dose levels, the mean width of the aneurysm on CT angiography at 100 and 120 kV(p) more closely approximated 3 mm as the standard of reference than widths at 80 and 135 kV(p) for both contrast material concentrations (Table 4), while there was no difference between 100 and 120 kV(p).
Mean objective measurements of background noisea
Mean qualitative image scores for the depiction of simulated aneurysms and blebsa
Mean width of the 3-mm aneurysm measured with 3D renderings of CT angiographya

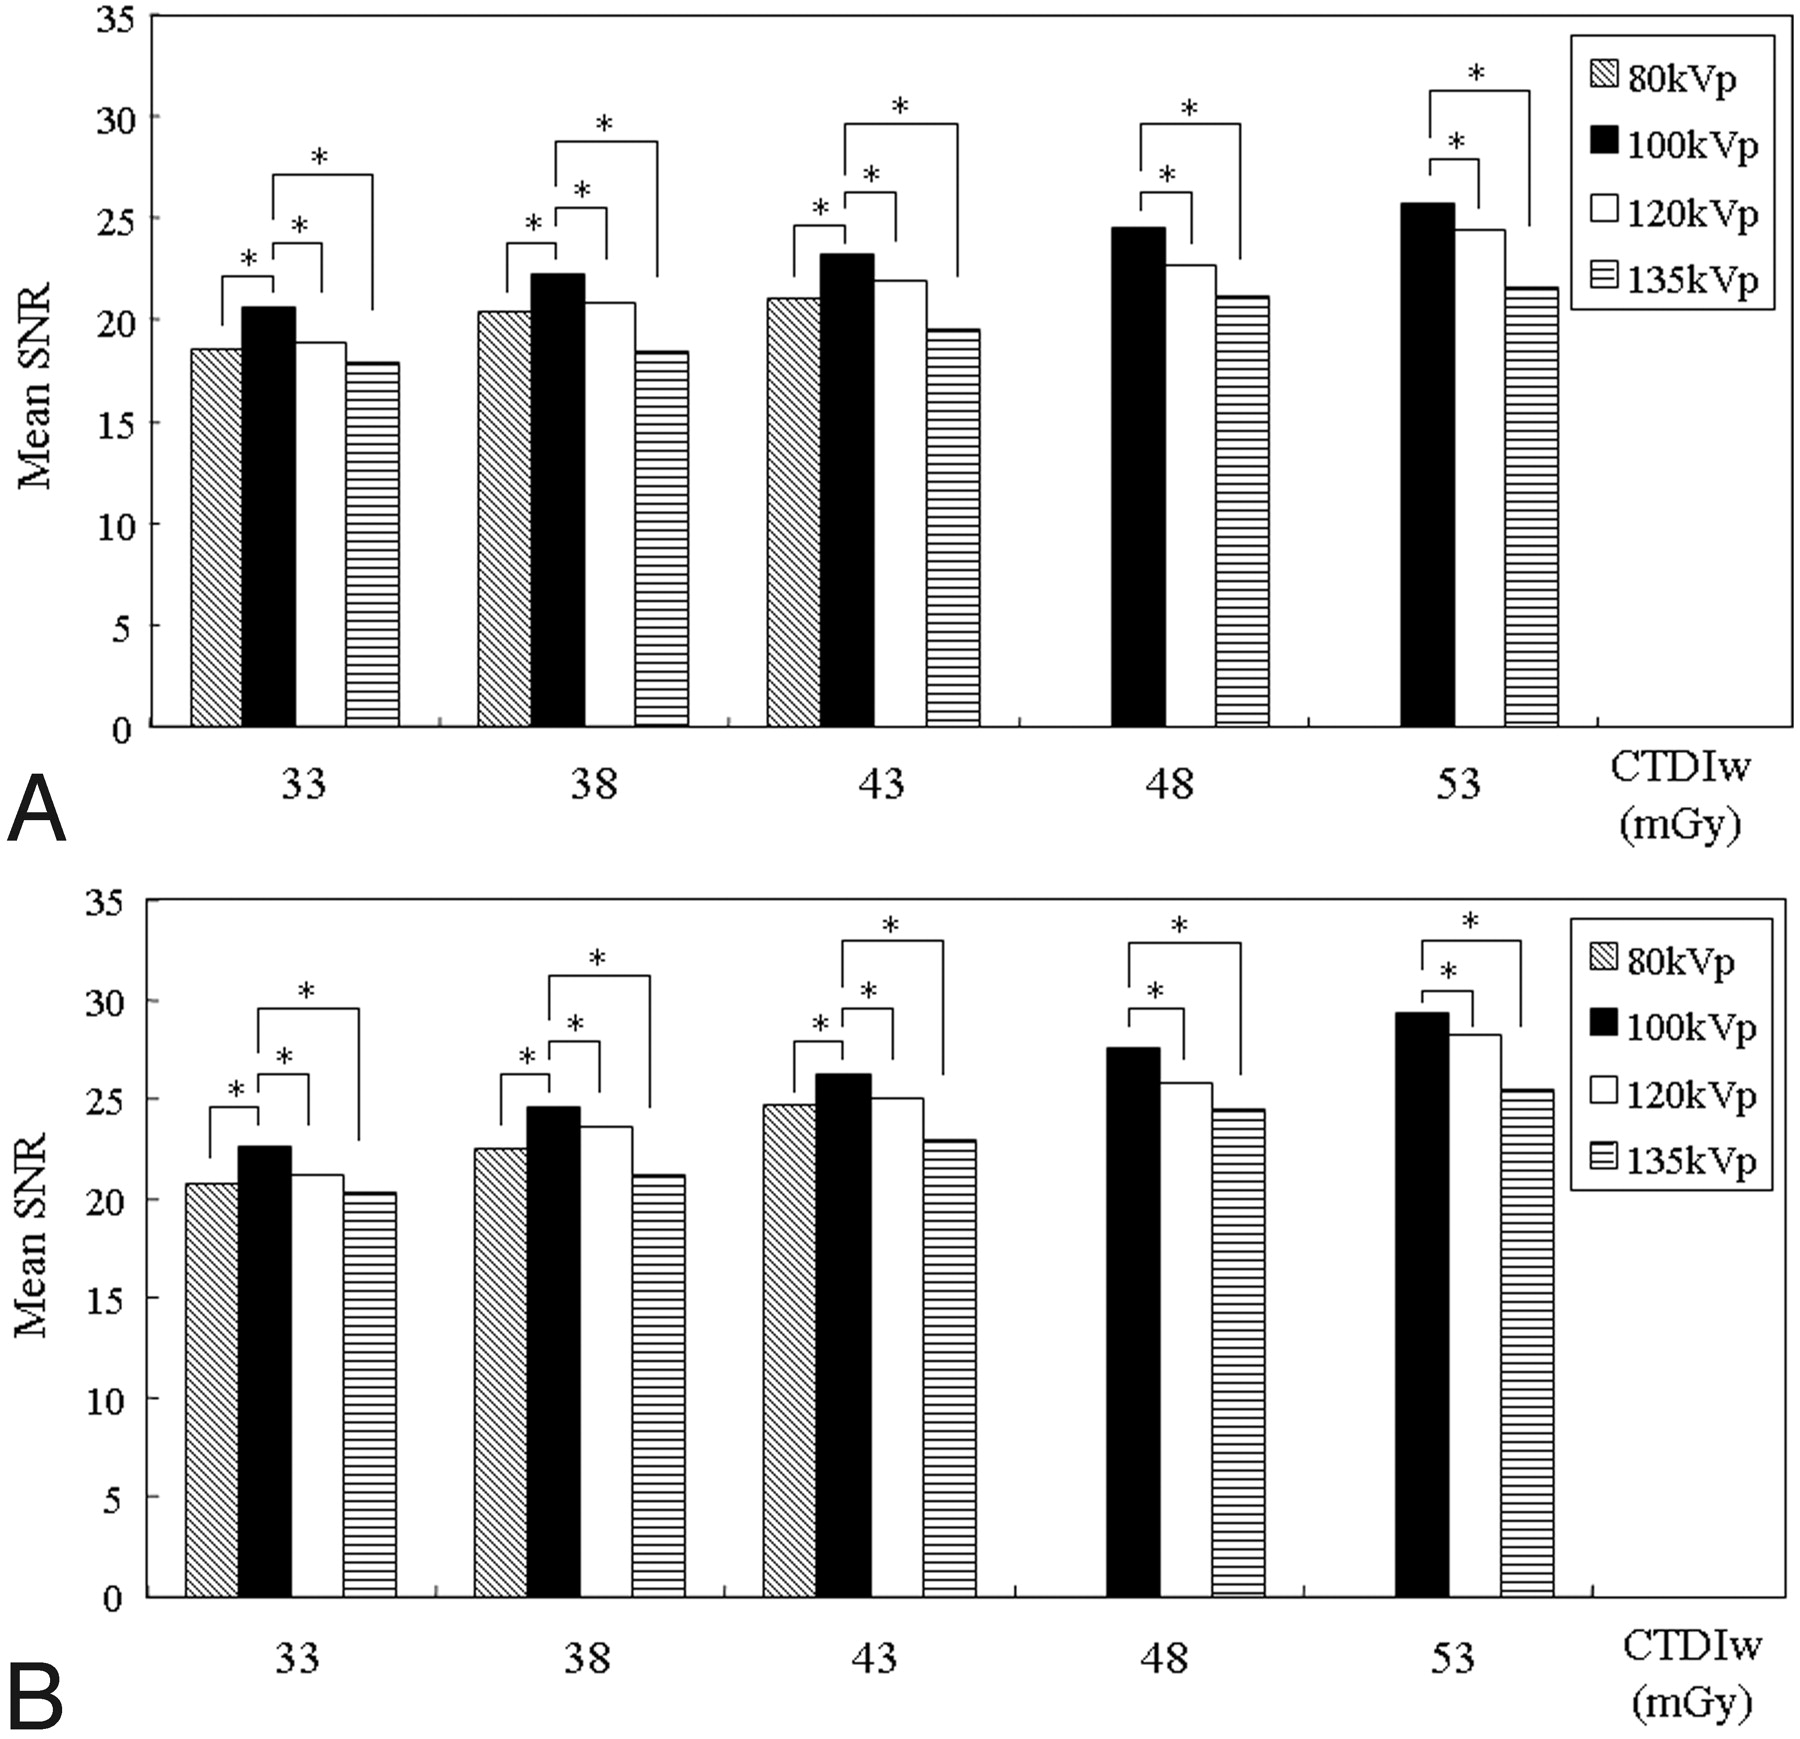
Graphs show the mean SNRs obtained at contrast material concentrations of 15 (A) and 20 mg I/mL (B). Asterisks show statistically significant differences at identical CTDIWs compared with the values of the standard CT image at 100 kV(p). At identical dose levels, the mean SNRs at 100 kV(p) from contrast material concentrations of 15 and 20 mg I/mL are significantly higher than those at 80, 120, and 135 kV(p) (P < .05).

Graphs show the mean CNRs obtained at contrast material concentrations of 15 (A) and 20 mg I/mL (B). Asterisks show statistically significant differences at identical CTDIWs, compared with the values of the standard CT image at 100 kV(p). At identical dose levels, the mean CNRs at 100 kV(p) from contrast material concentrations of 15 and 20 mg I/mL are significantly higher than those at 80, 120, and 135 kV(p) (P < .05).

CT angiograms at a concentration of 20 mg I/mL and at identical dose levels (CTDIw of 38 mGy). A, Tube voltage is 80 kV(p). B, 100 kV(p). C, 120 kV(p). D, 135 kV(p). For the mean qualitative image score with regard to the depiction of the simulated intracranial aneurysms (arrows) and aneurysmal blebs (arrowheads) on CT angiograms, 100 kV(p) is significantly superior to 80 and 135 kV(p) and is slightly superior to 120 kV(p).
Discussion
Precise visualization of the aneurysm neck and its relationship with parent vessels is a fundamental factor that must be assessed before choosing between an endovascular and neurosurgical treatment. Knowing the shape and size of the aneurysm also is essential before performing endovascular occlusion with coils. Recently, these can be obtained in part as 3D information by using CT angiography.11–14 Generally, in clinical settings, an evaluation of CT angiography is performed with 3D images to analyze an anatomic structure with multidirectional views. Therefore, the evaluation with a reconstructed 3D CT angiogram may be needed for an investigation of the image quality of CT angiography. In our study, we used a volume-rendering technique for reconstruction. In the widely applied postprocessing method for spiral CT data, volume rendering is the favored procedure for reconstruction.15,16
To our knowledge, previous studies have not assessed the highest or lowest possible kilovoltage settings for the given diagnostic task. In our study, among CT angiograms obtained at 4 kilovoltage settings, the best image quality was obtained at the 100-kV(p) setting; the higher or lower kilovoltage settings resulted in the degradation in contrast and diagnostic image quality of cerebral of CT angiography. In scans obtained with a low tube voltage, the contrast was enhanced because iodine-based contrast material provides greater x-ray attenuation caused by the increase in the relative atomic number of iodine (Z = 53) at exposure to reduced x-ray energy. The photoelectric effect in x-ray attenuation increases at lower tube voltages, particularly in scans of structures with high effective atomic numbers, such as iodinated contrast material. Because of Compton scattering, most x-rays interact less with soft tissue as the tube voltage increases. Therefore, a reduction in the tube voltage leads to an increase in the attenuation of iodinated contrast material as the photoelectric effect increases and Compton scattering decreases. Consequently, because the K-edge of iodine is closer to the reduced voltage, beam attenuation is increased and higher attenuation readings are obtained.17 Waaijer et al3 reported that, in head phantoms, lower tube voltage improved SNR at equal radiation doses. Moreover, the authors demonstrated, for evaluation of the circle of Willis in patients, that the better image quality was seen at 90-kV(p) scanning than at 120-kV(p) scanning, even if the patient dose was reduced by approximately 30%. We also found that SNR, CNR, and mean qualitative image scores were substantially higher at 100 than at 135 kV(p) when we compared these at identical doses levels (CTDIw).
Nakayama et al18 reported that, by decreasing the tube voltage from 120 to 90 kV(p), the amount of contrast material could be reduced without image quality degradation and the radiation dose could be reduced by as much as 56.8%. In our study, the mean qualitative image score was significantly higher at 100 than at 120 kV(p) for relatively low CT dose index volumes (33, 38, and 43 mGy) with the use of a concentration of 15 mg I/mL, though there was no significant difference in CT dose index volumes of 48 and 53 mGy. Our results may also indicate that intracranial CT angiography at 100 kV(p) has a potential benefit at a lower radiation-dose setting with a reduced amount of contrast material compared with that at 120 kV(p).
At a lower tube voltage, the influence of the photoelectric effect in the presence of iodinated contrast media is greater because of the 33-keV K-edge of iodine.17 However, the close topographic proximity of osseous and vascular structures in the skull may hinder the application of this principle to intracranial CT angiography. In this study, SNR and CNR were higher at 100 than at the 80 kV(p), and the readers subjectively rated the image quality regarding the depiction of the simulated cerebral vascular lesions to be significantly better at 100 than at 80 kV(p). Our results support the finding of a previous study,9 which reported that image quality was worse at 80 than at 120 or 140 kV(p), particularly in vessels adjacent to bone. Naturally, the use of 80 kV(p) causes an increase in noise in addition to the accentuation of beam-hardening artifacts, always to be expected with lower kilovoltage settings. Our results also demonstrated that, at identical dose levels, image noise significantly increased as tube voltage decreased. Moreover, the attenuation of the surrounding structures (ie, the brain parenchyma or the skull base) also increased at lower kilovoltage settings; this increase leads to reduced contrast between the vessel and its surroundings.
There are several limitations in our study. First, as a limitation of the phantom design, our vascular phantom made of silicone rubber had a higher CT value and was much less dynamic in terms of the absorption range compared with an actual human head. In addition, the superimposed bone skull structures, which were made of gypsum, have a higher degree of attenuation compared with bones of an actual human head. This results in higher image noise levels on CT angiograms at 80 kV(p), which degrade image quality. Second, we determined the contrast material concentration to fill the cylinder tubes of the vascular phantom on the basis of CNR obtained with clinical patients, because to our knowledge, this has not been evaluated in the previous literature. Therefore, the use of concentrations of 15 and 20 mg I/mL may not reflect the clinical reality. Third, we could not perform CT angiography at 80 kV(p) in high CT dose index volumes (48 and 53 mGy) because of a technical problem with the MDCT system. Finally, for the evaluation of cerebral vascular lesions, the volume-rendering technique was the only 3D display method used in this study. This can be explained by the arbitrary determination of low and upper thresholds for data exclusion when performing the volume-rendering technique.
In conclusion, in our phantom study of cranial 3D MDCT angiography at various kilovoltage settings, we found that excessively high or low kilovoltage settings resulted in degradation in contrast and diagnostic image quality regarding the depiction of the simulated cerebral vascular lesions. Although a reduction in the tube voltage leads to an increase in the attenuation of iodinated contrast material, the use of 80 kV(p) may cause an increase in noise in addition to the accentuation of beam-hardening artifacts. Our results suggest that it is desirable to use 100 kV(p) for 3D MDCT angiography.
Footnotes
-
Paper previously presented at: Annual Meeting of the American Society of Neuroradiology, May 16–21, 2009; Vancouver, British Columbia, Canada.
References
- Received June 15, 2009.
- Accepted after revision August 13, 2009.
- Copyright © American Society of Neuroradiology


