
Abstract
BACKGROUND AND PURPOSE: DWI using a standard b-value of 1000s/mm2 has emerged as the most sensitive sequence for the diagnosis of CJD. The purpose of this study was to investigate whether DWI at a high b-value (b = 3000 s/mm2) and ADC measurements in the basal nuclei improve the diagnosis of vCJD and sCJD compared with visual assessment of DWI at a standard b-value (b = 1000 s/mm2).
MATERIALS AND METHODS: Eight patients with vCJD, 9 patients with sCJD, and 5 healthy volunteers underwent DWI at b = 1000 s/mm2, and 5 vCJD patients, 4 sCJD patients, and 1 growth hormone-related CJD patient underwent DWI at b = 3000 s/mm2. Two consultant neuroradiologists performed a visual comparison of the b = 1000 and b = 3000 images. Mean MR SI and ADC values were determined for C, P, and DM thalamus ROIs bilaterally at each b-value. SI ratios for each ROI relative to white matter were calculated.
RESULTS: In 9 out of 10 patients, the higher b-value images were more sensitive to SI change, particularly in cortex and thalamus, with higher SI ratios at b = 3000 in the DM thalamus. For sCJD at b = 1000, we found significantly lower ADC values in the C and P compared with controls (mean C ADC = 587.3 ± 84.7 mm2/s in sCJD patients versus 722.7 ± 16.6 mm2/s in controls; P = .007), and at b = 3000, the differences were more pronounced. In comparison, in vCJD at b = 1000, ADC values were elevated in the Pu (mean Pu ADC = 837.6 ± 33.0 mm/s2 in vCJD patients versus 748.0 ± 17.3 mm/s2 in controls; P < .001) but failed to reach significance at b = 3000.
CONCLUSIONS: Our results demonstrate that b = 3000 DWI, being more sensitive to slowly diffusing tissue water, is more sensitive to pathology in sCJD than is conventional DWI. High-b-value DWI increases confidence in the radiologic diagnosis of human prion disease.
Abbreviations
- ADC
- apparent diffusion coefficient
- C
- caudate
- DM
- dorsomedial
- DWI
- diffusion-weighted imaging
- FLAIR
- fluid-attenuated inversion recovery
- FWM
- frontal white matter
- P
- putamen
- Pu
- pulvinar
- ROI
- region of interest
- sCJD
- sporadic Creutzfeldt-Jakob Disease
- SI
- signal intensity
- SP
- superior pons
- vCJD
- variant Creutzfeldt-Jakob Disease
Diffusion-weighted imaging has emerged as the most sensitive sequence for the diagnosis of human prion diseases, particularly for sCJD,1–5 where increased sensitivity for SI change in the cortex is observed.5–7 With the routine clinical use of DWI, MR imaging has gained increasing importance in the diagnosis of human prion diseases.8 MR imaging is now included in the diagnostic criteria for vCJD, and DWI has enabled earlier and more accurate diagnosis of sCJD. The combined use of DWI and FLAIR sequences increases the diagnostic sensitivity and specificity for sCJD to >91%.5
The degree of diffusion-weighting in DWI is described by the Stejskal-Tanner equation,9 which relates the image SI to the ADC and a diffusion-sensitivity parameter, the b-value. This b-value depends on the strength, duration, and timing of the applied diffusion-sensitizing gradients. In routine clinical DWI studies, b-values are usually of the order of b = 1000 s/mm2. However, recent advances in MR gradient technology have permitted higher b-values on clinical 1.5T systems, with increased sensitivity for the detection of SI abnormality in ischemic stroke,10,11 the grading of cerebral gliomas,12 and improving sensitivity to white matter degeneration in Alzheimer disease.13 Higher b-values lead to a decrease in SI-to-noise ratio, but the disease detection may be facilitated by a concomitant increase in contrast-to-noise ratio.14,15 This is partially due to the increased diffusion weighting per se, and additionally, high-b-value DWI offers increased sensitivity to any slow-diffusion water compartment present within the tissue.
As therapies are being developed,16,17 the early identification of vCJD and sCJD cases is important. Therefore, the purpose of this study was to investigate whether DWI at high b-value (b = 3000 s/mm2) and ADC measurements in the basal nuclei improve the diagnosis of vCJD and sCJD compared with visual assessment of DWI at standard b-value (b = 1000 s/mm2).
Materials and Methods
Patients
Eight patients with vCJD (3 women, 5 men; mean age, 36.1 years; range, 19–76 years) and 9 patients with sCJD (3 women, 6 men; mean age, 59.2 years; range, 54–72 years) referred to the National Prion Clinic, National Hospital for Neurology and Neurosurgery, London, United Kingdom, were included in this study. All patients were recruited into the Medical Research Council Prion-1 Trial, a partially randomized patient preference trial to evaluate the activity and safety of quinacrine in human prion disease.18 Ethical approval for the study was given by the Eastern Multi-Centre Research Ethics Committee, and informed consent for participation in the study was given by either the patient or patient's next of kin. Five healthy volunteers (3 women, 2 men; mean age, 41.2 years; range, 33–52 years) with no personal or family history of neurologic disorders were also recruited and gave informed consent with ethical approval from the National Hospital for Neurology and Neurosurgery and Institute of Neurology Research Ethics Committee (Local Research Ethics Committee).
MR Imaging Acquisition
All subjects were examined by using a clinical 1.5T MR system (GE Healthcare, Milwaukee, Wisconsin). After scout images were obtained, axial images with section thickness of 5 mm parallel to the bicommissural line from the craniovertebral junction to the vertex were acquired for FLAIR MR imaging (TE 161 ms, TI 2473 ms, TR 9897 ms, 1 average, FOV 24 × 24 cm, matrix 256 × 224) and DWI. DWI was performed by using a single-shot echo-planar technique (TR 10,000 ms, 1 average, matrix 96 × 128, FOV 26 × 26) with b-values of 0 and 1000 s/mm2 (TE 101 ms, 1 average).
Ten patients (5 with vCJD, 4 with sCJD, and 1 with growth hormone-related CJD) had additional DWI with b-values of 0 and 3000 s/mm2 (TE 136 ms, 3 averages) applied sequentially along 3 orthogonal axes. The extended TE compared with that used in the b = 1000 s/mm2 acquisitions was necessary to achieve the required diffusion- weighting within the limits of the gradient performance available on our standard 1.5T clinical imaging system. In each case the diffusion-weighted images obtained for each orthogonal direction were averaged to yield diffusion trace-weighted images for each section.
MR Imaging Analysis: Qualitative Analysis by Visual Inspection
Two independent consultant neuroradiologists (J.S. and H.R.J.) with experience in DWI performed qualitative analysis of the diffusion trace-weighted images in a nonblinded fashion.
Assessment of SI Changes on b = 1000 and FLAIR Images.
Basal ganglia and cortical SIs were compared with normal gray matter and classified as hyper-, iso-, or hypointense to gray matter.
Comparison of b = 1000 and b = 3000 DWI Images.
Each of the b = 1000 and b = 3000 trace-weighted images was assessed for pathologic SI changes. The observers then compared the b = 1000 with the b = 3000 images side by side, and by using a scoring system concluded whether the b = 3000 images were better (+1), the same as (0), or worse (−1) than the b = 1000 images for abnormal SI conspicuity. Where a discrepancy was identified, the images were re-reviewed in a consensus reading. A κ statistic was calculated to assess the level of agreement between the 2 independent observers for pathologic SI change.
MR Imaging Analysis: Quantitative MR Imaging
Postprocessing was performed at a dedicated workstation (Sun Microsystems, Mountain View, California) by a single neuroradiologist. Using commercially available software (Jim Version 4.0; Xinapse Systems, Thorpe Waterville, United Kingdom), pixel-by-pixel ADC maps were generated from the b = 0 and b = 1000 trace-weighted images by using the Stejskal-Tanner equation9 for ADC calculation: ADC = −[ln(S1/S2)/(b1 − b2)], where S1 and S2 are the SIs of diffusion-weighted images with b-factors of 0 (b1) and 1000 (b2), respectively. This process was repeated for the b = 0 and b = 3000 trace-weighted images.
Measurement of SI Ratios on Diffusion-Weighted Trace Images.
The MR SI in the head of the C, P, DM, and right FWM were determined bilaterally by manually defining ROIs, ranging in size from 40 to 70 mm2, enclosing each anatomic region on the axial b0 image from the b = 1000 dataset at the level of the genu of the internal capsule. Right versus left asymmetry was assessed for SI measurements in the C, P, and DM ROIs by using the paired t test. As no significant asymmetry was detected, the mean left-right SIs for these ROIs were calculated. Using these SI measurements, the ratio of SI for each of the basal ganglia ROIs to SI of the FWM (control) ROI was calculated.
Regional ADC Measurements.
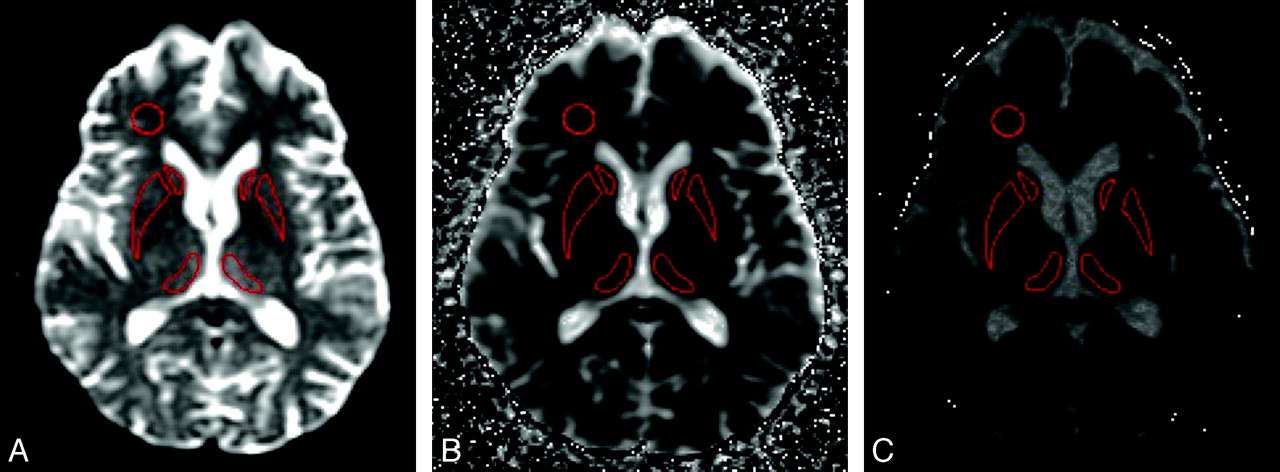
The above ROIs were transferred to the corresponding b = 1000 ADC map (Fig 1) and then to the b = 3000 ADC map, and the mean ADC for each ROI was recorded. For the vCJD cases, mean ROI ADC values in the Pu were also determined. Right versus left asymmetry was also assessed for ADC values in the C, P, Pu, and DM ROIs by using the paired t test, and as no significant asymmetry was detected, the left-right mean ADC values were calculated for these regions. Two control ROIs were selected in the right FWM and the SP. To assess intraobserver variability, the ROI analysis in all 6 regions was repeated for 4 patient datasets in 2 sessions separated by 10 days. Bland-Altman analysis demonstrated a mean difference of −5.1 mm2/s (95% CI = −13.75 to 3.55; P = .235). To assess interobserver variability, a second observer placed ROIs on the same 4 patients and Bland-Altman analysis demonstrated a mean difference of 3.81 mm2/s (95% CI = −5.47–13.08; P = .40).

The position of the key ROIs on (A) b = 0, (B) b = 1000, and (C) b = 3000 ADC map.
Statistical Analysis
The paired sample t test was used to compare SI ratios between the b = 1000 and b = 3000 images. Comparison of mean ADC in each ROI between the vCJD patients, sCJD patients, and healthy volunteers were determined by using a 1-way ANOVA and ad hoc multiple comparison tests with Bonferroni correction for each b-value.
Results
Clinical Findings
Diagnoses in the 8 patients with vCJD (3 women, 5 men; mean age, 36.1 years; range, 19–76 years) were all confirmed by either tonsil biopsy19 or postmortem examination. The mean disease duration at the time of MR imaging was 6.2 weeks (range, 2–16 weeks). In the 9 patients with sCJD (3 women, 6 men; mean age, 59.2 years; range, 54–72 years) included in the study, diagnosis was confirmed by postmortem examination in 8 patients and brain biopsy in 1 patient. The mean disease duration at the time of onset was 16.7 weeks (range, 3–24 weeks).
MR Imaging Findings
Qualitative Assessment: Visual Inspection of Trace-Weighted and FLAIR Images.
All 8 vCJD patients demonstrated bilateral DM thalamic SI hyperintensity, but only 6 out of 8 demonstrated C hyperintensity and 4 out of 8 demonstrated P hyperintensity on FLAIR and DWI (b = 1000 s/mm2). No cortical hyperintensity was observed. Table 1 provides a summary of SI at b = 1000 in vCJD and sCJD patients, where in a given region, DWI and FLAIR hyperintensity to gray matter (+) or isointensity to gray matter (−) is described. All 9 patients with sCJD demonstrated cortical SI hyperintensity, predominantly in the cingulate cortex and occipital cortex. All 9 of these patients demonstrated hyperintensity in the head of C bilaterally but only 8 out of 9 demonstrated hyperintensity in the P, and 6 out of 9 demonstrated hyperintensity in the thalami (Table 1).
Visual assessment of SI findings in vCJD and sCJD on FLAIR and DWI (b = 1000 s/mm2)
Qualitative Assessment: Comparison of b = 1000 and b = 3000 Images.
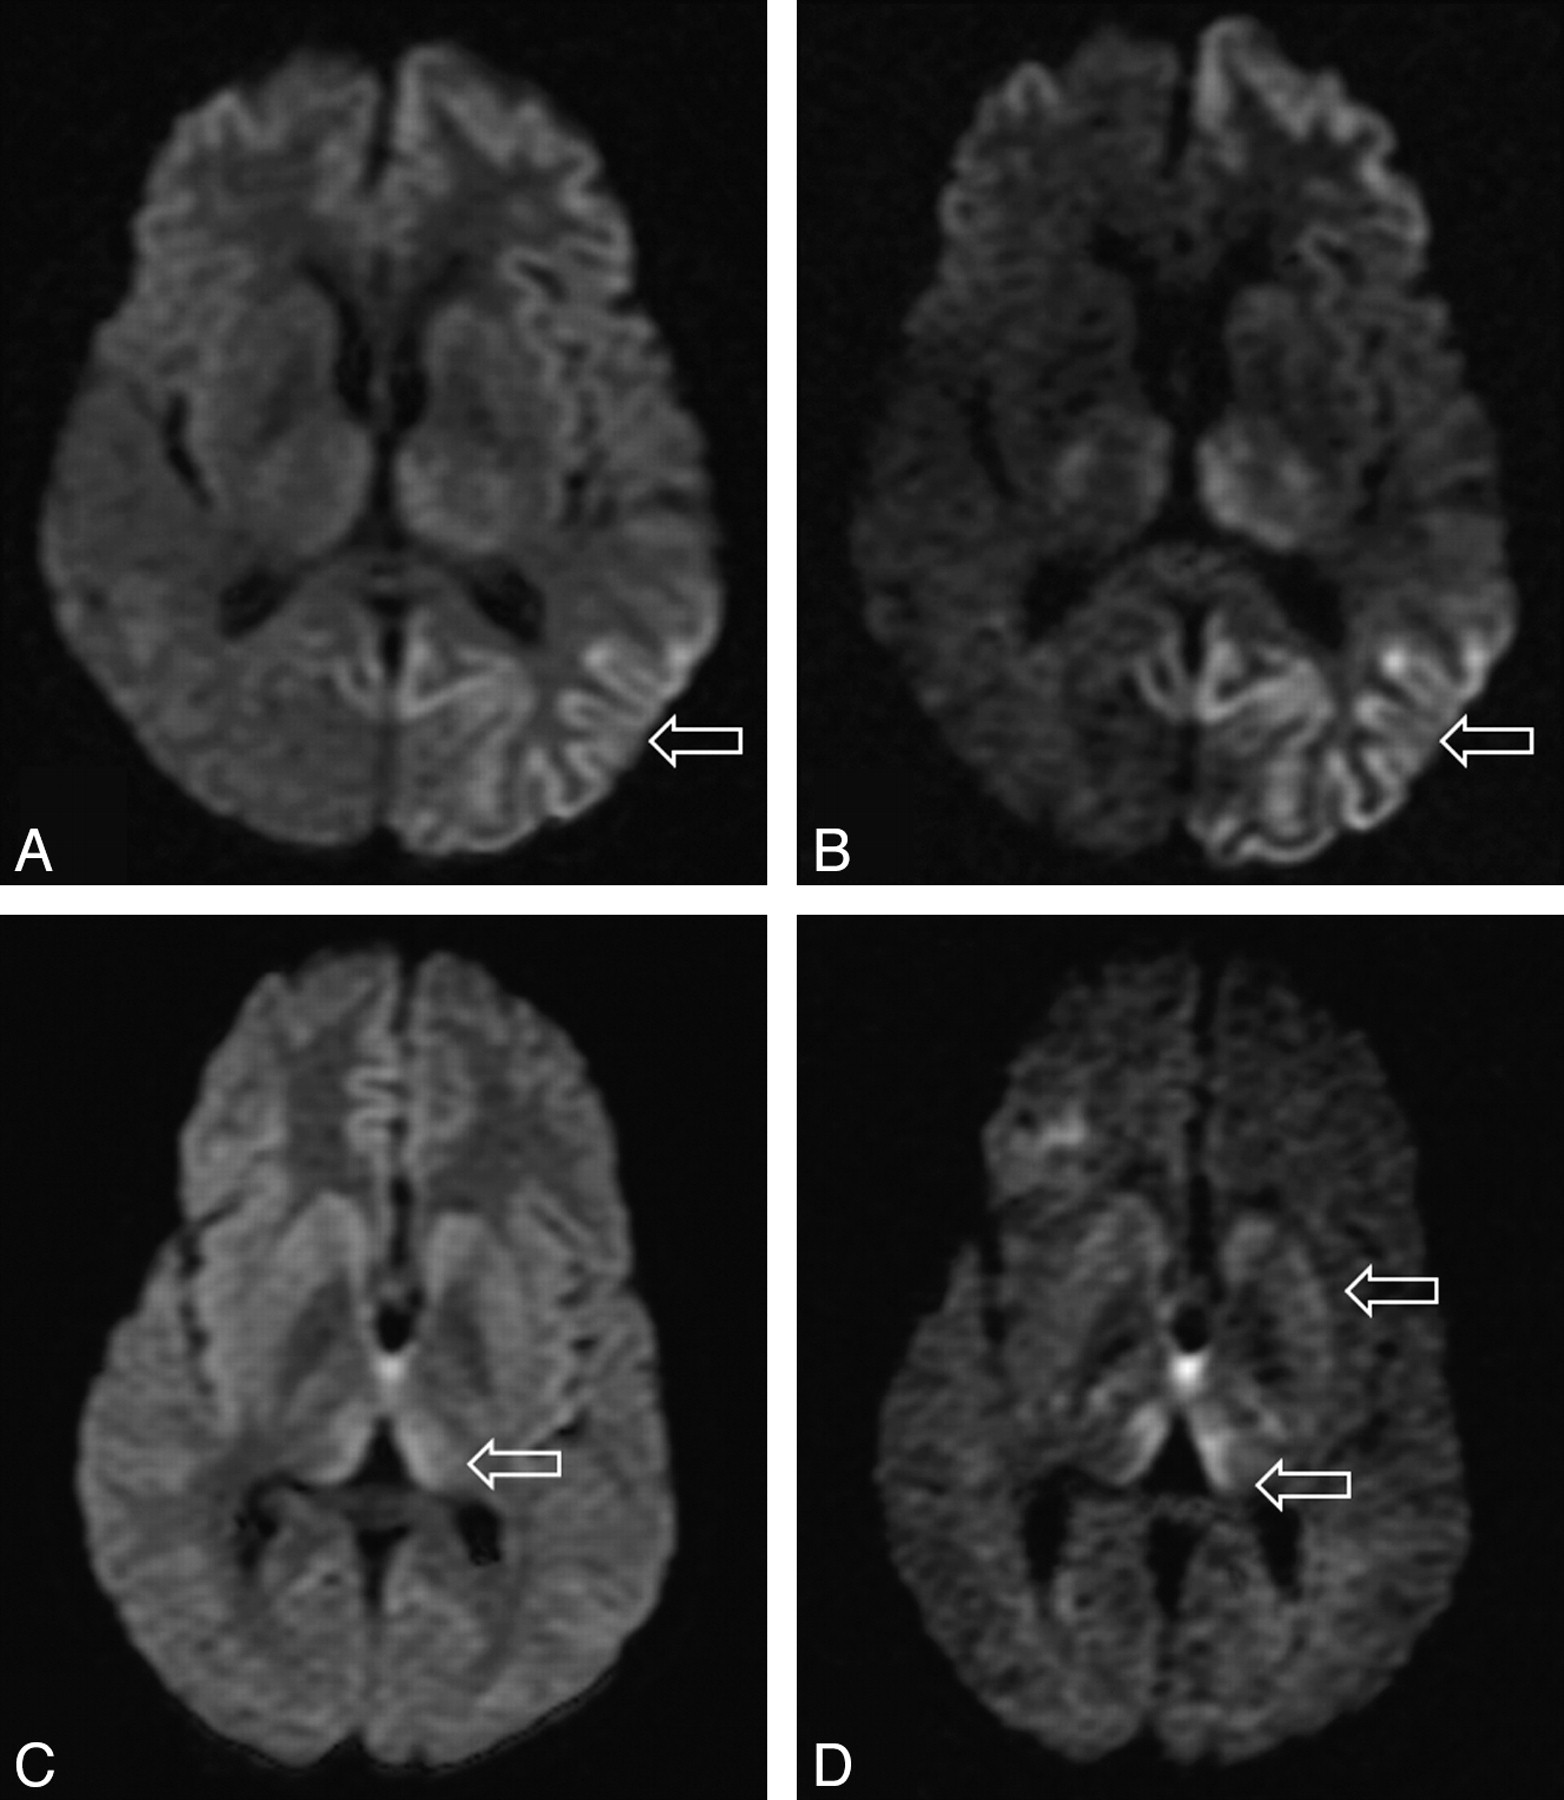
In the 10 patients who underwent both b = 1000 and b = 3000 DWI, we found complete agreement between the 2 observers in all cases (κ score 1.0). In 9 out of the 10 cases, SI change was more conspicuous on the higher b-value images. In 1 case the higher b-value image did not aid in assessment, possibly because there were some movement artifacts. In all cases, no new areas of SI change were identified on the higher b-value images, but increased confidence was obtained, particularly for areas that were equivocal on the b = 1000 images (Fig 2). In particular, cortical and thalamic SI changes were more conspicuous at the higher b-value.

Differences in SIs in the basal ganglia in sCJD at (A) b = 1000 and (B) b = 3000 and in vCJD at (C) b = 1000 and (D) b = 3000.
Quantitative Assessment: Measurement of SI Ratios on Trace-Weighted Images.
The SI ratios in the thalamus were significantly higher in the b = 3000 images when compared with b = 1000 (DM ROI SI = 1.93 ± 0.72 on b = 3000 versus 1.39 ± 0.19 on b = 1000; P = .028). However, the SI ratios in the basal ganglia at b = 3000 were not significantly higher when compared with b = 1000 images, though there was a trend toward higher SI ratios at the higher b-value (C ROI SI = 1.99 ± 1.12 on b = 3000 versus 1.51 ± 0.33 on b = 1000; P = .12; and P ROI SI = 1.99 ± 1.12 on b = 3000 versus 1.51 ± 0.33 on b = 1000; P = .12).
Quantitative Assessment: ADC Measurement in vCJD Patients.
At b = 1000, we found significantly higher mean ADC values in the Pu ROIs bilaterally in the vCJD patients when compared with healthy volunteers (mean Pu ADC = 837.6 ± 33.0 mm2/s in vCJD patients versus 748.0 ± 17.3 mm2/s in controls; P < .001; Table 2). The mean ADC values in the DM thalamic ROIs were higher in vCJD patients when compared with controls but did not reach significance. There were no significant differences in mean ADC values in the C, P, and DM thalamic ROIs, and there were no significant differences in the mean ADC values for the control ROIs, the FWM and SP. At b = 3000, no significant differences were found for mean ADC values in any of the ROIs between vCJD patients and controls (Table 3).
Summary of mean diffusivity values (in mm2/s) measured in vCJD patients, sCJD patients, and controls for each ROI at b = 1000 s/mm2 with P values from post hoc comparisons
Summary of mean diffusivity values (in mm2/s) measured in vCJD patients, sCJD patients, and controls for each ROI at b = 3000 s/mm2 with P values from post hoc comparisons
Quantitative Assessment: ADC Measurements in sCJD Patients.
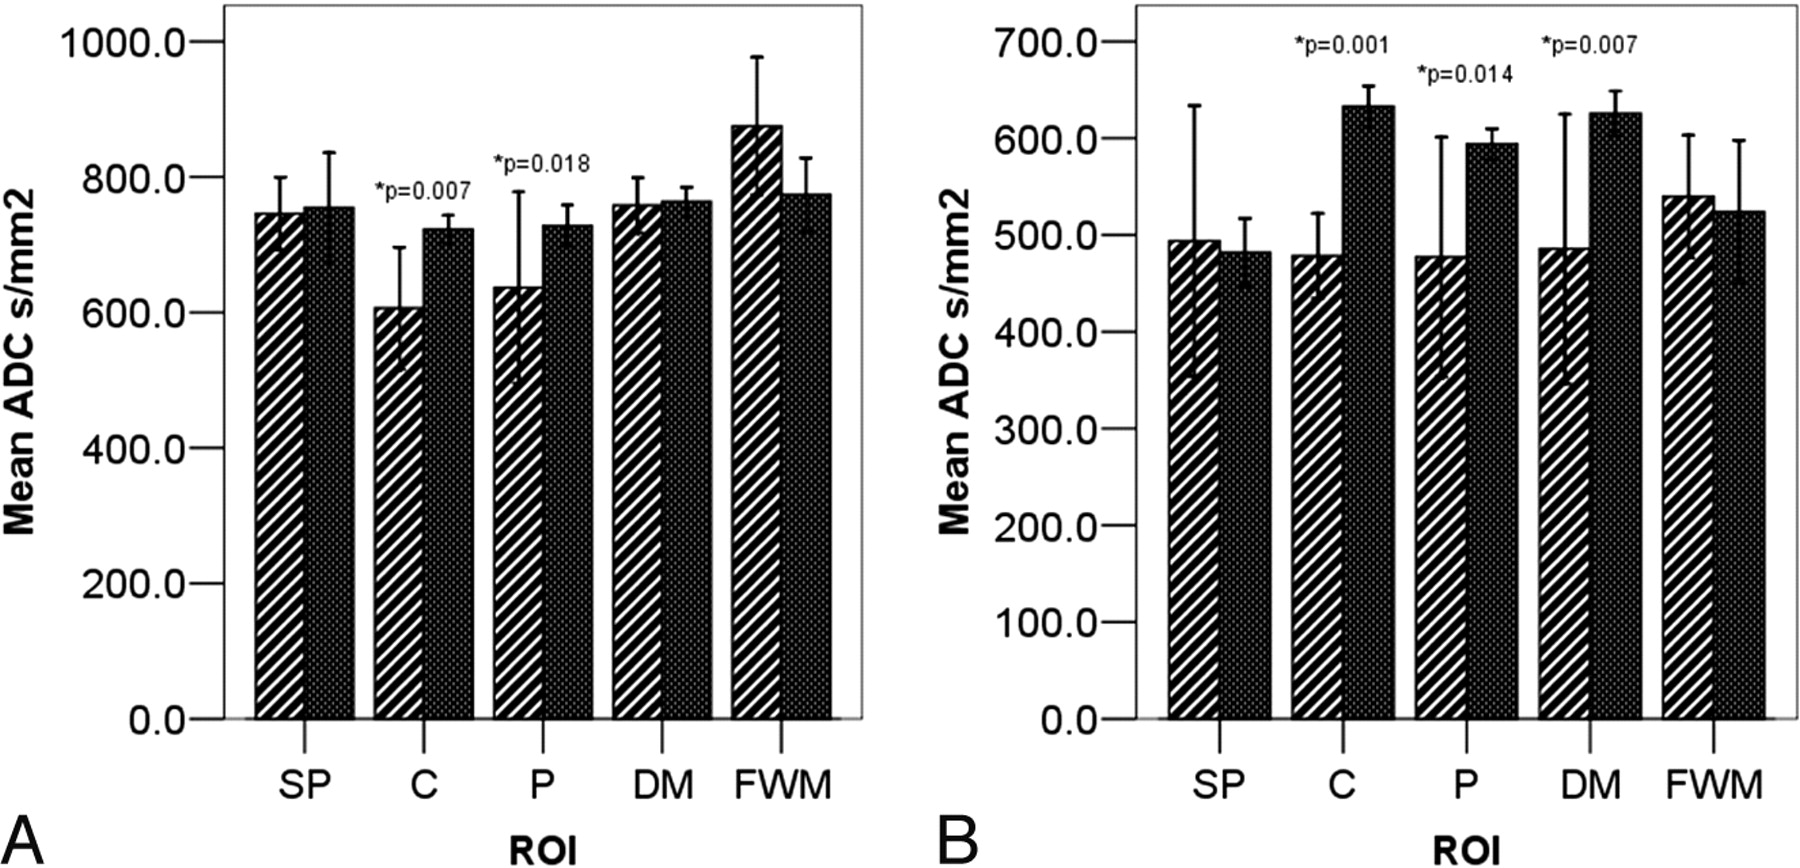
At b = 1000, we found significantly lower mean ADC values in the C and P ROIs in sCJD patients when compared with controls (mean C ADC = 587.3 ± 84.7 mm2/s in sCJD patients versus 722.7 ± 16.6 mm2/s in controls, P = .007; mean P ADC = 603.3 ± 98.7 mm2/s in sCJD patients versus 727.8 ± 24.4 mm2/s in controls; P = .018; Table 2 and Fig 3A). There were no significant differences in ADC values in the DM thalamic ROIs between sCJD patients compared with controls or in the control ROIs. At b = 3000, we found significantly lower mean ADC values in the C and P but also in the DM thalamic ROIs (mean DM ADC = 485.7 ± 87.4 mm2/s in sCJD patients versus 627.3 ± 13.1 mm2/s in controls; P = .001; Fig 3B and Table 3).

Bar charts showing ROI ADC values in sCJD (hashed bars) and controls (solid bars) at (A) b = 1000 s/mm2 and (B) b = 3000 s/mm2.
Discussion
This is, to our knowledge, the first study to investigate high-b-value DWI in prion diseases. Additionally, we have compared regional ADC values in patients with sCJD and vCJD to those in 5 healthy volunteers and were able to show distinct patterns of ADC change comparing these 2 forms of prion disease.
Several recent reports have established DWI as the most sensitive sequence for the diagnosis of sCJD.3–5,20 Visual inspection of the DWI trace-weighted image demonstrates typically increased SI in the cerebral cortex with up to 95% of cases showing hyperintensity affecting the insula, cingulate, and superior frontal cortex independently of deep gray matter involvement.20 DWI is superior to FLAIR in detecting MR imaging cortical SI change, and this has been shown to correlate with lateralized clinical and electroencephalograph abnormalities.21 It is suggested that the anatomic distribution of abnormal hyperintensity affecting the basal ganglia is influenced by PRNP genotype and PrPSc strain type.22,23 However, by using conventional b-values, DWI SI change is not seen in all patients with sCJD.24 We have shown that at high b-values, both cortical and basal ganglia SI changes are better detected on DWI in sCJD, thereby improving confidence in the radiologic diagnosis.
Due to the reported high sensitivity of the Pu sign on conventional MR imaging for the diagnosis of vCJD,25 very few studies have investigated DWI in vCJD. Compared with conventional MR imaging, diffusion-weighted images are less motion sensitive due to their rapid acquisition time, and Pu SI change may be more easily detected on DWI in a restless patient.26 In vCJD, we also found pathologic SI change to be more conspicuous on high-b-value images. Using FWM as reference, we found higher SI ratios at the higher b-values, particularly in the thalamus. This is likely to have contributed to the improved detection of SI change by our observers.
High-b-value DWI could be very useful for the radiologic diagnosis of sCJD and vCJD where SI changes are equivocal on the low-b-value DWI. As therapies are being developed,16,17 the early identification of vCJD and sCJD cases is important so that treatment may be instituted before irreversible neurodegeneration has occurred, and DWI at high b-value may be helpful. As the Pu sign may be a late feature in primary25 and blood transfusion–associated secondary vCJD,27 it remains to be seen whether high-b-value DWI would allow earlier detection of this sign in patients at risk from this disease.
There have been few reports regarding ADC measurement in sCJD,28–30 and there have been only 2 case reports describing ADC measurements in vCJD patients.26,31 Although abnormal areas appear bright on trace-weighted images in both sCJD and vCJD, we found distinct differences in the ADC of the affected areas: the ADC was reduced in sCJD but elevated in the thalamus in vCJD when compared with normal volunteers. Reduced ADC measurements in the C, P, and thalamus in sCJD are in concordance with previous reports.4,29 Tschampa et al found decreased ADC measurements before SI change was detected in the thalamus in sCJD, suggesting that ADC measurements could be more sensitive than visual DWI inspection to pathology in this disease.29 Two studies have addressed longitudinal measurements of ADC in sCJD.4,29 Whereas Murata et al32 found persistence of reduced ADC values in the corpus striatum for over 2 weeks, Tschampa et al detected an increase in ADC values with time and suggested that ADC may vary according to the stage of disease.29
The precise histopathologic correlates for the ADC changes in CJD are not yet known. The histologic hallmarks of CJD are spongiosis, neuronal loss, and gliosis. It is likely that the proportion of these histologic changes that are present in the target tissue determines the ADC. Severe spongiform change with areas of confluent vacuolation, restricting the extracellular space, has been advocated as a potential cause of decreased ADC.4,33,34 In a single case report, Russmann et al found a reduction of ADC values in all regions with spongiform alterations but no correlation between the histologic degree of spongiform alterations and the decrease in the ADC values.30 Another study claimed that DWI SI change correlated with accumulation of the abnormal prion protein PrPSc.35
In our 8 patients with vCJD we found increased ADC values in the Pu, which is in agreement with the 2 previous case reports using ADC measurements.26,31 As in these case reports, we also found slightly decreased ADC values in the C and P, compared with volunteers, but this did not reach statistical significance.
In some cases the clinical presentation and radiologic findings are very similar in vCJD and sCJD. In our study, the thalamus was the only anatomic region where we found a significant difference in ADC values between sCJD and vCJD patients. It is possible that thalamic ADC measurements may be used to differentiate vCJD from sCJD in cases where the radiologic findings are similar.
Because in the Pu ROI we saw an increase in ADC values in vCJD, we conclude that the Pu high SI seen on DWI trace-weighted images in vCJD is due to T2 prolongation rather than to restricted diffusion. The T2 prolongation of the tissue appears to be made more conspicuous by the increased T2 weighting resulting from the longer TE necessary for the higher b-value pulse sequence. It is thought that the histopathologic substrate of the Pu sign is astrocytosis.36 It is therefore likely that the increased T2 and increased diffusivity noted in the Pu is due to reactive astrocytosis. Spongiform change is also seen in the Pu, but the changes are much less pronounced as in the C and P.36
At higher b-values the changes in ADC measurements were more pronounced for sCJD and less pronounced for vCJD. Compared with normal brains we found more significant ADC differences; in sCJD at b = 3000, but not in vCJD. As the b-value increases, a progressive change in visual contrast between brain regions is noticed with reversal of the gray-white matter and an overall decrease in ADC values.14,15,36,37 In general in nervous tissue, changes in ADC values seen with increasing b-values cannot be adequately explained by monoexponential diffusion behavior, and it has been suggested that there are fast and slow components in the random diffusional motion of water molecules in brain tissues.38,39 Niendorf et al38 suggest that at low b-values, DWI SI is dominated by the fast component and at high b-values the DWI SI is dominated by the slow component. Our results suggest that DWI and ADC measurements weighted toward the slow diffusion component at higher b-values are more sensitive to pathology in sCJD. Measurements of ADC based on high-b-value imaging appear to be more specific to the histopathologic changes that occur in vCJD and sCJD.
Conclusions
We have shown that at high b-values, DWI in CJD SI change is better detected, improving confidence in the radiologic diagnosis of human prion disease. We have demonstrated anatomically specific ADC changes in human prion disease compared with the normal brain and have demonstrated different patterns of ADC change comparing sCJD and vCJD, reflecting regional variations in the underlying pathology.
Footnotes
This research was supported by the Medical Research Council UK.
Previously presented in part at: International Society of Magnetic Resonance in Medicine Annual Meeting, Honolulu, Hawaii, April 18-24, 2009.
Indicates open access to non-subscribers at www.ajnr.org
References
- Received May 19, 2009.
- Accepted after revision July 21, 2009.
- Copyright © American Society of Neuroradiology
In this issue


Jump to section
Related Articles
Cited By...
- Imaging and CSF analyses effectively distinguish CJD from its mimics
- Neuroimaging of Rapidly Progressive Dementias, Part 2: Prion, Inflammatory, Neoplastic, and Other Etiologies
- Multiparameter MR Imaging in the 6-OPRI Variant of Inherited Prion Disease
- Susceptibility of Domestic Cats to Chronic Wasting Disease