
Abstract
BACKGROUND AND PURPOSE: In reviewing MR images of patients with spontaneous intracranial hypotension (SIH), we found an accentuated decrease in the subcortical white matter on fluid-attenuated inversion recovery (FLAIR) images. Our aim was to determine whether the signal intensity of the subcortical white matter decreases on FLAIR and T2-weighted images in SIH.
MATERIALS AND METHODS: We retrospectively examined pretreatment MR images including 7 FLAIR and 10 T2-weighted images obtained from 10 patients with SIH and follow-up images (5 FLAIR and 7 T2-weighted images). Two observers measured the signal intensities in the subcortical white matter on MR images at the level of the centrum semiovale and, to calculate the signal intensity ratios, measured those of the adjacent cortex and corpus callosum. Furthermore, 4 observers performed visual evaluation for accentuated signal intensity decreases for receiver operating characteristic (ROC) analysis.
RESULTS: The intensity ratios of the subcortical white matter, both to the adjacent cortex and corpus callosum, were significantly different between the control and pretreatment images in SIH and between pretreatment and follow-up images in SIH on FLAIR images, whereas these showed no significant differences between the control and follow-up images in SIH. On visual inspection, an accentuated decrease in signal intensity in the subcortical white matter was shown on pretreatment FLAIR images, which returned to the control level on follow-up images. However, on the T2-weighted images we could hardly recognize the decrease in the signal intensity.
CONCLUSIONS: Awareness of the decreased signal intensity of the subcortical white matter on FLAIR images could help in the diagnosis of SIH.
Spontaneous intracranial hypotension (SIH) is caused by leakage of CSF and is characterized on MR imaging by compensative phenomena for the loss of CSF, as described in numerous reports.1–9 The syndrome of SIH typically presents with orthostatic headache and is occasionally accompanied by nausea, tinnitus, or dizziness.1–2,5
On both T2-weighted and fluid-attenuated inversion recovery (FLAIR) images, the subcortical white matter has a barely perceptible signal intensity that is lower than that of cortical gray matter. However, in a review of MR images in patients with SIH, we found an accentuated decrease in the signal intensity of the cerebral white matter, particularly in the subcortical white matter of the frontal and parietal lobes, on FLAIR images. In the literature, signal intensity changes in the brain have never been described for this entity, to our knowledge.
In this retrospective study, we attempted to elucidate whether the signal intensity of the cerebral white matter decreases on FLAIR and T2-weighted images in patients with SIH, and we discuss the usefulness of this phenomenon for diagnosis and the mechanism of the decrease in the signal intensity of the white matter in SIH.
Materials and Methods
Patients
The Institutional Review Board approved the study protocol and waived patient informed consent because the study was based on existing data.
We retrospectively studied the records of 10 patients (1 man and 9 women; mean age, 39.9 ± 12.0 years; age range, 26–64 years) diagnosed with SIH from 1997 to 2008 on the basis of MR imaging analysis, including routine T1-weighted and T2-weighted images, FLAIR images, and T1-weighted images with contrast media. All patients had orthostatic headache, and nausea was seen in 2, hearing loss in 2, tinnitus in 1, dizziness in 1, and stiff neck in 1 patient. MR images obtained from all pretreatment patients demonstrated all of the following findings described in previous reports1–9: enlargement of the venous sinuses, enlargement of the pituitary gland, thickening and enhancement of the dura mater, and downward displacement of the brain (sagging brain) (Fig 1A, -B).

A, A T1-weighted axial image from a 30-year-old woman (case 1) after administration of intravenous contrast media shows diffuse dural thickening and enhancement (arrows). B, A T2-weighted sagittal image from case 1 after administration of intravenous contrast media shows enlargement of the pituitary gland (white arrow), enlargement of the straight sinus (black arrow), and downward displacement of the brain or “sagging brain” associated with flattening of the pons with obliteration of the prepontine cistern (arrowheads), indicating a diagnosis of SIH.
For the control group, we enrolled 20 consecutive patients (7 men and 13 women) who had undergone MR imaging examination, including both FLAIR and T2-weighted images, for headache, dizziness, and/or tinnitus in May and June 2008. To match the age of the control group to that of the SIH group, we chose patients ranging in age from 30 to 60 years, whose MR images demonstrated no abnormalities. Their mean age was 42.3 ± 8.2 years (age range, 30–55 years).
MR Images
We performed MR imaging in all subjects by using a 1.5T superconducting system (Signa; GE Healthcare, Milwaukee, Wis). The parameters of plain T1-weighted imaging and T1-weighted imaging with contrast media (intravenous administration of 0.1 mmol/kg of gadopentetate dimeglumine, Magnevist; Bayer-Schering Pharma, Osaka, Japan) were as follows: TR, 520 ms; TE, 15 ms; FOV, 24 × 24 cm; section thickness, 7 mm; section gap, 2 mm; matrix, 512 × 256; and NEX, 2. The parameters of T2-weighted imaging with use of a fast spin-echo sequence were as follows: TR, 4000 ms; TE, 102 ms; FOV, 24 × 24 cm; section thickness, 7 mm; section gap, 2 mm; matrix, 512 × 256; NEX, 2; and echo-train length, 12. The parameters of FLAIR imaging were as follows: TR, 8004 ms; TE, 139 ms; TI, 2000 ms; FOV, 24 × 24 cm; section thickness, 7 mm; section gap, 2 mm; matrix, 256 × 256; and NEX, 1.
Pretreatment MR imaging in the10 patients with SIH included 7 FLAIR images and 10 T2-weighted images in all. The duration from onset to pretreatment MR imaging ranged from 1 to 90 days (mean, 27.4 ± 28.7 days) in FLAIR imaging and from 1 to 90 days (mean, 26.4 ± 24.8 days) in T2-weighted imaging.
Follow-up MR imaging was obtained in 7 patients with SIH (5 FLAIR images and 7 T2-weighted images) when headache faded and other symptoms were relieved, and MR imaging findings for SIH, especially enhancement of the dura mater, disappeared completely. The interval between pretreatment and follow-up MR imaging ranged from 76 to 326 days (mean, 171 days) in FLAIR imaging and from 31 to 326 days (mean, 137 days) in T2-weighted imaging. None of the patients who were followed up with MR imaging underwent surgical treatment of blood patch.
Measurement of Signal Intensity
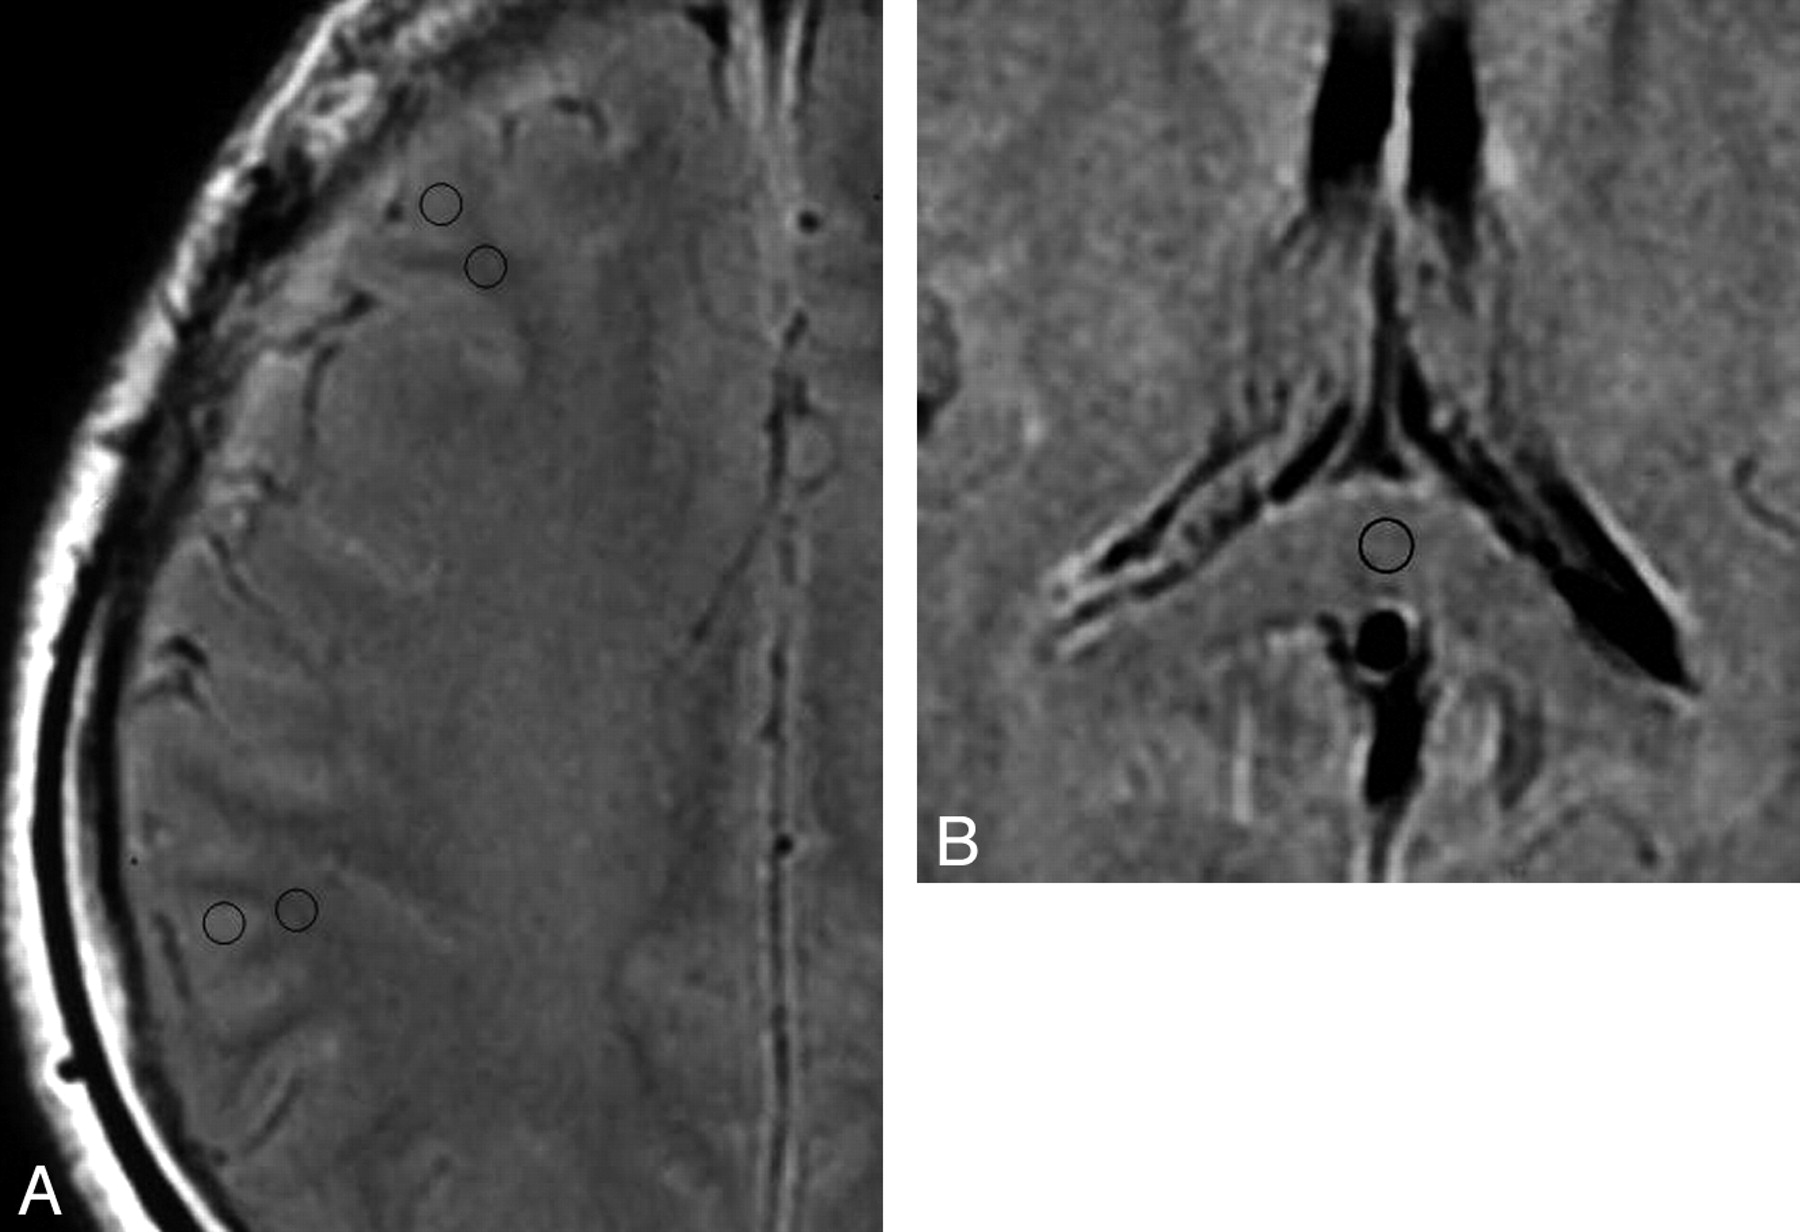
We focused on the FLAIR and T2-weighted images at the level of the centrum semiovale and measured the signal intensities of the subcortical white matter of the bilateral middle frontal gyri and inferior parietal lobules. To calculate the ratio of the signal intensity of the subcortical white matter to the adjacent cortex, we measured the signal intensities of them by using a region of interest with a fixed area (0.1 cm2), which was carefully set to locate exclusively within the subcortical white matter and cortical gray matter, respectively, on the monitor (Fig 2A). Furthermore, to ensure the quantitative comparison, we also measured the signal intensities of the corpus callosum (splenium) by using a region of interest with the same fixed area as above to calculate the ratio of the signal intensity of the subcortical white matter to it (Fig 2B).

A, A FLAIR image from case 1 demonstrates the regions of interest to measure the signal intensity set in the subcortical white matter and adjacent cortex in the middle frontal gyrus and inferior parietal lobule. B, A FLAIR image from case 1 demonstrates the region of interest to measure the signal intensity set in the corpus callosum (splenium).
In both the patient and control groups, we calculated the ratios of the signal intensity of the subcortical white matter to that of the adjacent cortex and to that of the corpus callosum. We then calculated the mean ratio among the 4 regions in all MR imaging studies. The measurements were performed by 2 observers (a radiologist with 22 years of experience and a radiologic technologist with 7 years of experience in MR imaging) independently. For statistical analyses, after calculating a concordance rate between the 2 observers, we used the mean values between them.
Visual Evaluation
On all the FLAIR and T2-weighted images from the pretreatment and follow-up series from the patients and control subjects, the signal intensity in the subcortical white matter was visually inspected by 4 observers at the level of the centrum semiovale. For this evaluation, the 4 observers used a scale involving 4 visual rating scores for the low-intensity zone in the subcortical white matter: grade 4, low-intensity zone seen in the subcortical white matter of almost all gyri; 3, low-intensity zone in that of half the number of gyri or more; 2, low-intensity zone in that of less than half the number of gyri; 1, low-intensity zone hardly seen.
The observers included 2 radiologists with 14 and 22 years of experience and 2 radiologic technologists with 7 and 12 years of experience in MR imaging. They had no previous knowledge of the diagnosis or of any of the clinical information of the subjects, and they independently evaluated the FLAIR and T2-weighted images separately. The images from the pretreatment and follow-up series from the patients and control subjects were mixed and ordered in a random fashion. To evaluate the usefulness of FLAIR and T2-weighted imaging for the detection of SIH in visual evaluation, we used receiver operating characteristic (ROC) analysis. For the ROC analysis, we calculated mean visual rating scores among the 4 observers in each case and used the scores rounded off.
Statistical Analyses
In measurements of signal intensities, we calculated the Kendall coefficient of concordance between 2 observers before calculating the mean values between them. Using an unpaired t test, we compared the mean ratios of the subcortical white matter signal intensity with that of the adjacent cortex and those with that of the corpus callosum between the control and pretreatment SIH groups, and between the control images and follow-up images obtained from the patients. We performed comparison between pretreatment MR images and follow-up MR images in the patients with SIH by using the Wilcoxon matched-pairs signed-rank test. (In only this comparison, we used SIH patients in whom we could obtain both pretreatment and follow-up images.) Statistical significance was established at the P < .05 level. For visual evaluation, we also used ROC analysis and calculated areas under the ROC curves.
Results
Measurement of Signal Intensity
The Signal Intensity Ratio to the Adjacent Cortex.
The Kendall coefficient of concordance between the observers was 0.93 in control FLAIR images, 0.93 in pretreatment FLAIR images, and 0.90 in follow-up FLAIR images; and 0.93 in control T2-weighted images, 0.69 in pretreatment T2-weighted images, and 0.86 in follow-up T2-weighted images.
The mean ratios of the signal intensity of the subcortical white matter to that of the adjacent cortex on FLAIR images were 0.823 ± 0.032 in the control images, 0.788 ± 0.026 in the pretreatment images, and 0.828 ± 0.027 in the follow-up images; those on T2-weighted images were 0.768 ± 0.033 in the control images, 0.744 ± 0.023 in the pretreatment images; and 0.770 ± 0.027 in the follow-up images.
On FLAIR images, the unpaired t test revealed a significant difference in the signal intensity ratio between the control images and the pretreatment images in patients with SIH (P = .01), but no significant difference was observed between the control images and follow-up images in the patients (P = .77). The Wilcoxon matched-pairs signed-rank test revealed a significant difference in that ratio between the pretreatment images and the follow-up images in the patients (P = .04).
In the case of the T2-weighted images, the ratio of the signal intensity between the control images and the pretreatment images in the patients with SIH revealed a significant difference (P = .03); however, no significant difference between the control images and follow-up images in the patients (P = .92). The Wilcoxon matched-pairs signed-rank test revealed a significant difference in the ratio between the pretreatment images and the follow-up images in patients with SIH (P = .03).
The Signal Intensity Ratio to the Corpus Callosum.
The coefficient of concordance between the observers was 0.88 on the control FLAIR images, 0.90 on the pretreatment FLAIR images, and 0.79 on the follow-up FLAIR images; and 0.93 on control T2-weighted images, 0.95 on pretreatment T2-weighted images, and 0.99 on follow-up T2-weighted images.
The mean ratios of the signal intensity of the subcortical white matter to that of the corpus callosum on FLAIR images were 1.021 ± 0.058 on control images, 0.959 ± 0.049 on pretreatment images, and 1.002 ± 0.030 on follow-up images, and those on T2-weighted images were 0.948 ± 0.060 on control images, 0.983 ± 0.067 on pretreatment images, and 0.984 ± 0.068 on follow-up images.
On FLAIR images, the unpaired t test revealed a statistically significant difference in the signal intensity ratio between the control images and the pretreatment images in patients with SIH (P = .02), but no significant difference was observed between the control images and follow-up images in these patients (P = .34). The Wilcoxon matched-pairs signed-rank test revealed a significant difference in that ratio between the pretreatment images and the follow-up images in patients with SIH (P = .04).
On T2-weighted images, there were no statistically significant differences in the ratio of the signal intensity between the control images and the pretreatment images in patients with SIH (P = .19) or between the control images and follow-up images in these patients (P = .25). The Wilcoxon matched-pairs signed-rank test revealed no significant difference in the ratio between the pretreatment images and the follow-up images in patients with SIH (P = .31).
Visual Evaluation
In the visual evaluation, the signal intensity of the subcortical white matter was lower on pretreatment FLAIR images in the patients, with the border between the cortex and subcortical white matter being readily distinguishable (Fig 3A, -B). The areas under the ROC curves with use of mean rating scores rounded off were 0.977 for FLAIR images and 0.560 for T2-weighted images in the control group and pretreatment images in the patients (Fig 4A). On the other hand, in the control group and follow-up images in patients with SIH, ROC analysis provided areas under the ROC curves of 0.383 for FLAIR images and 0.520 for T2-weighted images (Fig 4B). The ROC analysis also provided areas under the ROC curves of 0.989 for FLAIR images and 0.596 for T2-weighted images on pretreatment and follow-up images in the patients (Fig 4C).

A, A pretreatment FLAIR image obtained from case 1 when the symptoms were intense shows that the signal intensity of the subcortical white matter is apparently lower than that of the cortex, with the border between them being readily distinguishable (arrows). B, A follow-up FLAIR image obtained from case 1 when the symptoms improved shows that the signal intensity of the subcortical white matter has become less distinct from that of the cortex.

A, A receiver operating characteristic (ROC) curve in the control group and pretreatment images in patients with SIH. B, An ROC curve in the control group and follow-up images in patients with SIH. C, An ROC curve in pretreatment and follow-up images in patients with SIH.
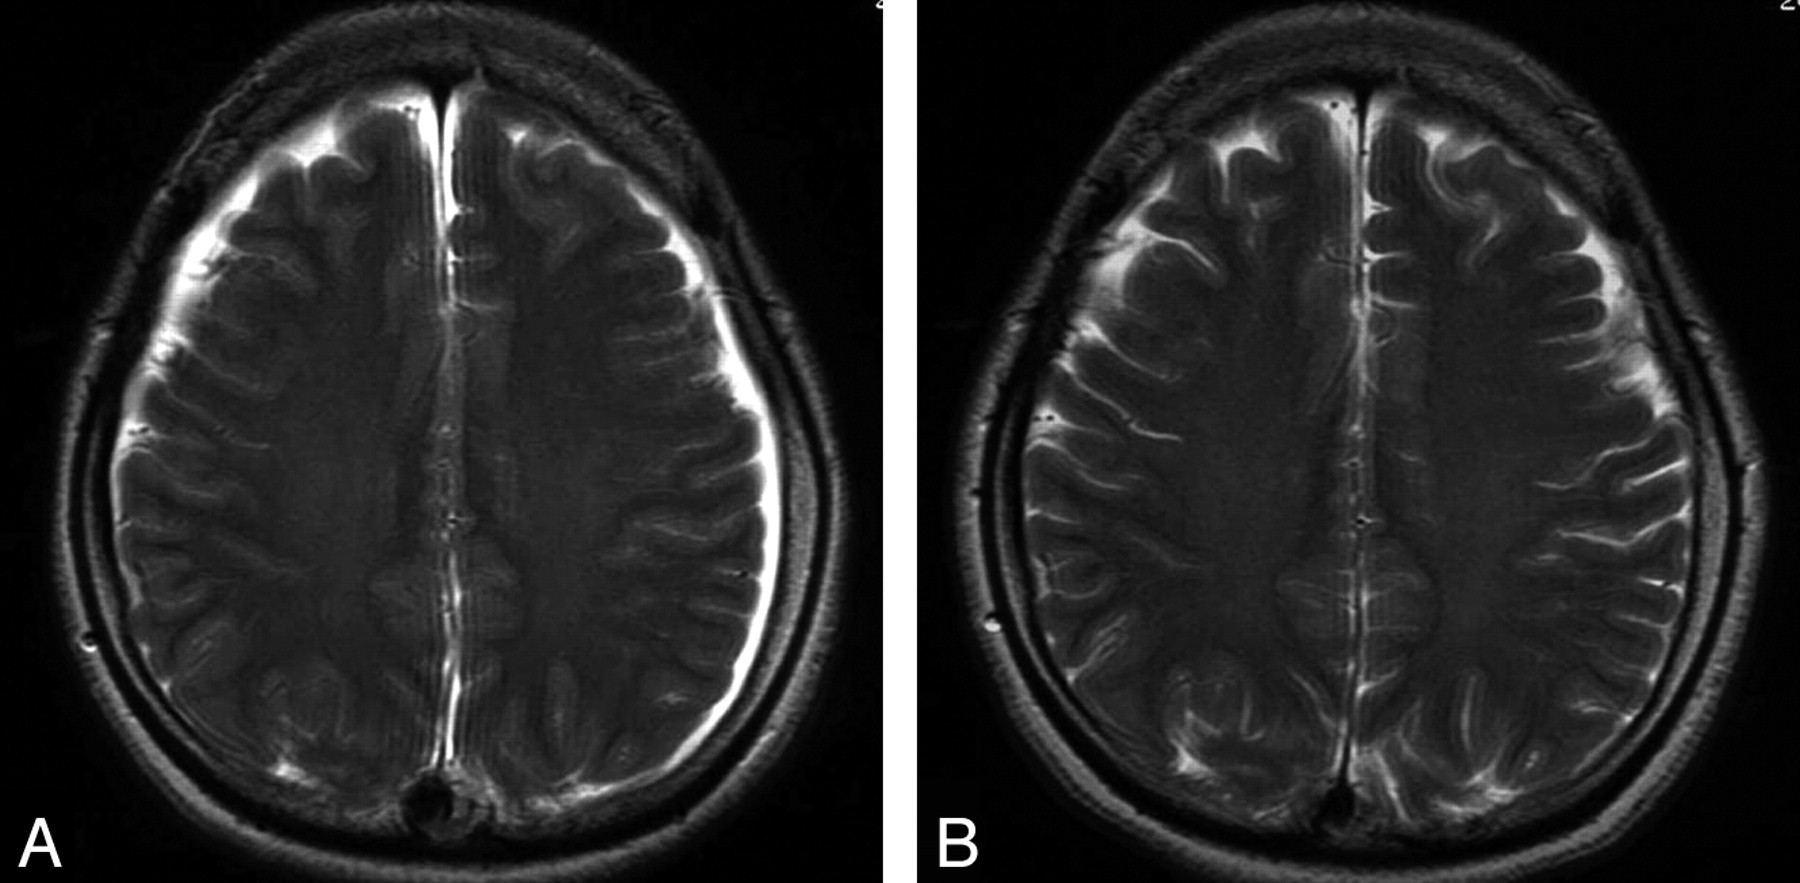
Thus, in SIH, we are convinced that the signal intensity of the subcortical white matter should relatively decrease to the adjacent cortex and corpus callosum on pretreatment FLAIR images and return to that of the control level on the follow-up images. In contrast, on the T2-weighted images we could hardly recognize the decrease in the signal intensity of the subcortical white matter in either the pretreatment or follow-up images in the patients (Fig 5A, -B).

A pretreatment T2-weighted image from case 1 (A) and a follow-up T2-weighted image when the symptoms of SIH resolved (B). Signal intensity alteration of the subcortical white matter is not visually appreciable between pretreatment and follow-up T2-weighted images, though a small amount of subdural effusion seen on the pretreatment image has resolved on the follow-up image.
Discussion
Recently, many reports have described MR imaging findings for SIH, including subdural hematoma or effusion, enlargement of the venous sinuses (eg, the venous distension sign), enlargement of the pituitary gland, pachymeningeal thickening and enhancement, and downward displacement of the brain (sagging brain).1–9 These phenomena can be explained by the Monro-Kellie hypothesis and are considered to be compensative changes for the loss of CSF.10 However, within the brain, the blood-brain barrier restricts the extracellular fluid expansion generating interstitial edema, primarily resulting in an increase in the volume of the vessels and meninges.9
On the other hand, on reviewing MR images of patients with SIH, we visually observed on FLAIR images that the signal intensity of the subcortical white matter was decreased, with the border between the cortex and subcortical white matter being more readily distinguishable than in healthy control subjects. Therefore, we visually and objectively evaluated whether the signal intensity of the subcortical white matter was really decreased relative to that of the adjacent cortex and corpus callosum on FLAIR and T2-weighted images in patients with SIH.
When the ratio of the signal intensity to both the adjacent cortex and corpus callosum was calculated, a statistically significant decrease in the signal intensity in the cerebral subcortical white matter was revealed on pretreatment FLAIR images in patients with SIH compared with healthy control subjects. The signal intensity on the FLAIR images returned to the level of the control group at the follow-up stage, indicating that in both the visual and measurement evaluation the signal intensity in the subcortical white matter on pretreatment images is certainly lower when the pretreatment images can be compared with the follow-up images as a reference.
However, in the T2-weighted images, there was a discrepancy between the signal intensity ratios of the subcortical white matter to the cortex and to the corpus callosum. Although the mechanism of the alteration in signal intensity of the subcortical white matter on FLAIR and T2-weighted images in SIH remains unclear, we have hypothesized that the signal intensity alteration might be more likely to represent a susceptibility effect from the increased amount of deoxyhemoglobin related to venous stasis, probably associated with compensatory venous distension in SIH, which would involve not only the venous sinuses but also the medullary veins, particularly in the subcortical white matter. The magnetic susceptibility effect should influence T2 relaxation time and cause a signal intensity decrease on T2-weighted imaging. In our study, the TR (8004 ms) and TE (139 ms) on FLAIR imaging were longer than those on T2-weighted imaging (TR, 4000 ms; TE, 102 ms), so that FLAIR imaging is likely to be more sensitive to the signal intensity change than T2-weighted imaging. There is a possibility that lower sensitivity to the magnetic susceptibility effect of T2-weighted imaging would cause the discrepancy in the signal intensity ratios on T2-weighted imaging. In this regard, a more meaningful measure might have been not a signal intensity ratio but T2 relaxation rates, which were not executable because of retrospective nature of the study.
On the other hand, on visual evaluation the insensitive discrimination on T2-weighted images may be attributable to the inherent low signal intensity in the subcortical white matter, possibly because the subcortical U-fiber is known to be enriched in iron deposition and is heavily myelinated.11–13
To our knowledge, this study is the first to describe alteration in signal intensity within the brain on MR images in patients with SIH. Similar low intensity in the subcortical white matter has been reported in some other entities on FLAIR or on T2-weighted images. They include early cortical ischemia, diffuse axonal injury after head trauma, subtle white matter injury after preterm birth, hypoxic brain damage with cortical laminar necrosis, and nonketotic hyperglycemic hyperosmolar state with seizures.14–18 However, we presume that SIH can be differentiated from these conditions by examining the histories of ischemia, hypoxia, head trauma, preterm birth, and seizure. Gyriform or laminar enhancement in the affected cortex would also aid in the diagnosis of ischemia and cortical laminar necrosis.14,17
Thus, together with clinical information including the patient's history, the decrease in signal intensity of the subcortical white matter on FLAIR images should be useful to support a diagnosis of SIH. Particularly in cases having no characteristic MR findings of SIH, such as pachymeningeal thickening or enhancement, which is noted in up to 20% of patients with SIH,1 awareness of this MR finding, if present, could help as a diagnostic clue to SIH, which could then be confirmed by postcontrast MR imaging, CSF pressure measurement, CT myelography, and so on.
Our study had some limitations. First, the number of patients with SIH we examined was small. To analyze this finding in greater detail, including its preferential location and to obtain combination of sensitivity and specificity in visual evaluation, a larger series must be examined. Alternatively, our subjects displayed almost the full characteristic MR imaging findings of SIH; therefore, whether the signal intensity alteration in the subcortical white matter would appear on FLAIR images in the absence of numerous other MR imaging abnormalities has not been clarified.
Conclusions
We have demonstrated a relative decrease in signal intensity in the subcortical white matter on FLAIR images in patients with SIH. This finding could help support a diagnosis of SIH.
References
- Received October 17, 2008.
- Accepted after revision December 9, 2008.
- Copyright © American Society of Neuroradiology


